Tag Archives: Google Maps

Simulations illuminate the path to post-event traffic flow

Fifteen minutes. That’s how long it took to empty the Colosseum, an engineering marvel that’s still standing as the largest amphitheater in the world. Two thousand years later, this design continues to work well to move enormous crowds out of sporting and entertainment venues.

But of course, exiting the arena is only the first step. Next, people must navigate the traffic that builds up in the surrounding streets. This is an age-old problem that remains unsolved to this day. In Rome, they addressed the issue by prohibiting private traffic on the street that passes directly by the Colosseum. This policy worked there, but what if you’re not in Rome? What if you’re at the Superbowl? Or at a Taylor Swift concert?

An approach to addressing this problem is to use simulation models, sometimes called "digital twins", which are virtual replicas of real-world transportation networks that attempt to capture every detail from the layout of streets and intersections to the flow of vehicles. These models allow traffic experts to mitigate congestion, reduce accidents, and improve the experience of drivers, riders, and walkers alike. Previously, our team used these models to quantify sustainability impact of routing, test evacuation plans and show simulated traffic in Maps Immersive View.

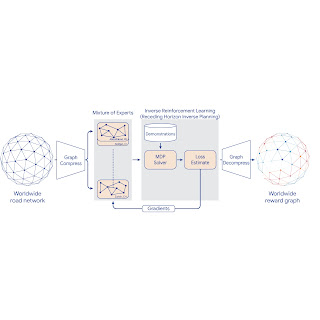
Calibrating high-resolution traffic simulations to match the specific dynamics of a particular setting is a longstanding challenge in the field. The availability of aggregate mobility data, detailed Google Maps road network data, advances in transportation science (such as understanding the relationship between segment demands and speeds for road segments with traffic signals), and calibration techniques which make use of speed data in physics-informed traffic models are paving the way for compute-efficient optimization at a global scale.

To test this technology in the real world, Google Research partnered with the Seattle Department of Transportation (SDOT) to develop simulation-based traffic guidance plans. Our goal is to help thousands of attendees of major sports and entertainment events leave the stadium area quickly and safely. The proposed plan reduced average trip travel times by 7 minutes for vehicles leaving the stadium region during large events. We deployed it in collaboration with SDOT using Dynamic Message Signs (DMS) and verified impact over multiple events between August and November, 2023.

One policy recommendation we made was to divert traffic from S Spokane St, a major thoroughfare that connects the area to highways I-5 and SR 99, and is often congested after events. Suggested changes improved the flow of traffic through highways and arterial streets near the stadium, and reduced the length of vehicle queues that formed behind traffic signals. (Note that vehicles are larger than reality in this clip for demonstration.)

Simulation model

For this project, we created a new simulation model of the area around Seattle’s stadiums. The intent for this model is to replay each traffic situation for a specified day as closely as possible. We use an open-source simulation software, Simulation of Urban MObility (SUMO). SUMO’s behavioral models help us describe traffic dynamics, for instance, how drivers make decisions, like car-following, lane-changing and speed limit compliance. We also use insights from Google Maps to define the network’s structure and various static segment attributes (e.g., number of lanes, speed limit, presence of traffic lights).

Overview of the Simulation framework.

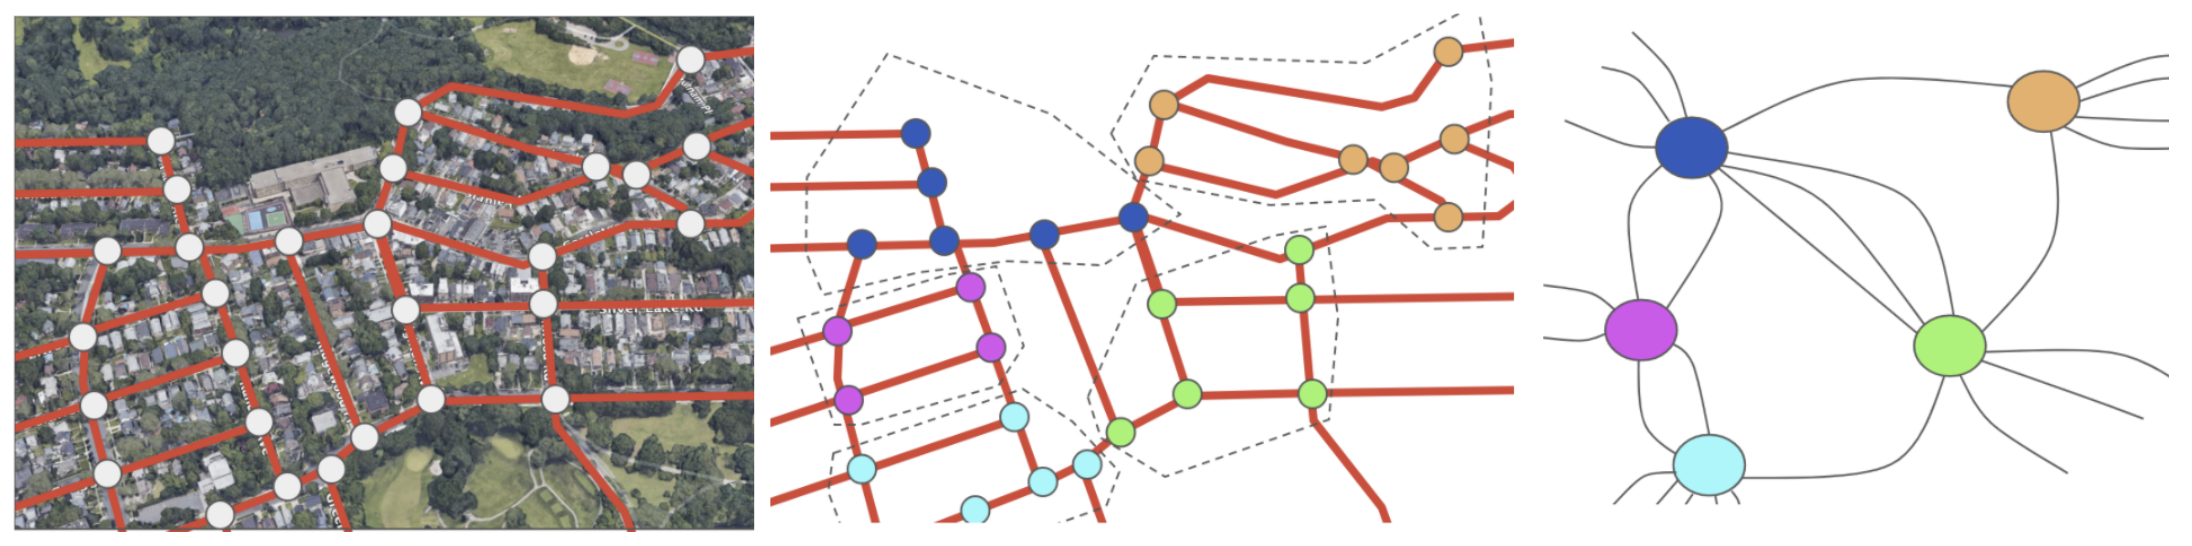
Travel demand is an important simulator input. To compute it, we first decompose the road network of a given metropolitan area into zones, specifically level 13 S2 cells with 1.27 km2 area per cell. From there, we define the travel demand as the expected number of trips that travel from an origin zone to a destination zone in a given time period. The demand is represented as aggregated origin–destination (OD) matrices.

To get the initial expected number of trips between an origin zone and a destination zone, we use aggregated and anonymized mobility statistics. Then we solve the OD calibration problem by combining initial demand with observed traffic statistics, like segment speeds, travel times and vehicular counts, to reproduce event scenarios.

We model the traffic around multiple past events in Seattle’s T-Mobile Park and Lumen Field and evaluate the accuracy by computing aggregated and anonymized traffic statistics. Analyzing these event scenarios helps us understand the effect of different routing policies on congestion in the region.

Heatmaps demonstrate a substantial increase in numbers of trips in the region after a game as compared to the same time on a non-game day.
The graph shows observed segment speeds on the x-axis and simulated speeds on the y-axis for a modeled event. The concentration of data points along the red x=y line demonstrates the ability of the simulation to reproduce realistic traffic conditions.

Routing policies

SDOT and the Seattle Police Department’s (SPD) local knowledge helped us determine the most congested routes that needed improvement:

  • Traffic from T-Mobile Park stadium parking lot’s Edgar Martinez Dr. S exit to eastbound I-5 highway / westbound SR 99 highway
  • Traffic through Lumen Field stadium parking lot to northbound Cherry St. I-5 on-ramp
  • Traffic going southbound through Seattle’s SODO neighborhood to S Spokane St.

We developed routing policies and evaluated them using the simulation model. To disperse traffic faster, we tried policies that would route northbound/southbound traffic from the nearest ramps to further highway ramps, to shorten the wait times. We also experimented with opening HOV lanes to event traffic, recommending alternate routes (e.g., SR 99), or load sharing between different lanes to get to the nearest stadium ramps.


Evaluation results

We model multiple events with different traffic conditions, event times, and attendee counts. For each policy, the simulation reproduces post-game traffic and reports the travel time for vehicles, from departing the stadium to reaching their destination or leaving the Seattle SODO area. The time savings are computed as the difference of travel time before/after the policy, and are shown in the below table, per policy, for small and large events. We apply each policy to a percentage of traffic, and re-estimate the travel times. Results are shown if 10%, 30%, or 50% of vehicles are affected by a policy.

Based on these simulation results, the feasibility of implementation, and other considerations, SDOT has decided to implement the “Northbound Cherry St ramp” and “Southbound S Spokane St ramp” policies using DMS during large events. The signs suggest drivers take alternative routes to reach their destinations. The combination of these two policies leads to an average of 7 minutes of travel time savings per vehicle, based on rerouting 30% of traffic during large events.


Conclusion

This work demonstrates the power of simulations to model, identify, and quantify the effect of proposed traffic guidance policies. Simulations allow network planners to identify underused segments and evaluate the effects of different routing policies, leading to a better spatial distribution of traffic. The offline modeling and online testing show that our approach can reduce total travel time. Further improvements can be made by adding more traffic management strategies, such as optimizing traffic lights. Simulation models have been historically time consuming and hence affordable only for the largest cities and high stake projects. By investing in more scalable techniques, we hope to bring these models to more cities and use cases around the world.


Acknowledgements

In collaboration with Alex Shashko, Andrew Tomkins, Ashley Carrick, Carolina Osorio, Chao Zhang, Damien Pierce, Iveel Tsogsuren, Sheila de Guia, and Yi-fan Chen. Visual design by John Guilyard. We would like to thank our SDOT partners Carter Danne, Chun Kwan, Ethan Bancroft, Jason Cambridge, Laura Wojcicki, Michael Minor, Mohammed Said, Trevor Partap, and SPD partners Lt. Bryan Clenna and Sgt. Brian Kokesh.

Source: Google AI Blog


World scale inverse reinforcement learning in Google Maps

Routing in Google Maps remains one of our most helpful and frequently used features. Determining the best route from A to B requires making complex trade-offs between factors including the estimated time of arrival (ETA), tolls, directness, surface conditions (e.g., paved, unpaved roads), and user preferences, which vary across transportation mode and local geography. Often, the most natural visibility we have into travelers' preferences is by analyzing real-world travel patterns.

Learning preferences from observed sequential decision making behavior is a classic application of inverse reinforcement learning (IRL). Given a Markov decision process (MDP) — a formalization of the road network — and a set of demonstration trajectories (the traveled routes), the goal of IRL is to recover the users' latent reward function. Although past research has created increasingly general IRL solutions, these have not been successfully scaled to world-sized MDPs. Scaling IRL algorithms is challenging because they typically require solving an RL subroutine at every update step. At first glance, even attempting to fit a world-scale MDP into memory to compute a single gradient step appears infeasible due to the large number of road segments and limited high bandwidth memory. When applying IRL to routing, one needs to consider all reasonable routes between each demonstration's origin and destination. This implies that any attempt to break the world-scale MDP into smaller components cannot consider components smaller than a metropolitan area.

To this end, in "Massively Scalable Inverse Reinforcement Learning in Google Maps", we share the result of a multi-year collaboration among Google Research, Maps, and Google DeepMind to surpass this IRL scalability limitation. We revisit classic algorithms in this space, and introduce advances in graph compression and parallelization, along with a new IRL algorithm called Receding Horizon Inverse Planning (RHIP) that provides fine-grained control over performance trade-offs. The final RHIP policy achieves a 16–24% relative improvement in global route match rate, i.e., the percentage of de-identified traveled routes that exactly match the suggested route in Google Maps. To the best of our knowledge, this represents the largest instance of IRL in a real world setting to date.

Google Maps improvements in route match rate relative to the existing baseline, when using the RHIP inverse reinforcement learning policy.


The benefits of IRL

A subtle but crucial detail about the routing problem is that it is goal conditioned, meaning that every destination state induces a slightly different MDP (specifically, the destination is a terminal, zero-reward state). IRL approaches are well suited for these types of problems because the learned reward function transfers across MDPs, and only the destination state is modified. This is in contrast to approaches that directly learn a policy, which typically require an extra factor of S parameters, where S is the number of MDP states.

Once the reward function is learned via IRL, we take advantage of a powerful inference-time trick. First, we evaluate the entire graph's rewards once in an offline batch setting. This computation is performed entirely on servers without access to individual trips, and operates only over batches of road segments in the graph. Then, we save the results to an in-memory database and use a fast online graph search algorithm to find the highest reward path for routing requests between any origin and destination. This circumvents the need to perform online inference of a deeply parameterized model or policy, and vastly improves serving costs and latency.

Reward model deployment using batch inference and fast online planners.


Receding Horizon Inverse Planning

To scale IRL to the world MDP, we compress the graph and shard the global MDP using a sparse Mixture of Experts (MoE) based on geographic regions. We then apply classic IRL algorithms to solve the local MDPs, estimate the loss, and send gradients back to the MoE. The worldwide reward graph is computed by decompressing the final MoE reward model. To provide more control over performance characteristics, we introduce a new generalized IRL algorithm called Receding Horizon Inverse Planning (RHIP).

IRL reward model training using MoE parallelization, graph compression, and RHIP.

RHIP is inspired by people’s tendency to perform extensive local planning ("What am I doing for the next hour?") and approximate long-term planning ("What will my life look like in 5 years?"). To take advantage of this insight, RHIP uses robust yet expensive stochastic policies in the local region surrounding the demonstration path, and switches to cheaper deterministic planners beyond some horizon. Adjusting the horizon H allows controlling computational costs, and often allows the discovery of the performance sweet spot. Interestingly, RHIP generalizes many classic IRL algorithms and provides the novel insight that they can be viewed along a stochastic vs. deterministic spectrum (specifically, for H=∞ it reduces to MaxEnt, for H=1 it reduces to BIRL, and for H=0 it reduces to MMP).

Given a demonstration from so to sd, (1) RHIP follows a robust yet expensive stochastic policy in the local region surrounding the demonstration (blue region). (2) Beyond some horizon H, RHIP switches to following a cheaper deterministic planner (red lines). Adjusting the horizon enables fine-grained control over performance and computational costs.


Routing wins

The RHIP policy provides a 15.9% and 24.1% lift in global route match rate for driving and two-wheelers (e.g., scooters, motorcycles, mopeds) relative to the well-tuned Maps baseline, respectively. We're especially excited about the benefits to more sustainable transportation modes, where factors beyond journey time play a substantial role. By tuning RHIP's horizon H, we're able to achieve a policy that is both more accurate than all other IRL policies and 70% faster than MaxEnt.

Our 360M parameter reward model provides intuitive wins for Google Maps users in live A/B experiments. Examining road segments with a large absolute difference between the learned rewards and the baseline rewards can help improve certain Google Maps routes. For example:

Nottingham, UK. The preferred route (blue) was previously marked as private property due to the presence of a large gate, which indicated to our systems that the road may be closed at times and would not be ideal for drivers. As a result, Google Maps routed drivers through a longer, alternate detour instead (red). However, because real-world driving patterns showed that users regularly take the preferred route without an issue (as the gate is almost never closed), IRL now learns to route drivers along the preferred route by placing a large positive reward on this road segment.


Conclusion

Increasing performance via increased scale – both in terms of dataset size and model complexity – has proven to be a persistent trend in machine learning. Similar gains for inverse reinforcement learning problems have historically remained elusive, largely due to the challenges with handling practically sized MDPs. By introducing scalability advancements to classic IRL algorithms, we're now able to train reward models on problems with hundreds of millions of states, demonstration trajectories, and model parameters, respectively. To the best of our knowledge, this is the largest instance of IRL in a real-world setting to date. See the paper to learn more about this work.


Acknowledgements

This work is a collaboration across multiple teams at Google. Contributors to the project include Matthew Abueg, Oliver Lange, Matt Deeds, Jason Trader, Denali Molitor, Markus Wulfmeier, Shawn O'Banion, Ryan Epp, Renaud Hartert, Rui Song, Thomas Sharp, Rémi Robert, Zoltan Szego, Beth Luan, Brit Larabee and Agnieszka Madurska.

We’d also like to extend our thanks to Arno Eigenwillig, Jacob Moorman, Jonathan Spencer, Remi Munos, Michael Bloesch and Arun Ahuja for valuable discussions and suggestions.

Source: Google AI Blog


Reconstructing indoor spaces with NeRF

When choosing a venue, we often find ourselves with questions like the following: Does this restaurant have the right vibe for a date? Is there good outdoor seating? Are there enough screens to watch the game? While photos and videos may partially answer questions like these, they are no substitute for feeling like you’re there, even when visiting in person isn't an option.

Immersive experiences that are interactive, photorealistic, and multi-dimensional stand to bridge this gap and recreate the feel and vibe of a space, empowering users to naturally and intuitively find the information they need. To help with this, Google Maps launched Immersive View, which uses advances in machine learning (ML) and computer vision to fuse billions of Street View and aerial images to create a rich, digital model of the world. Beyond that, it layers helpful information on top, like the weather, traffic, and how busy a place is. Immersive View provides indoor views of restaurants, cafes, and other venues to give users a virtual up-close look that can help them confidently decide where to go.

Today we describe the work put into delivering these indoor views in Immersive View. We build on neural radiance fields (NeRF), a state-of-the-art approach for fusing photos to produce a realistic, multi-dimensional reconstruction within a neural network. We describe our pipeline for creation of NeRFs, which includes custom photo capture of the space using DSLR cameras, image processing and scene reproduction. We take advantage of Alphabet’s recent advances in the field to design a method matching or outperforming the prior state-of-the-art in visual fidelity. These models are then embedded as interactive 360° videos following curated flight paths, enabling them to be available on smartphones.


The reconstruction of The Seafood Bar in Amsterdam in Immersive View.


From photos to NeRFs

At the core of our work is NeRF, a recently-developed method for 3D reconstruction and novel view synthesis. Given a collection of photos describing a scene, NeRF distills these photos into a neural field, which can then be used to render photos from viewpoints not present in the original collection.

While NeRF largely solves the challenge of reconstruction, a user-facing product based on real-world data brings a wide variety of challenges to the table. For example, reconstruction quality and user experience should remain consistent across venues, from dimly-lit bars to sidewalk cafes to hotel restaurants. At the same time, privacy should be respected and any potentially personally identifiable information should be removed. Importantly, scenes should be captured consistently and efficiently, reliably resulting in high-quality reconstructions while minimizing the effort needed to capture the necessary photographs. Finally, the same natural experience should be available to all mobile users, regardless of the device on hand.


The Immersive View indoor reconstruction pipeline.


Capture & preprocessing

The first step to producing a high-quality NeRF is the careful capture of a scene: a dense collection of photos from which 3D geometry and color can be derived. To obtain the best possible reconstruction quality, every surface should be observed from multiple different directions. The more information a model has about an object’s surface, the better it will be in discovering the object’s shape and the way it interacts with lights.

In addition, NeRF models place further assumptions on the camera and the scene itself. For example, most of the camera’s properties, such as white balance and aperture, are assumed to be fixed throughout the capture. Likewise, the scene itself is assumed to be frozen in time: lighting changes and movement should be avoided. This must be balanced with practical concerns, including the time needed for the capture, available lighting, equipment weight, and privacy. In partnership with professional photographers, we developed a strategy for quickly and reliably capturing venue photos using DSLR cameras within only an hour timeframe. This approach has been used for all of our NeRF reconstructions to date.

Once the capture is uploaded to our system, processing begins. As photos may inadvertently contain sensitive information, we automatically scan and blur personally identifiable content. We then apply a structure-from-motion pipeline to solve for each photo's camera parameters: its position and orientation relative to other photos, along with lens properties like focal length. These parameters associate each pixel with a point and a direction in 3D space and constitute a key signal in the NeRF reconstruction process.


NeRF reconstruction

Unlike many ML models, a new NeRF model is trained from scratch on each captured location. To obtain the best possible reconstruction quality within a target compute budget, we incorporate features from a variety of published works on NeRF developed at Alphabet. Some of these include:

  • We build on mip-NeRF 360, one of the best-performing NeRF models to date. While more computationally intensive than Nvidia's widely-used Instant NGP, we find the mip-NeRF 360 consistently produces fewer artifacts and higher reconstruction quality.
  • We incorporate the low-dimensional generative latent optimization (GLO) vectors introduced in NeRF in the Wild as an auxiliary input to the model’s radiance network. These are learned real-valued latent vectors that embed appearance information for each image. By assigning each image in its own latent vector, the model can capture phenomena such as lighting changes without resorting to cloudy geometry, a common artifact in casual NeRF captures.
  • We also incorporate exposure conditioning as introduced in Block-NeRF. Unlike GLO vectors, which are uninterpretable model parameters, exposure is directly derived from a photo's metadata and fed as an additional input to the model’s radiance network. This offers two major benefits: it opens up the possibility of varying ISO and provides a method for controlling an image’s brightness at inference time. We find both properties invaluable for capturing and reconstructing dimly-lit venues.

We train each NeRF model on TPU or GPU accelerators, which provide different trade-off points. As with all Google products, we continue to search for new ways to improve, from reducing compute requirements to improving reconstruction quality.


A side-by-side comparison of our method and a mip-NeRF 360 baseline.


A scalable user experience

Once a NeRF is trained, we have the ability to produce new photos of a scene from any viewpoint and camera lens we choose. Our goal is to deliver a meaningful and helpful user experience: not only the reconstructions themselves, but guided, interactive tours that give users the freedom to naturally explore spaces from the comfort of their smartphones.

To this end, we designed a controllable 360° video player that emulates flying through an indoor space along a predefined path, allowing the user to freely look around and travel forward or backwards. As the first Google product exploring this new technology, 360° videos were chosen as the format to deliver the generated content for a few reasons.

On the technical side, real-time inference and baked representations are still resource intensive on a per-client basis (either on device or cloud computed), and relying on them would limit the number of users able to access this experience. By using videos, we are able to scale the storage and delivery of videos to all users by taking advantage of the same video management and serving infrastructure used by YouTube. On the operations side, videos give us clearer editorial control over the exploration experience and are easier to inspect for quality in large volumes.

While we had considered capturing the space with a 360° camera directly, using a NeRF to reconstruct and render the space has several advantages. A virtual camera can fly anywhere in space, including over obstacles and through windows, and can use any desired camera lens. The camera path can also be edited post-hoc for smoothness and speed, unlike a live recording. A NeRF capture also does not require the use of specialized camera hardware.

Our 360° videos are rendered by ray casting through each pixel of a virtual, spherical camera and compositing the visible elements of the scene. Each video follows a smooth path defined by a sequence of keyframe photos taken by the photographer during capture. The position of the camera for each picture is computed during structure-from-motion, and the sequence of pictures is smoothly interpolated into a flight path.

To keep speed consistent across different venues, we calibrate the distances for each by capturing pairs of images, each of which is 3 meters apart. By knowing measurements in the space, we scale the generated model, and render all videos at a natural velocity.

The final experience is surfaced to the user within Immersive View: the user can seamlessly fly into restaurants and other indoor venues and discover the space by flying through the photorealistic 360° videos.


Open research questions

We believe that this feature is the first step of many in a journey towards universally accessible, AI-powered, immersive experiences. From a NeRF research perspective, more questions remain open. Some of these include:

  1. Enhancing reconstructions with scene segmentation, adding semantic information to the scenes that could make scenes, for example, searchable and easier to navigate.
  2. Adapting NeRF to outdoor photo collections, in addition to indoor. In doing so, we'd unlock similar experiences to every corner of the world and change how users could experience the outdoor world.
  3. Enabling real-time, interactive 3D exploration through neural-rendering on-device.


Reconstruction of an outdoor scene with a NeRF model trained on Street View panoramas.

As we continue to grow, we look forward to engaging with and contributing to the community to build the next generation of immersive experiences.


Acknowledgments

This work is a collaboration across multiple teams at Google. Contributors to the project include Jon Barron, Julius Beres, Daniel Duckworth, Roman Dudko, Magdalena Filak, Mike Harm, Peter Hedman, Claudio Martella, Ben Mildenhall, Cardin Moffett, Etienne Pot, Konstantinos Rematas, Yves Sallat, Marcos Seefelder, Lilyana Sirakovat, Sven Tresp and Peter Zhizhin.

Also, we’d like to extend our thanks to Luke Barrington, Daniel Filip, Tom Funkhouser, Charles Goran, Pramod Gupta, Mario Lučić, Isalo Montacute and Dan Thomasset for valuable feedback and suggestions.

Source: Google AI Blog


Navigating new routes, places and distance: Introducing Google Maps Platform to Dev Library

Posted by Swathi Dharshna Subbaraj, Project Coordinator, Google Dev Library

We are excited to announce that Google Maps Platform has now been officially added to the Dev Library! Continuous innovation and the integration of technology into our physical environment have become increasingly important. One product, Google Maps, has played a critical role in shaping the future of the internet. With these resources, developers have created applications that enable them to visualize geospatial data and build projects ranging from hyperlocal logistics to location-driven app development.

By adding Google Maps Platform, Dev Library contributors will be better able to create innovative and useful applications that utilize Google’s mapping, places, and routing data and features. Developers now have access to even more resources that can help take their projects to the next level.

As Alex Muramoto, the Google Maps Platform curator for Dev Library, said,“We’re excited to see developers across tech stacks using Google Maps Platform to build and showcase their projects on Google Dev Library. We hope these projects will provide inspiration and guidance to help your own development efforts”.

Let's explore some contributions from Dev Library authors who have implemented Google Maps Platform APIs and SDKs into their applications.


Contributions in Spotlights:


Flutter Maps by Souvik Biswas

This app uses Google Maps SDK & Directions API on flutter framework. It offers several location-based functionalities, including the ability to detect the user's current location.

It also utilizes Geocoding to convert addresses into coordinates and vice versa, and allows users to add markers to the map view. Moreover, it enables the drawing of routes between two places through the use of Polylines and Directions API, and calculates the actual distance of the route.

Learn more about Flutter Maps


How to integrate a customized Google Map in Flutter by Jaimil Patel

Learn how to use the Google Maps Flutter plugin to display a customized Google Maps view.

Explore key customization features like configuring the integration with Google Maps, adding a custom style to the map, and fetching the current location with the user's permission.

Learn more about the blog post

Customize the Google Map marker icon In Flutter by Lakshydeep Vikram

Learn how to use the Google Maps Flutter plugin to display a customized Google Maps view.

EDiscover how to customize a Google Maps marker icon by adding an image of your choice in Flutter in just a few steps: add the Google Maps Flutter plugin to the Flutter application, then describe how to use the GoogleMap widget provided by the plugin to display the map on the screen.

See how it's done

Google Dev Library is a platform for showcasing open-source projects and technical blogs featuring Google technologies. Join our global community of developers and showcase your Google Maps projects by submitting your content to the Dev Library.

Google Workspace Updates Weekly Recap – September 2, 2022

New updates 

Unless otherwise indicated, the features below are fully launched or in the process of rolling out (rollouts should take no more than 15 business days to complete), launching to both Rapid and Scheduled Release at the same time (if not, each stage of rollout should take no more than 15 business days to complete), and available to all Google Workspace and G Suite customers. 


Refining notifications on the Google Classroom app 
We’ve made the following improvement to Google Classroom notifications: 
In addition to setting your preference for Classroom push notifications, you can now tailor your email notifications from Android or iOS mobile devices. | Learn more.


The text for all push notifications has been updated and we’ve enhanced Classroom action options, such as “Join class” or “View comment.” With this update, Classroom push notifications are much clearer and more actionable. | Learn more. 

These features are available now to Education Fundamentals, Education Plus, Education Standard, the Teaching and Learning Upgrade customers only. 


Insert Google Maps place chips into Google Docs
Last year, we added the ability for you to insert a Google Maps place chip into a Google Doc by pasting a Maps link directly into the document. Now, you can insert place chips into your Docs using the @ menu. | Roll out to Rapid Release began August 22, 2022; launch to Scheduled Release planned for September 8, 2022. | Learn more. 


Google Meet now automatically adjusts the volume of meeting participants 
With meeting participants using various devices to join a meeting, this can lead to discrepancies in volume, with some participants sounding louder than others. Meet will adjust the audio of all participants, helping to ensure everyone is equally loud. To take advantage of this feature, make sure noise cancellation is turned on. We hope this makes for smoother meetings, with less disruptions. 


Available to Google Workspace Business Standard, Business Plus, Enterprise Essentials, Enterprise Standard, Enterprise Plus, Education Plus, the Teaching and Learning Upgrade, Frontline, and Individual customers 


Previous announcements 

The announcements below were published on the Workspace Updates blog earlier this week. Please refer to the original blog posts for complete details. 


Dark Canvas theme now available on Google Meet hardware home screen 
We’re adding support for a dark home page theme for Google Meet hardware devices. When using Dark Canvas, devices will now feature dark user interface elements on the home screen when not in an active call. | Available for all supported Google Meet hardware devices that have not yet reached their auto-update expiration date. | Learn more.


Easily customize digital signage on your Google Meet hardware through Appspace 
We’re giving admins more options for customization by using their Appspace digital signage content. | Learn more. 


Insert emojis inline with text in Google Docs 
You can now express yourself in a new way by searching for and inserting emojis directly inline with your text in Google Docs. | Learn more. 


Work Insights reporting for Google Chat and Google Meet 
With the recent upgrade from Hangouts to Google Chat for Google Workspace customers, we’re pleased to introduce a Work Insights product for Meet and Chat. Work Insights allows for optimal visibility into your organization’s digital transformation journey, and helps to improve collaboration, promote growth, and much more. | Learn More. | Available to Google Workspace Enterprise Plus customers 


Google Hangouts will be fully upgraded to Google Chat starting November 1, 2022 
As a final step in the migration, beginning November 1, 2022, Google Hangouts on web will redirect to Google Chat on web, and Hangouts will no longer be accessible. Admins will receive an email containing more information about this change, as well as changes in Vault and exporting Hangouts data. | Learn More. 


For a recap of announcements in the past six months, check out What’s new in Google Workspace (recent releases).

Efficient Partitioning of Road Networks

Design techniques based on classical algorithms have proved useful for recent innovation on several large-scale problems, such as travel itineraries and routing challenges. For example, Dijkstra’s algorithm is often used to compute routes in graphs, but the size of the computation can increase quickly beyond the scale of a small town. The process of "partitioning" a road network, however, can greatly speed up algorithms by effectively shrinking how much of the graph is searched during computation.

In this post, we cover how we engineered a graph partitioning algorithm for road networks using ideas from classic algorithms, parts of which were presented in “Sketch-based Algorithms for Approximate Shortest Paths in Road Networks” at WWW 2021. Using random walks, a classical concept that is counterintuitively useful for computing shortest routes by decreasing the network size significantly, our algorithm can find a high quality partitioning of the whole road network of the North America continent nearly an order of magnitude faster1 than other partitioning algorithms with similar output qualities.

Using Graphs to Model Road Networks
There is a well-known and useful correspondence between road networks and graphs, where intersections become nodes and roads become edges.

Image from Wikipedia

To understand how routing might benefit from partitioning, consider the most well-known solution for finding the fastest route: the Dijkstra algorithm, which works in a breadth-first search manner. The Dijkstra algorithm performs an exhaustive search starting from the source until it finds the destination. Because of this, as the distance between the source and the destination increases, the computation can become an order of magnitude slower. For example, it is faster to compute a route inside Seattle, WA than from Seattle, WA to San Francisco, CA. Moreover, even for intra-metro routes, the exhaustive volume of space explored by the Dijkstra algorithm during computation results in an impractical latency on the order of seconds. However, identifying regions that have more connections inside themselves, but fewer connections to the outside (such as Staten Island, NY) makes it possible to split the computation into multiple, smaller chunks.

Top: A routing problem around Staten Island, NY. Bottom: Corresponding partitioning as a graph. Blue nodes indicate the only entrances to/exits from Staten Island.

Consider driving from point A to point B in the above image. Once one decides where to enter Staten Island (Outerbridge or Goethals) and where to exit (Verrazzano), the problem can be broken into the three smaller pieces of driving: To the entrance, the exit, and then the destination using the best route available. That means a routing algorithm only needs to consider these special points (beacons) to navigate between points A and B and can thus find the shortest accurate path faster.

Note that beacons are only useful as long as there are not too many of them—the fewer beacons there are, the fewer shortcuts need to be added, the smaller the search space, and the faster the computation—so a good partitioning should have relatively fewer beacons for the number of components (i.e., a particular area of a road network).

As the example of Staten Island illustrates, real-life road networks have many beacons (special points such as bridges, tunnels, or mountain passes) that result in some areas being very well-connected (e.g., with large grids of streets) and others being poorly connected (e.g., an island only accessible via a couple of bridges). The question becomes how to efficiently define the components and identify the smallest number of beacons that connect the road network.

Our Partitioning Algorithm
Because each connection between two components is a potential beacon, the approach we take to ensure there are not too many beacons is to divide the road network in a way that minimizes the number of connections between components.

To do this, we start by dividing the network into two balanced (i.e., of similar size) components while also minimizing the number of roads that connect those two components, which results in an effectively small ratio of beacons to roads in each component. Then, the algorithm keeps dividing the network into two at a time until all the components reach the desired size, in terms of the number of roads inside, that yields a useful multi-component partition. There is a careful balance here: If the size is too small, we will get too many beacons; whereas if it is too large, then it will be useful only for long routes. Therefore the size is left as an input parameter and found through experimentation when the algorithm is being finalized.

While there are numerous partitioning schemes, such as METIS (for general networks), PUNCH and inertial-flow (both optimized for road-network likes), our solution is based on the inertial-flow algorithm, augmented to run as efficiently on whole continents as it does on cities.

Balanced Partitioning for Road Networks
How does one divide a road network represented as a graph into two balanced components, as mentioned above? A first step is to make a graph smaller by grouping closely connected nodes together, which allows us to speed up the following two-way partitioning phase. This is where a random walk is useful.

Random walks enjoy many useful theoretical properties—which is why they have been used to study a range of topics from the motion of mosquitoes in a forest to heat diffusion—and that most relevant for our application is that they tend to get “trapped” in regions that are well connected inside but poorly connected outside. Consider a random walk on the streets of Staten Island for a fixed number of steps: because relatively few roads exit the island, most of the steps happen inside the island, and the probability of stepping outside the island is low.

Illustration of a random walk. Suppose the blue graph is a hypothetical road network corresponding to Staten Island. 50 random walks are performed, all starting at the middle point. Each random walk continues for 10 steps or until it steps out of the island. The numbers at each node depict how many times they were visited by a random walk. By the end, any node inside the island is visited much more frequently than the nodes outside.

After finding these small components, which will be highly connected nodes grouped together (such as Staten Island in the above example), the algorithm contracts each group into a new, single node.

Reducing the size of the original graph (left) by finding groups of nodes (middle) and coalescing each group into a single “super” node (right). Example here chosen manually to better illustrate the rest of the algorithm.

The final steps of the algorithm are to partition this much smaller graph into two parts and then refine the partitioning on this small graph to one on the original graph of the road network. We then use the inertial flow algorithm to find the cut on the smaller graph that minimizes the ratio of beacons (i.e., edges being cut) to nodes.

The algorithm evaluates different directions. For each direction, we find the division that minimizes the number of edges cut (e.g., beacons) between the first and last 10% of the nodes

Having found a cut on the small graph, the algorithm performs a refinement step to project the cut back to the original graph of the road network.

Conclusion
This work shows how classical algorithms offer many useful tools for solving problems at large scale. Graph partitioning can be used to break down a large scale graph problem into smaller subproblems to be solved independently and in parallel—which is particularly relevant in Google maps, where this partitioning algorithm is used to efficiently compute routes.

Acknowledgements
We thank our collaborators Lisa Fawcett, Sreenivas Gollapudi, Kostas Kollias, Ravi Kumar, Andrew Tomkins, Ameya Velingker from Google Research and Pablo Beltran, Geoff Hulten, Steve Jackson, Du Nguyen from Google Maps.


1This technique can also be used for any network structure, such as that for brain neurons. 

Source: Google AI Blog


Find detailed information on vaccination availability near you

As the COVID-19 pandemic continues to be a priority within our communities, vaccines remain one of our biggest protections. Nationwide vaccination drives are in full swing, and as more people look to get vaccinated, their requirements for information continue to evolve: finding vaccine availability by location, specific information about vaccination services offered, and details on appointment availability are increasingly important to know.

In March 2021, we started showing COVID-19 vaccination centers on Google, in partnership with the Ministry of Health and Family Welfare. Starting this week, for over 13,000 locations across the country, people will be able to get more helpful information about vaccine availability and appointments -- powered by real-time data from the CoWIN APIs. This includes information such as:

  • Availability of appointment slots at each center

  • Vaccines and doses offered (Dose 1 or Dose 2)

  • Expectations for pricing (Paid or Free)

  • Link to the CoWIN website for booking

Across Google Search, Maps, and Google Assistant, now find more detailed information on vaccination availability, including vaccines and doses available, appointments and more

The above information will automatically show up when users search for vaccine centers near them, or in any specific area – across Google Search, Maps and Google Assistant. In addition to English, users can also search in eight Indian languages including Hindi, Bengali, Telugu, Tamil, Malayalam, Kannada, Gujarati, and Marathi. We will continue to partner closely with the CoWIN team to extend this functionality to all vaccination centers across India.

As people continue to seek information related to the pandemic to manage their lives around it, we remain committed to finding and sharing authoritative and timely information across our platforms.

Posted by Hema Budaraju, Director, Google Search


Top questions you ask Google about privacy across our products

“Hey Google, I have some questions…” 

Privacy and security is personal. It means different things to different people, but our commitment is the same to everyone who uses our products: we will keep your personal information private, safe, and secure. We think everyone should be in the know about what data is collected, how their information is used, and most importantly, how they control the data they share with us.

Here are some of the top questions that people commonly ask us:

Q. Is Google Assistant recording everything I say?

No, it isn’t.

Google Assistant is designed to wait in standby mode until it is activated, like when you say, "Hey Google" or "Ok Google". In standby mode, it processes short snippets of audio (a few seconds) to detect an activation (such as “Ok Google”). If no activation is detected, then those audio snippets won’t be sent or saved to Google. When an activation is detected, the Assistant comes out of standby mode to fulfill your request. The status indicator on your device lets you know when the Assistant is activated. And when it’s in standby mode, the Assistant won’t send what you are saying to Google or anyone else. To help keep you in control, we're constantly working to make the Assistant better at reducing unintended activations.

To better tailor Google Assistant to your environment, you can now adjust how sensitive your Assistant is to the activation phrase (like 'Hey Google') through the Google Home app for smart speakers and smart displays. We also provide controls to turn off cameras and mics, and when they’re active we’ll provide a clear visual indicator (like flashing dots on top of your device).

Deleting your Google Assistant activity is easy, by simply using your voice. Just say something like, “Hey Google, delete this week’s activity”, or “Hey Google, delete my last conversation”, and Google Assistant will delete your Assistant activity. This will reflect on your My Activity page, and you can also use this page to review and delete activity across the Google products you use. And if you have people coming over, you can also activate a “Guest Mode” on Google Assistant – Just say, “Hey Google, turn on Guest Mode,” and your Google Assistant interactions will not be saved to your account. 

Q. How does Google decide what ads it shows me? How can I control this?

The Ads you see can be based on a number of things, such as your previous searches, the sites you visit, ads clicked, and more.

For example, you may discover that you are seeing a camera ad because you’ve searched for cameras, visited photography websites or clicked on ads for cameras before. The 'Why this ad?' feature helps you understand why you are seeing a given ad. 

Data helps us personalise ads so that they're more useful to you, but we never use the content of your emails or documents, or sensitive information like health, race, religion or sexual orientation, to tailor ads to you.

It is also easy to personalize the kinds of ads that are shown to you, or even disable ads personalization completely. Visit your Ad Settings page.

Q. Are you building a profile of my personal information across your products, for targeting ads?

We do not sell your personal information — not to advertisers, not to anyone. And we don’t use information in apps where you primarily store personal content — such as Gmail, Drive, Calendar and Photos — for advertising purposes.

We use information to improve our products and services for you and for everyone. And we use anonymous, aggregated data to do so.

A small subset of information may be used to serve you relevant ads (for things you may actually want to hear about), but only with your consent. You can always turn these settings off.

It is also important to note that you can use most of Google’s products completely anonymously, without logging in -- you can Search in incognito mode, or clear your search history; you can watch YouTube videos and use Maps. However, when you share your data with us we can create a better experience with our products based on the information shared with us.

Q. Are you reading my emails to sell ads?

We do not scan or read your Gmail messages to show you ads. 

In fact, we have a host of products like Gmail, Drive and Photos that are  designed to store your personal content, and this content is never used to show ads. When you use your personal Google account and open the promotions or social tabs in Gmail, you'll see ads that were selected to be the most useful and relevant for you. The process of selecting and showing personalized ads in Gmail is fully automated. The ads you see in Gmail are based on data associated with your Google Account such as your activity in other Google services such as YouTube or Search, which could affect the types of ads that you see in Gmail. To remember which ads you've dismissed, avoid showing you the same ads, and show you ads you may like better, we save your past ad interactions, like which ads you've clicked or dismissed. Google does not use keywords or messages in your inbox to show you ads – nobody reads your email in order to show you ads.

Also, if you have a work or school account, you will never be shown ads in Gmail.

You can adjust your ad settings anytime. Learn more about Gmail ads.

Q. Why do you need location information on Maps?

If you want to get from A to B, it’s quicker to have your phone tell us where you are, than to have you figure out your address or location. Location information helps in many other ways too, like helping us figure out how busy traffic is. If you choose to enable location sharing, your phone will send anonymous bits of information back to Google. This is combined with anonymous data from people around you to recognise traffic patterns.

This only happens for people who turn location history on. It is off by default. If you turn it on, but then change your mind, you can visit Your Data in Maps -- a single place for people to manage Google account location settings.

Q. What information does Google know about me? How do I control it?

You can see a summary of what Google services you use and the data saved in your account from your Google Dashboard. There are also powerful privacy controls like Activity Controls and Ad Settings, which allow you to switch the collection and use of data on or off to decide how all of Google can work better for you.

We’ve made it easier for you to make decisions about your data directly within the Google services you use every day. For example, without ever leaving Search, you can review and delete your recent search activity, get quick access to relevant privacy controls from your Google Account, and learn more about how Search works with your data. You can quickly access these controls in Search, Maps, and the Assistant.

Privacy features and controls have always been built into our services, and we’re continuously working to make it even easier to control and manage your privacy and security. But we know that the web is a constantly evolving space, where new threats and bad actors will unfortunately emerge. There will always be more work to be done, and safeguarding people who use our products and services every day will remain our focus. 

For more on how we keep you and your information private, safe and secure visit the Google Safety Center.

Posted by the Google India Team


Google I/O 2021: Being helpful in moments that matter


It’s great to be back hosting our I/O Developers Conference this year. Pulling up to our Mountain View campus this morning, I felt a sense of normalcy for the first time in a long while. Of course, it’s not the same without our developer community here in person. COVID-19 has deeply affected our entire global community over the past year and continues to take a toll. Places such as Brazil, and my home country of India, are now going through their most difficult moments of the pandemic yet. Our thoughts are with everyone who has been affected by COVID and we are all hoping for better days ahead.

The last year has put a lot into perspective. At Google, it’s also given renewed purpose to our mission to organize the world's information and make it universally accessible and useful. We continue to approach that mission with a singular goal: building a more helpful Google, for everyone. That means being helpful to people in the moments that matter and giving everyone the tools to increase their knowledge, success, health, and happiness. 

Helping in moments that matter

Sometimes it’s about helping in big moments, like keeping 150 million students and educators learning virtually over the last year with Google Classroom. Other times it’s about helping in little moments that add up to big changes for everyone. For example, we’re introducing safer routing in Maps. This AI-powered capability in Maps can identify road, weather, and traffic conditions where you are likely to brake suddenly; our aim is to reduce up to 100 million events like this every year. 

Reimagining the future of work

One of the biggest ways we can help is by reimagining the future of work. Over the last year, we’ve seen work transform in unprecedented ways, as offices and coworkers have been replaced by kitchen countertops and pets. Many companies, including ours, will continue to offer flexibility even when it’s safe to be in the same office again. Collaboration tools have never been more critical, and today we announced a new smart canvas experience in Google Workspace that enables even richer collaboration. 

Smart Canvas integration with Google Meet

Responsible next-generation AI

We’ve made remarkable advances over the past 22 years, thanks to our progress in some of the most challenging areas of AI, including translation, images and voice. These advances have powered improvements across Google products, making it possible to talk to someone in another language using Assistant’s interpreter mode, view cherished memories on Photos, or use Google Lens to solve a tricky math problem. 

We’ve also used AI to improve the core Search experience for billions of people by taking a huge leap forward in a computer’s ability to process natural language. Yet, there are still moments when computers just don’t understand us. That’s because language is endlessly complex: We use it to tell stories, crack jokes, and share ideas — weaving in concepts we’ve learned over the course of our lives. The richness and flexibility of language make it one of humanity’s greatest tools and one of computer science’s greatest challenges. 

Today I am excited to share our latest research in natural language understanding: LaMDA. LaMDA is a language model for dialogue applications. It’s open domain, which means it is designed to converse on any topic. For example, LaMDA understands quite a bit about the planet Pluto. So if a student wanted to discover more about space, they could ask about Pluto and the model would give sensible responses, making learning even more fun and engaging. If that student then wanted to switch over to a different topic — say, how to make a good paper airplane — LaMDA could continue the conversation without any retraining.

This is one of the ways we believe LaMDA can make information and computing radically more accessible and easier to use (and you can learn more about that here). 

We have been researching and developing language models for many years. We’re focused on ensuring LaMDA meets our incredibly high standards on fairness, accuracy, safety, and privacy, and that it is developed consistently with our AI Principles. And we look forward to incorporating conversation features into products like Google Assistant, Search, and Workspace, as well as exploring how to give capabilities to developers and enterprise customers.

LaMDA is a huge step forward in natural conversation, but it’s still only trained on text. When people communicate with each other they do it across images, text, audio, and video. So we need to build multimodal models (MUM) to allow people to naturally ask questions across different types of information. With MUM you could one day plan a road trip by asking Google to “find a route with beautiful mountain views.” This is one example of how we’re making progress towards more natural and intuitive ways of interacting with Search.

Pushing the frontier of computing

Translation, image recognition, and voice recognition laid the foundation for complex models like LaMDA and multimodal models. Our compute infrastructure is how we drive and sustain these advances, and TPUs, our custom-built machine learning processes, are a big part of that. Today we announced our next generation of TPUs: the TPU v4. These are powered by the v4 chip, which is more than twice as fast as the previous generation. One pod can deliver more than one exaflop, equivalent to the computing power of 10 million laptops combined. This is the fastest system we’ve ever deployed, and a historic milestone for us. Previously to get to an exaflop, you needed to build a custom supercomputer. And we'll soon have dozens of TPUv4 pods in our data centers, many of which will be operating at or near 90% carbon-free energy. They’ll be available to our Cloud customers later this year.

(Left) TPU v4 chip tray; (Right) TPU v4 pods at our Oklahoma data center 

It’s tremendously exciting to see this pace of innovation. As we look further into the future, there are types of problems that classical computing will not be able to solve in reasonable time. Quantum computing can help. Achieving our quantum milestone was a tremendous accomplishment, but we’re still at the beginning of a multiyear journey. We continue to work to get to our next big milestone in quantum computing: building an error-corrected quantum computer, which could help us increase battery efficiency, create more sustainable energy, and improve drug discovery. To help us get there, we’ve opened a new state of the art Quantum AI campus with our first quantum data center and quantum processor chip fabrication facilities.

Inside our new Quantum AI campus.

Safer with Google

At Google we know that our products can only be as helpful as they are safe. And advances in computer science and AI are how we continue to make them better. We keep more users safe by blocking malware, phishing attempts, spam messages, and potential cyber attacks than anyone else in the world.

Our focus on data minimization pushes us to do more, with less data. Two years ago at I/O, I announced Auto-Delete, which encourages users to have their activity data automatically and continuously deleted. We’ve since made Auto-Delete the default for all new Google Accounts. Now, after 18 months we automatically delete your activity data, unless you tell us to do it sooner. It’s now active for over 2 billion accounts.

All of our products are guided by three important principles: With one of the world’s most advanced security infrastructures, our products are secure by default. We strictly uphold responsible data practices so every product we build is private by design. And we create easy to use privacy and security settings so you’re in control.

Long term research: Project Starline

We were all grateful to have video conferencing over the last year to stay in touch with family and friends, and keep schools and businesses going. But there is no substitute for being together in the room with someone. 

Several years ago we kicked off a project called Project Starline to use technology to explore what’s possible. Using high-resolution cameras and custom-built depth sensors, it captures your shape and appearance from multiple perspectives, and then fuses them together to create an extremely detailed, real-time 3D model. The resulting data is many gigabits per second, so to send an image this size over existing networks, we developed novel compression and streaming algorithms that reduce the data by a factor of more than 100. We also developed a breakthrough light-field display that shows you the realistic representation of someone sitting in front of you. As sophisticated as the technology is, it vanishes, so you can focus on what’s most important. 

We’ve spent thousands of hours testing it at our own offices, and the results are promising. There’s also excitement from our lead enterprise partners, and we’re working with partners in health care and media to get early feedback. In pushing the boundaries of remote collaboration, we've made technical advances that will improve our entire suite of communications products. We look forward to sharing more in the months ahead.

A person having a conversation with someone over Project Starline.

Solving complex sustainability challenges

Another area of research is our work to drive forward sustainability. Sustainability has been a core value for us for more than 20 years. We were the first major company to become carbon neutral in 2007. We were the first to match our operations with 100% renewable energy in 2017, and we’ve been doing it ever since. Last year we eliminated our entire carbon legacy. 

Our next ambition is our biggest yet: operating on carbon free energy by the year 2030. This represents a significant step change from current approaches and is a moonshot on the same scale as quantum computing. It presents equally hard problems to solve, from sourcing carbon-free energy in every place we operate to ensuring it can run every hour of every day. 

Building on the first carbon-intelligent computing platform that we rolled out last year, we’ll soon be the first company to implement carbon-intelligent load shifting across both time and place within our data center network. By this time next year we’ll be shifting more than a third of non-production compute to times and places with greater availability of carbon-free energy. And we are working to apply our Cloud AI with novel drilling techniques and fiber optic sensing to deliver geothermal power in more places, starting in our Nevada data centers next year.

Investments like these are needed to get to 24/7 carbon-free energy, and it’s happening in Mountain View, California, too. We’re building our new campus to the highest sustainability standards. When completed, these buildings will feature a first- of- its- kind, dragonscale solar skin, equipped with 90,000 silver solar panels and the capacity to generate nearly 7 megawatts. They will house the largest geothermal pile system in North America to help heat buildings in the winter and cool them in the summer. It’s been amazing to see it come to life.

(Left) Rendering of the new Charleston East campus in Mountain View, California; (Right) Model view with dragon scale solar skin.

A celebration of technology

I/O isn’t just a celebration of technology but of the people who use it, and build it — including the millions of developers around the world who joined us virtually today. Over the past year we’ve seen people use technology in profound ways: to keep themselves healthy and safe, to learn and grow, to connect, and to help one another through really difficult times. It’s been inspiring to see and has made us more committed than ever to being helpful in the moments that matter. 

I look forward to seeing everyone at next year’s I/O — in person, I hope. Until then, be safe and well.

Posted by Sundar Pichai, CEO of Google and Alphabet

Search, explore and shop the world’s information, powered by AI

AI advancements push the boundaries of what Google products can do. Nowhere is this clearer than at the core of our mission to make information more accessible and useful for everyone.


We've spent more than two decades developing not just a better understanding of information on the web, but a better understanding of the world. Because when we understand information, we can make it more helpful  — whether you’re a remote student learning a complex new subject, a caregiver looking for trusted information on COVID vaccines or a parent searching for the best route home.


Deeper understanding with MUM

One of the hardest problems for search engines today is helping you with complex tasks — like planning what to do on a family outing. These often require multiple searches to get the information you need. In fact, we find that it takes people eight searches on average to complete complex tasks.


With a new technology called Multitask Unified Model, or MUM, we're able to better understand much more complex questions and needs, so in the future, it will require fewer searches to get things done. Like BERT, MUM is built on a Transformer architecture, but it’s 1,000 times more powerful and can multitask in order to unlock information in new ways. MUM not only understands language, but also generates it. It’s trained across 75 different languages and many different tasks at once, allowing it to develop a more comprehensive understanding of information and world knowledge than previous models. And MUM is multimodal, so it understands information across text and images and in the future, can expand to more modalities like video and audio.


Imagine a question like: “I’ve hiked Mt. Adams and now want to hike Mt. Fuji next fall, what should I do differently to prepare?” This would stump search engines today, but in the future, MUM could understand this complex task and generate a response, pointing to highly relevant results to dive deeper. We’ve already started internal pilots with MUM and are excited about its potential for improving Google products.


Information comes to life with Lens and AR

People come to Google to learn new things, and visuals can make all the difference. Google Lens lets you search what you see — from your camera, your photos or even your search bar. Today we’re seeing more than 3 billion searches with Lens every month, and an increasingly popular use case is learning. For example, many students might have schoolwork in a language they aren't very familiar with. That’s why we’re updating the Translate filter in Lens so it’s easy to copy, listen to or search translated text, helping students access education content from the web in over 100 languages.


Google Lens’s Translate filter applied to homework.

AR is also a powerful tool for visual learning. With the new AR athletes in Search, you can see signature moves from some of your favorite athletes in AR — like Simone Biles’s famous balance beam routine.

Simone Biles’s balance beam routine surfaced by the AR athletes in Search feature.

Evaluate information with About This Result 

Helpful information should be credible and reliable, and especially during moments like the pandemic or elections, people turn to Google for trustworthy information. 


Our ranking systems are designed to prioritize high-quality information, but we also help you evaluate the credibility of sources, right in Google Search. Our About This Result feature provides details about a website before you visit it, including its description, when it was first indexed and whether your connection to the site is secure. 


This month, we’ll start rolling out About This Result to all English results worldwide, with more languages to come. Later this year, we’ll add even more detail, like how a site describes itself, what other sources are saying about it and related articles to check out. 


Exploring the real world with Maps

Google Maps transformed how people navigate, explore and get things done in the world — and we continue to push the boundaries of what a map can be with industry-first features like AR navigation in Live View at scale. We recently announced we’re on track to launch over 100 AI-powered improvements to Google Maps by the end of year, and today, we’re introducing a few of the newest ones. Our new routing updates are designed to reduce the likelihood of hard-braking on your drive using machine learning and historical navigation information — which we believe could eliminate over 100 million hard-braking events in routes driven with Google Maps each year.


If you’re looking for things to do, our more tailored map will spotlight relevant places based on time of day and whether or not you’re traveling. Enhancements to Live View and detailed street maps will help you explore and get a deep understanding of an area as quickly as possible. And if you want to see how busy neighborhoods and parts of town are, you’ll be able to do this at a glance as soon as you open Maps.


More ways to shop with Google 

People are shopping across Google more than a billion times per day, and our AI-enhanced Shopping Graph — our deep understanding of products, sellers, brands, reviews, product information and inventory data — powers many features that help you find exactly what you’re looking for.


Because shopping isn’t always a linear experience, we’re introducing new ways to explore and keep track of products. Now, when you take a screenshot, Google Photos will prompt you to search the photo with Lens, so you can immediately shop for that item if you want. And on Chrome, we’ll help you keep track of shopping carts you’ve begun to fill, so you can easily resume your virtual shopping trip. We're also working with retailers to surface loyalty benefits for customers earlier, to help inform their decisions.


Last year we made it free for merchants to sell their products on Google. Now, we’re introducing a new, simplified process that helps Shopify’s 1.7 million merchants make their products discoverable across Google in just a few clicks.  


Whether we’re understanding the world’s information, or helping you understand it too, we’re dedicated to making our products more useful every day. And with the power of AI, no matter how complex your task, we’ll be able to bring you the highest quality, most relevant results.  


Posted by Prabhakar Raghavan, Senior Vice President