Three years ago, we introduced Google Analytics 4, a re-imagined tool that helps you get a complete view of consumer behavior across web and app by using first-party, modeled data. This is critical in an evolving privacy and technology landscape, where marketers have to rethink their approach to measurement in order to keep getting the insights they rely on. Today we’re introducing new resources to help you make the switch to Google Analytics 4, improved machine learning features, actionable reporting and new integrations.
Make the switch now to Google Analytics 4 with helpful solutions
Earlier this year we shared that we will begin sunsetting standard Universal Analytics properties on July 1, 2023. We recognize that setting up Google Analytics 4 to fit your needs takes time and resources, in particular for large enterprises with complex Analytics 360 setups. To allow enterprise customers more time to have a smoother transition to Google Analytics 4, we’re moving the Universal Analytics 360 properties’ sunset date from October 1, 2023 to July 1, 2024. We're focusing our efforts and investments on Google Analytics 4 to deliver a solution built to adapt to a changing ecosystem. Because of this, throughout 2023 we'll be shifting support away from Universal Analytics 360 and will move our full focus to Google Analytics 4 in 2024. As a result, performance will likely degrade in Universal Analytics 360 up until the new sunset date.
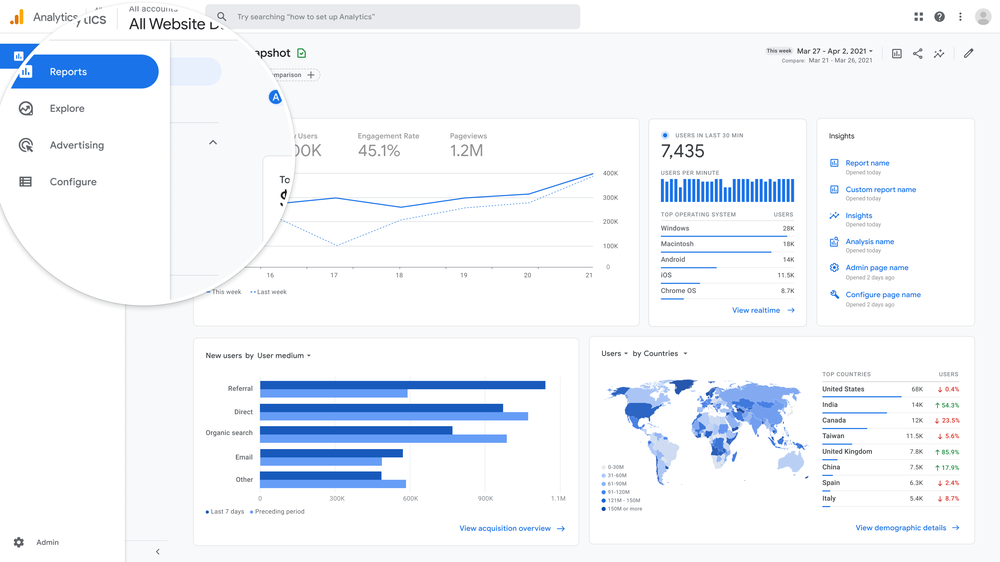
To help everyone make the move, we're launching new resources and tools to help you get started with Google Analytics 4. Our step by step guide helps you complete the entire setup of Google Analytics 4 at your pace and customize it to your needs. Or, if you prefer a more automated experience, you can use the Setup Assistant in the admin section of your Universal Analytics property. Once a Google Analytics 4 property is created and connected, the Setup Assistant can automate some required setup steps and help you track your progress. For example, the Setup Assistant lets you select the goals you want to import to Google Analytics 4, copy desired Google Ads links and audiences, and add users who have access to your current property.
 Upgrade your Analytics 360 properties to Google Analytics 4 by March 2024 to preserve measurement and campaign performance.
 The Google Analytics 4 deadline is July 1, make your move before it’s too late and get AI-powered insights to improve your ROI.
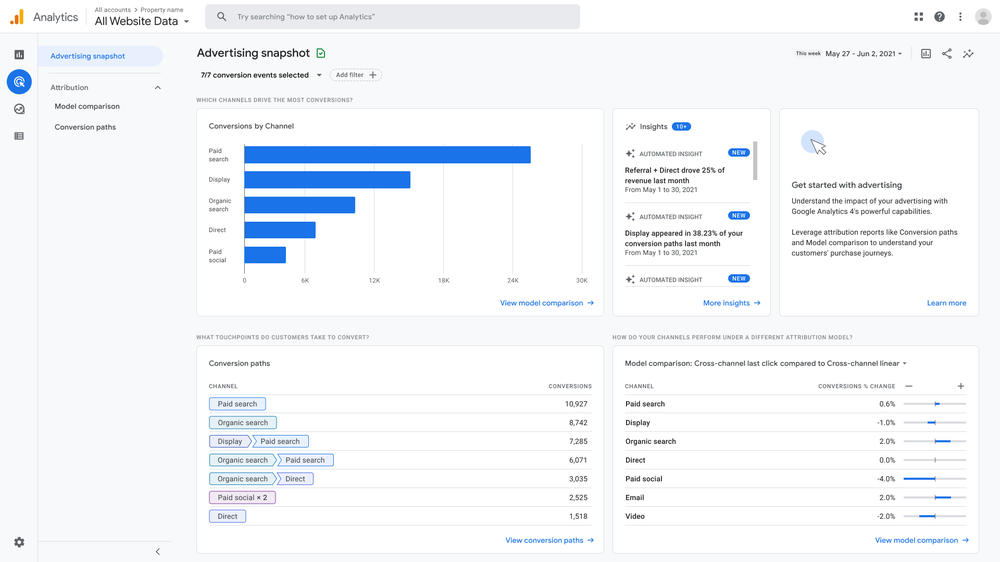
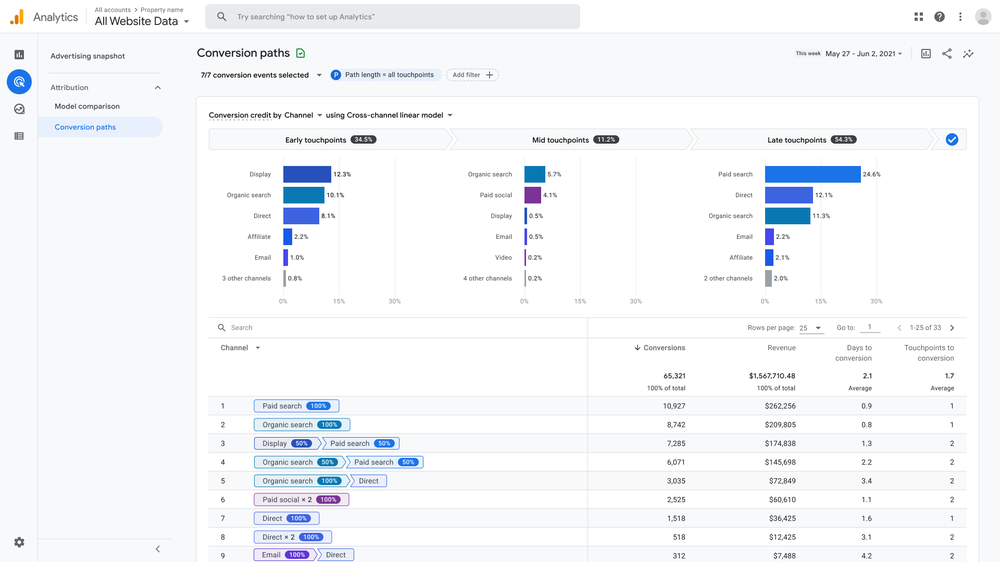
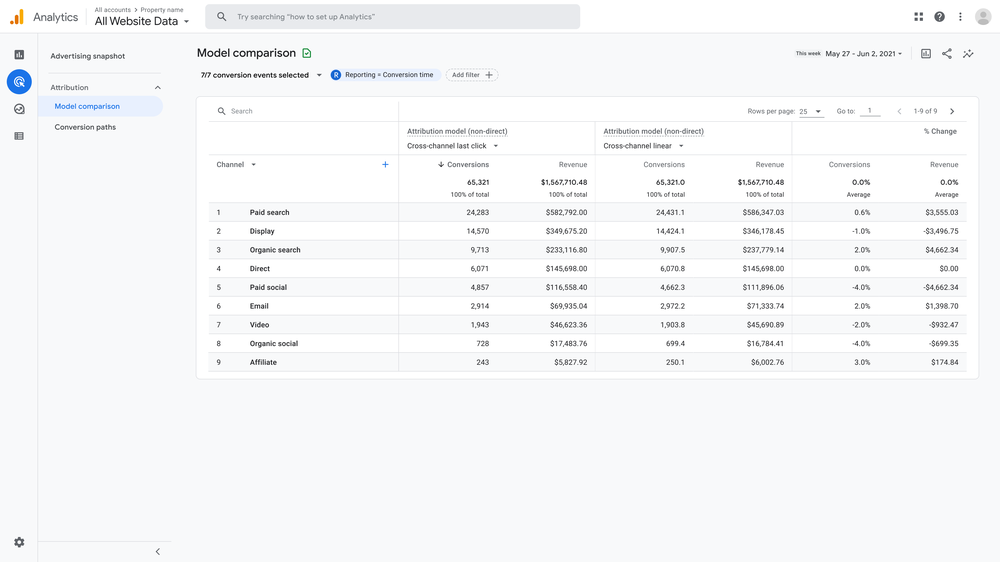
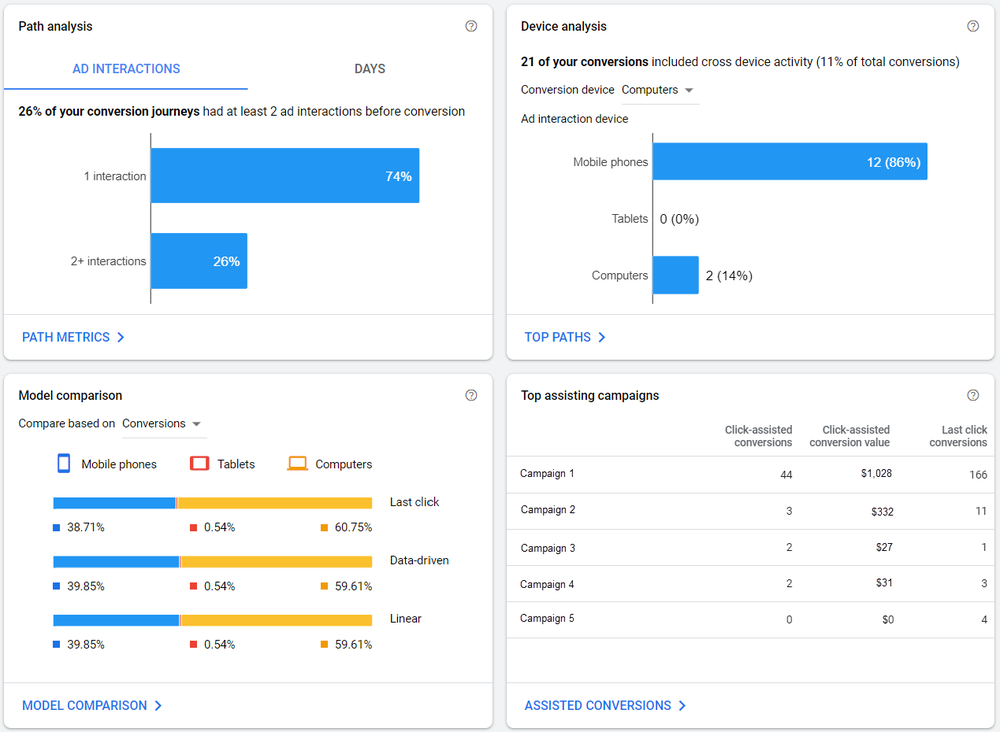
 Showcasing how Mercedes-Benz Germany increased performance with data-driven attribution, and introducing new ways to see success with this model.