Google Maps holiday trends worth mulling over

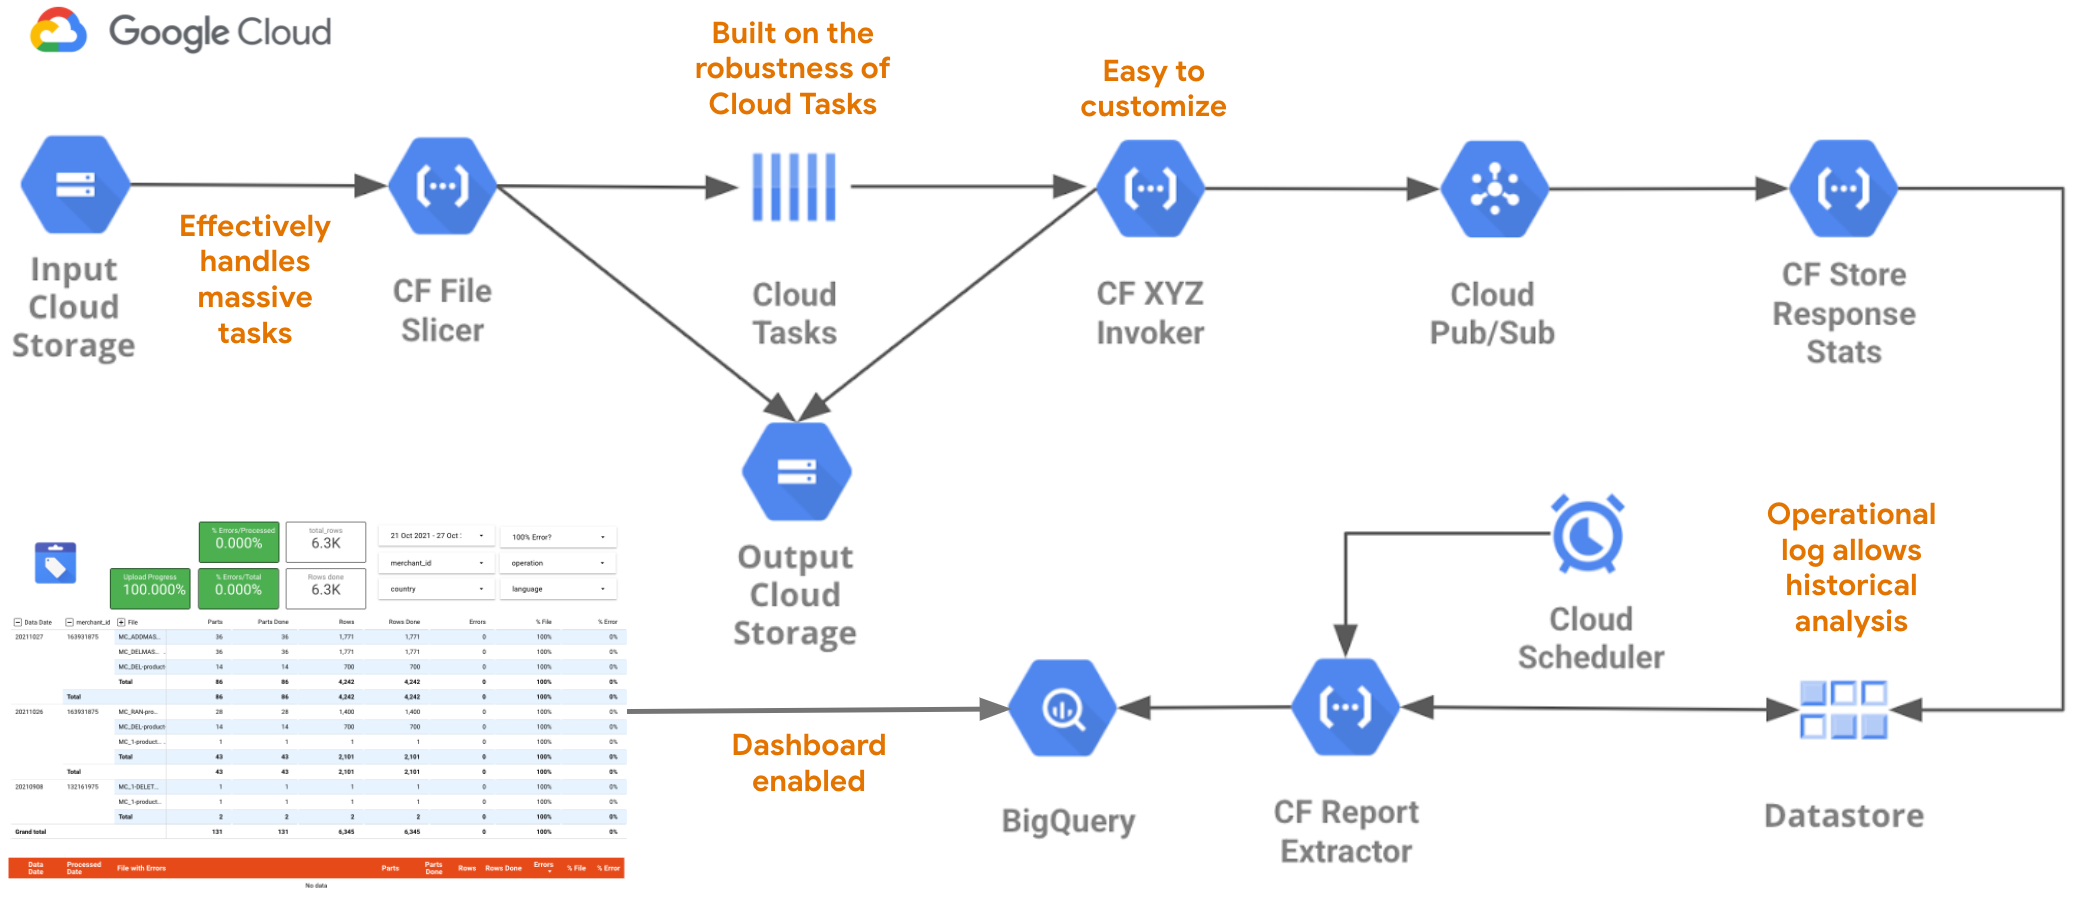
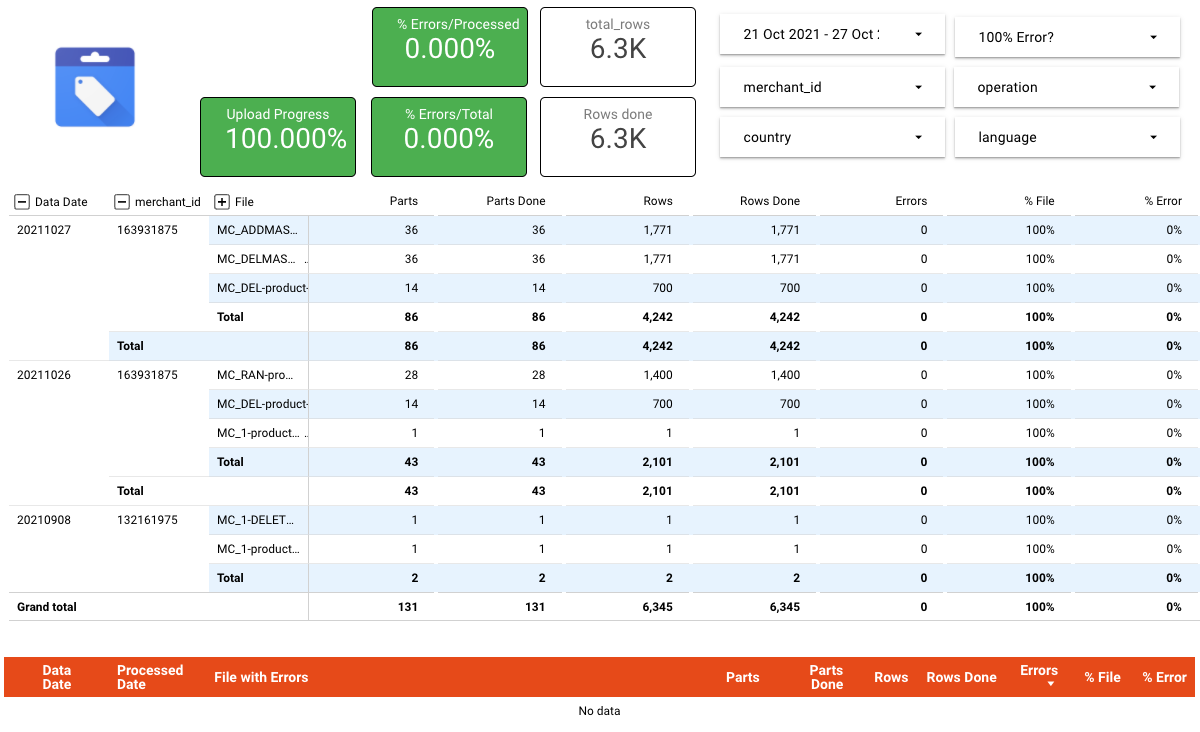
This holiday season, many of us are feeling more comfortable traveling to see loved ones, shopping in person and scoping out the things to do and places to visit.

As we continue to navigate this new normal, we took a look at Google Maps trends in the U.S. — from the most popular times to visit certain places to what foods Americans are ordering most — to help you make your list, check it twice and get through the holiday season safely, efficiently and joyfully.

No thyme for lines and crowds? No worries

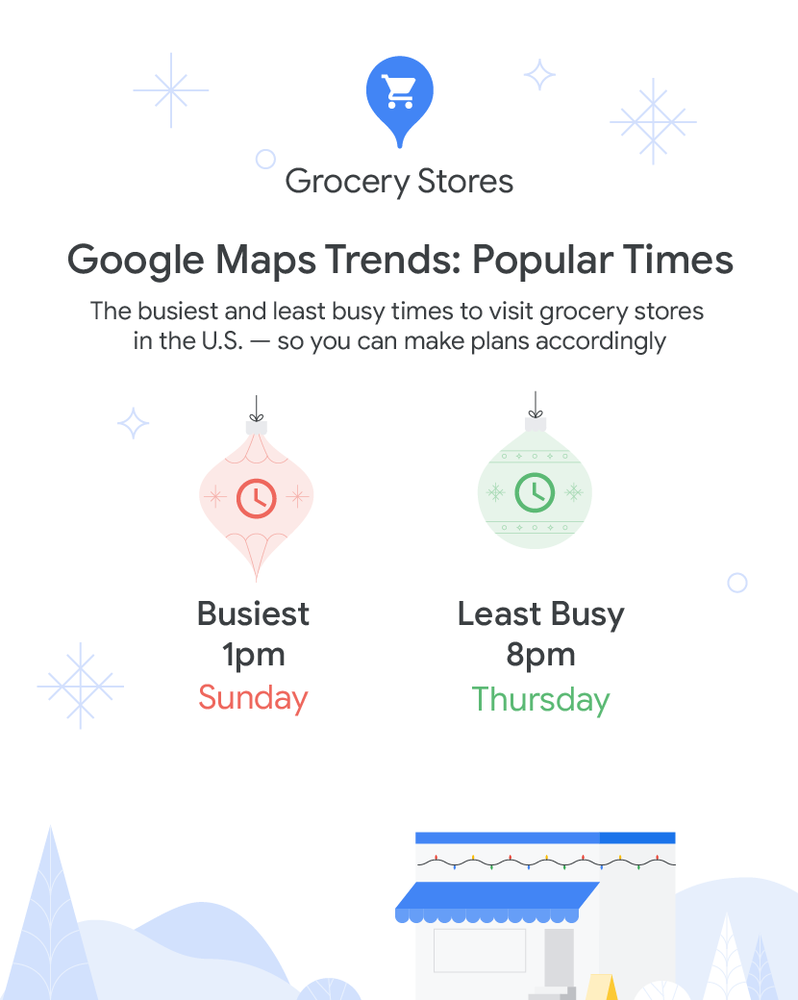
Whether you’re shopping for the perfect Thanksgiving turkey or refilling your hand sanitizer supply, no one likes waiting in line. According to Google Maps data, these are the best and worst times to visit the grocery store, based on the live busyness information in Google Maps:

A chart showing the busiest time to visit grocery stores in the US is typically Sunday at 1pm and the least busy is Thursday at 8pm.

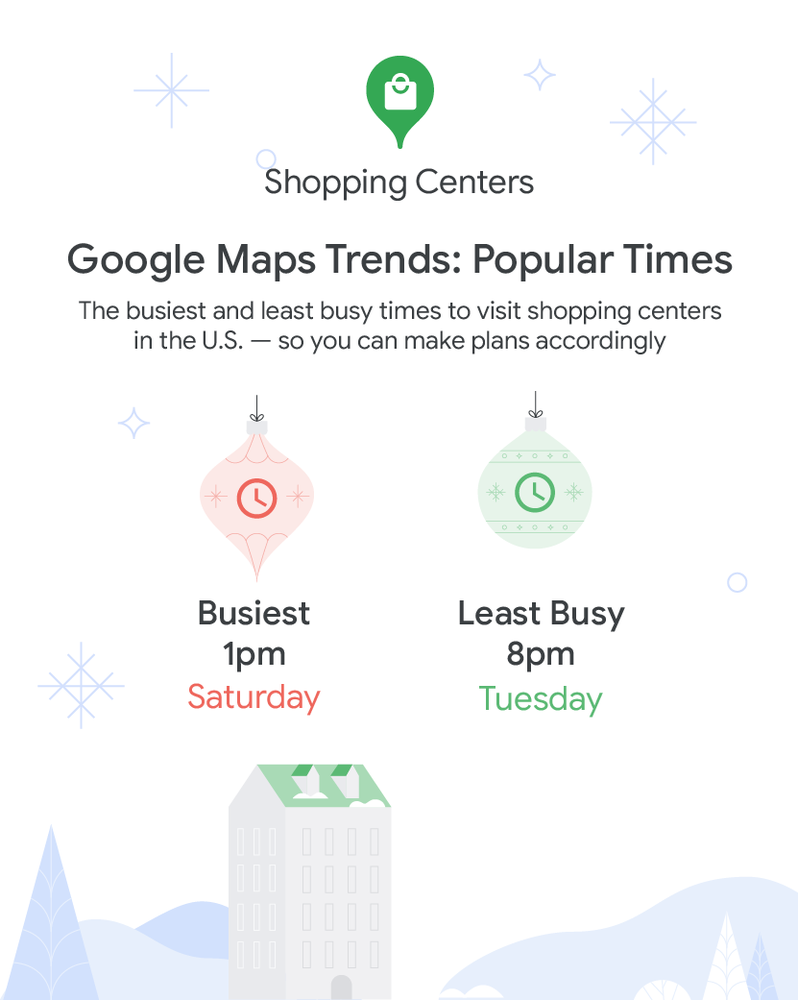
Last year we saw popular gift stores like Kay Jewelers, Bath & Body Works and Barnes & Noble trend in December, with Maps searches for these places increasing 100% from the month before. With expected shipping delays, it’s important to get ahead of your holiday shopping. Here are the best and worst times to fill your sleigh at shopping centers and department stores, according to Google Maps data:

A chart showing the busiest time to visit shopping centers in the US is typically Saturday at 1pm and the least busy is Tuesday at 8pm.

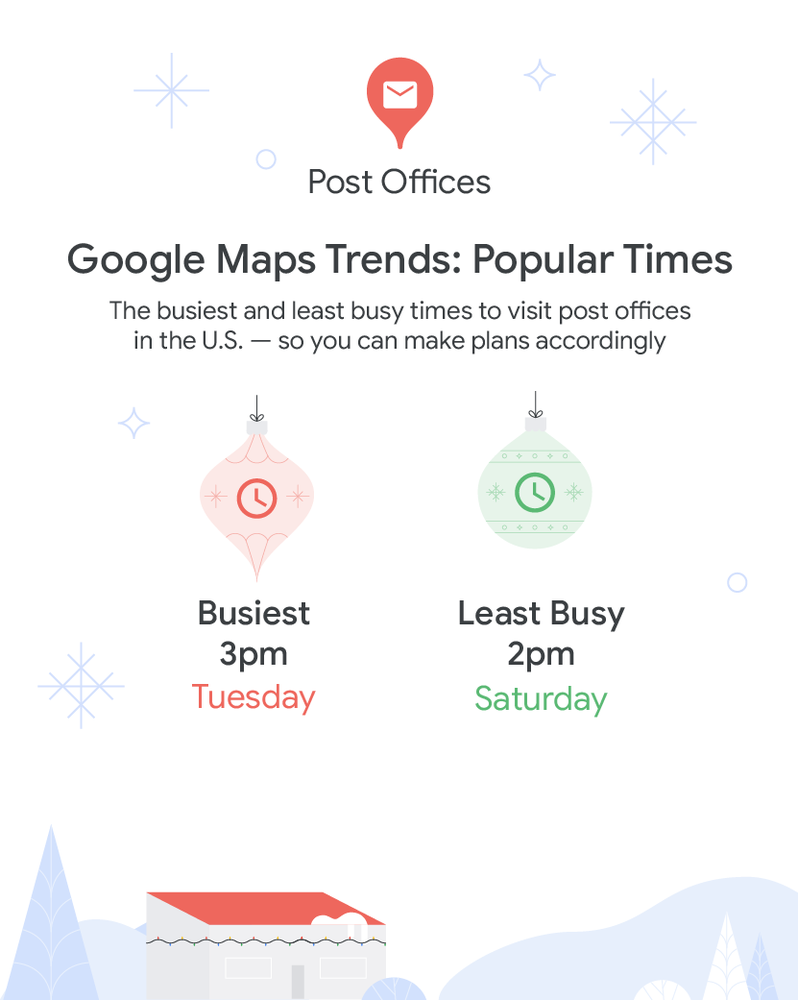
Once you’ve gathered all your gifts and written your cards, it’s time to head to the post office to spread holiday cheer. With fewer people traveling to meet up with loved ones, Maps searches for post offices were up nearly 150% month over month last December. Check out the best and worst times to visit the post office so you can get those holiday cards out without the hassle.

A chart showing the busiest time to visit post offices in the US is typically Tuesday at 3pm and the least busy is Saturday at 2pm.

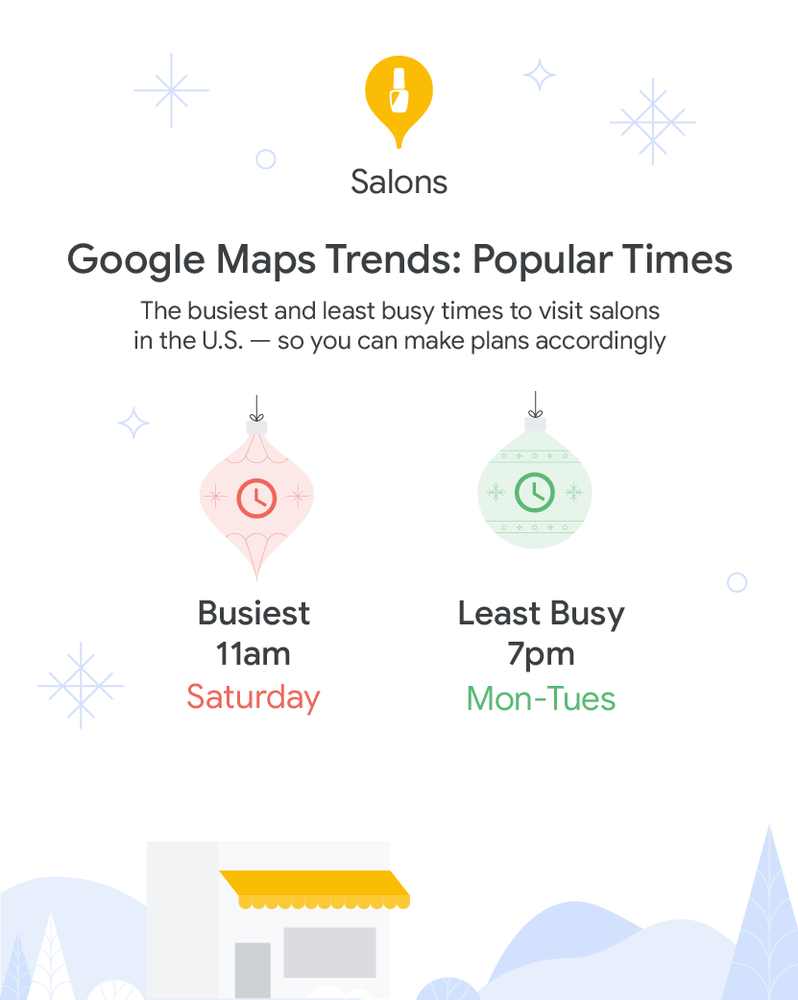
After all that holiday hustle and bustle, it's time to treat yo’elf! According to Google Maps searches, people look for nail salons more than three times as much as they search for gyms in December. If you’re looking to get pampered at the salon, consider making your appointment at a less busy time:

A chart showing the busiest time to visit salons in the US is typically Saturday at 11am and the least busy is Monday and Tuesday at 7pm.

But wait, there’s myrrh. Once you know where you’re going, the next step is figuring out how you’ll get there — whether it's a plane, train or Polar Express.

According to Google Maps, it looks like Americans are getting back to familiar methods of transportation, with national interest in public transit up 40% compared to last year. This jump is higher in metros known for their public transportation: San Francisco leads the way with transit interest up nearly 95% compared to last year, followed by Washington D.C. (up nearly 75% since last year) and Chicago (up nearly 65% over the same period of time).

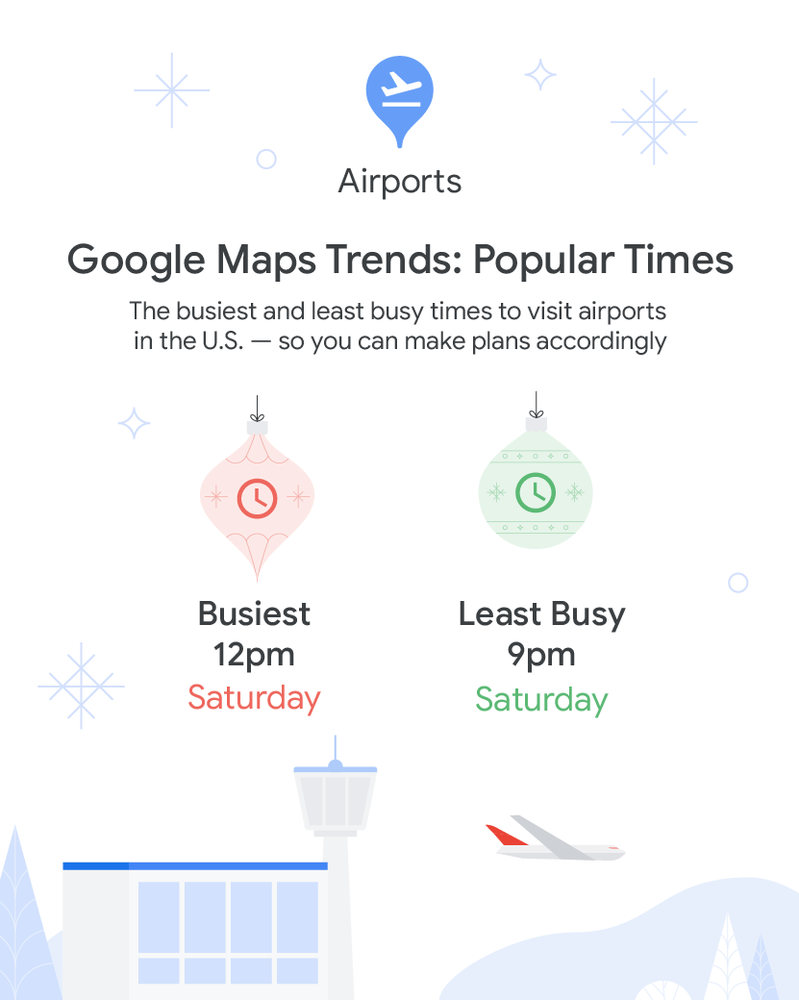
Should you choose to travel through the skies (red nose not included), book your travel around these least busy times:

A chart showing the busiest time to visit airports in the US is typically Saturday at 12 pm and the least busy is Saturday at 9 pm.

Eat, drink and be merry

While some people spend the holidays cooking up a storm, some of us like our meals like we like our presents: delivered. In fact, on Christmas Day, Americans search for food delivery options on Google Maps more than twice as much as on a typical Saturday.

Here’s a look at what food Americans search for and order on Google Maps during the holiday season:

  • ? Chinese is the most popular cuisine Americans order on Google on Christmas Day, with orders increasing 25% compared to a typical Saturday.
  • ? New York and Los Angeles put their coastal rivalries aside for the holidays — at least when it comes to food ordering. Both cities prefer Chinese on Christmas Day, and stick to pizza on Thanksgiving, Christmas Eve, New Year’s Eve and New Year’s Day.
  • ? Seasons meatings? Portlanders turn to Maps to search for burgers most on Thanksgiving, Christmas Eve and New Years Eve. Burgers are also the top-searched food on Google Maps in Minneapolis on New Year’s Eve and New Year’s Day.
  • ? Skip the turkey, and pass the noodles! Seattleites search for Thai food on Google Maps more than any other cuisine on Thanksgiving Day.

Holiday Activi-trees

During the holidays, Rockefeller Center is a top trending destination in the U.S., with Maps searches spiking more than 300% last December. Not exactly pine-ing to see the big tree? No problem. Here are 10 of the most popular attractions in the U.S., according to this year’s Google Maps searches:

Whether you have family in town, have extra time off or are looking for inspiration for things to do while on vacation, we hope these trends get you in the holiday spirit. For hacks on how to survive the holiday season, check out these tips and tricks to make Google Maps your ultimate holiday side dish, er, we mean sidekick (but if it were a side dish it’d totally be stuffing).

Our commitment to Australia’s digital future

Today, speaking virtually at an event in Sydney, Google CEO Sundar Pichai announced the Digital Future Initiative: a $1 billion, five-year commitment to Australia, including initiatives to strengthen digital infrastructure, develop Australian technology and talent, and solve global and local challenges. Below is an edited transcript of his remarks.

Google’s growing presence across Australia reflects our deep confidence in the future — and the profound opportunities ahead.

Growing up in Chennai, I remember listening to the cricket test series between Australia and India on the radio, and was glad to see the rivalry continue in that amazing series last summer.

Over time, I would come to realize the important role Australia has played in some of the world’s most significant technologies, including Wi-Fi.

Australia has helped shape Google itself, from early work on Google Maps to progress on Chromebooks, Photos, Payments and Fitbit today. During the bushfires and pandemic, our priority has been making sure Australians can turn to Google for information to stay safe, work and learn from home, and keep their businesses running.

When bushfires brought tourism to a halt in 2020, Melissa Stone, owner of Bliss Gifts and Homewares in New South Wales, attended a Grow with Google virtual training. There she learned the digital skills which helped her set up her Google Business Profile, advertise online, and improve her SEO.

With these skills, she was able to grow her online presence and reach new customers. As a result, her revenues grew fifty percent after the bushfires, and today ninety percent of her sales come from digital channels.

At the same time, Australian startups are providing important digital services, like Sonder, which offers mental health and safety support to workers around the clock.

And Australian researchers are pushing technology in new directions. The Westmead Applied Research Centre, for example, is exploring how AI can help prevent heart disease — with support from Google.org.

Looking ahead, we want to help Australia shape the next wave of innovations, and bring the benefits of technology to more people. To help, today I’m proud to announce our biggest investment in Australia yet: a five-year, A$1 billion commitment to launch the Digital Future Initiative.

This investment will focus on three areas.

  • First, it will help develop Australia’s digital infrastructure, focused on cloud computing. Cloud is helping Australian companies innovate and grow in every part of the economy.
  • Second, it will broaden the opportunity we provide for local tech talent — including the launch of our first research hub in Australia. At Google Research Australia, we will build a team of local researchers and engineers to help tackle important issues, creating jobs and providing education and training.
  • Third, we will create new technology partnerships to help solve Australian and global challenges. That includes working with the CSIRO team to explore clean energy and protecting the Great Barrier Reef, and with Macquarie University to advance quantum computing.

Partnerships like these will be at the heart of the Digital Future Initiative.

We believe a strong digital future is one where everyone has access to technology and the skills to use it, where the internet economy fulfills its immense potential, and Australia’s long tradition of innovation can grow and thrive.

We look forward to working together as Australia builds that future, and we can’t wait to be part of it.

MetNet-2: Deep Learning for 12-Hour Precipitation Forecasting

Deep learning has successfully been applied to a wide range of important challenges, such as cancer prevention and increasing accessibility. The application of deep learning models to weather forecasts can be relevant to people on a day-to-day basis, from helping people plan their day to managing food production, transportation systems, or the energy grid. Weather forecasts typically rely on traditional physics-based techniques powered by the world’s largest supercomputers. Such methods are constrained by high computational requirements and are sensitive to approximations of the physical laws on which they are based.

Deep learning offers a new approach to computing forecasts. Rather than incorporating explicit physical laws, deep learning models learn to predict weather patterns directly from observed data and are able to compute predictions faster than physics-based techniques. These approaches also have the potential to increase the frequency, scope, and accuracy of the predicted forecasts.

Illustration of the computation through MetNet-2. As the computation progresses, the network processes an ever larger context from the input and makes a probabilistic forecast of the likely future weather conditions.

Within weather forecasting, deep learning techniques have shown particular promise for nowcasting — i.e., predicting weather up to 2-6 hours ahead. Previous work has focused on using direct neural network models for weather data, extending neural forecasts from 0 to 8 hours with the MetNet architecture, generating continuations of radar data for up to 90 minutes ahead, and interpreting the weather information learned by these neural networks. Still, there is an opportunity for deep learning to extend improvements to longer-range forecasts.

To that end, in “Skillful Twelve Hour Precipitation Forecasts Using Large Context Neural Networks”, we push the forecasting boundaries of our neural precipitation model to 12 hour predictions while keeping a spatial resolution of 1 km and a time resolution of 2 minutes. By quadrupling the input context, adopting a richer weather input state, and extending the architecture to capture longer-range spatial dependencies, MetNet-2 substantially improves on the performance of its predecessor, MetNet. Compared to physics-based models, MetNet-2 outperforms the state-of-the-art HREF ensemble model for weather forecasts up to 12 hours ahead.

MetNet-2 Features and Architecture
Neural weather models like MetNet-2 map observations of the Earth to the probability of weather events, such as the likelihood of rain over a city in the afternoon, of wind gusts reaching 20 knots, or of a sunny day ahead. End-to-end deep learning has the potential to both streamline and increase quality by directly connecting a system's inputs and outputs. With this in mind, MetNet-2 aims to minimize both the complexity and the total number of steps involved in creating a forecast.

The inputs to MetNet-2 include the radar and satellite images also used in MetNet. To capture a more comprehensive snapshot of the atmosphere with information such as temperature, humidity, and wind direction — critical for longer forecasts of up to 12 hours — MetNet-2 also uses the pre-processed starting state used in physical models as a proxy for this additional weather information. The radar-based measures of precipitation (MRMS) serve as the ground truth (i.e., what we are trying to predict) that we use in training to optimize MetNet-2’s parameters.

Example ground truth image: Instantaneous precipitation (mm/hr) based on radar (MRMS) capturing a 12 hours-long progression.

MetNet-2’s probabilistic forecasts can be viewed as averaging all possible future weather conditions weighted by how likely they are. Due to its probabilistic nature, MetNet-2 can be likened to physics-based ensemble models, which average some number of future weather conditions predicted by a variety of physics-based models. One notable difference between these two approaches is the duration of the core part of the computation: ensemble models take ~1 hour, whereas MetNet-2 takes ~1 second.

Steps in a MetNet-2 forecast and in a physics-based ensemble.

One of the main challenges that MetNet-2 must overcome to make 12 hour long forecasts is capturing a sufficient amount of spatial context in the input images. For each additional forecast hour we include 64 km of context in every direction at the input. This results in an input context of size 20482 km2 — four times that used in MetNet. In order to process such a large context, MetNet-2 employs model parallelism whereby the model is distributed across 128 cores of a Cloud TPU v3-128. Due to the size of the input context, MetNet-2 replaces the attentional layers of MetNet with computationally more efficient convolutional layers. But standard convolutional layers have local receptive fields that may fail to capture large spatial contexts, so MetNet-2 uses dilated receptive fields, whose size doubles layer after layer, in order to connect points in the input that are far apart one from the other.

Example of input spatial context and target area for MetNet-2.

Results
Because MetNet-2’s predictions are probabilistic, the model’s output is naturally compared with the output of similarly probabilistic ensemble or post-processing models. HREF is one such state-of-the-art ensemble model for precipitation in the United States, which aggregates ten predictions from five different models, twice a day. We evaluate the forecasts using established metrics, such as the Continuous Ranked Probability Score, which captures the magnitude of the probabilistic error of a model’s forecasts relative to the ground truth observations. Despite not performing any physics-based calculations, MetNet-2 is able to outperform HREF up to 12 hours into the future for both low and high levels of precipitation.

Continuous Ranked Probability Score (CRPS; lower is better) for MetNet-2 vs HREF aggregated over a large number of test patches randomly located in the Continental United States.

Examples of Forecasts
The following figures provide a selection of forecasts from MetNet-2 compared with the physics-based ensemble HREF and the ground truth MRMS.

Probability maps for the cumulative precipitation rate of 1 mm/hr on January 3, 2019 over the Pacific NorthWest. The maps are shown for each hour of lead time from 1 to 12. Left: Ground truth, source MRMS. Center: Probability map as predicted by MetNet-2 . Right: Probability map as predicted by HREF.
Comparison of 0.2 mm/hr precipitation on March 30, 2020 over Denver, Colorado. Left: Ground truth, source MRMS. Center: Probability map as predicted by MetNet-2 . Right: Probability map as predicted by HREF.MetNet-2 is able to predict the onset of the storm (called convective initiation) earlier in the forecast than HREF as well as the storm’s starting location, whereas HREF misses the initiation location, but captures its growth phase well.
Comparison of 2 mm/hr precipitation stemming from Hurricane Isaias, an extreme weather event that occurred on August 4, 2020 over the North East coast of the US. Left: Ground truth, source MRMS. Center: Probability map as predicted by MetNet-2. Right: Probability map as predicted by HREF.

Interpreting What MetNet-2 Learns About Weather
Because MetNet-2 does not use hand-crafted physical equations, its performance inspires a natural question: What kind of physical relations about the weather does it learn from the data during training? Using advanced interpretability tools, we further trace the impact of various input features on MetNet-2’s performance at different forecast timelines. Perhaps the most surprising finding is that MetNet-2 appears to emulate the physics described by Quasi-Geostrophic Theory, which is used as an effective approximation of large-scale weather phenomena. MetNet-2 was able to pick up on changes in the atmospheric forces, at the scale of a typical high- or low-pressure system (i.e., the synoptic scale), that bring about favorable conditions for precipitation, a key tenet of the theory.

Conclusion
MetNet-2 represents a step toward enabling a new modeling paradigm for weather forecasting that does not rely on hand-coding the physics of weather phenomena, but rather embraces end-to-end learning from observations to weather targets and parallel forecasting on low-precision hardware. Yet many challenges remain on the path to fully achieving this goal, including incorporating more raw data about the atmosphere directly (rather than using the pre-processed starting state from physical models), broadening the set of weather phenomena, increasing the lead time horizon to days and weeks, and widening the geographic coverage beyond the United States.

Acknowledgements
Shreya Agrawal, Casper Sønderby, Manoj Kumar, Jonathan Heek, Carla Bromberg, Cenk Gazen, Jason Hickey, Aaron Bell, Marcin Andrychowicz, Amy McGovern, Rob Carver, Stephan Hoyer, Zack Ontiveros, Lak Lakshmanan, David McPeek, Ian Gonzalez, Claudio Martella, Samier Merchant, Fred Zyda, Daniel Furrer and Tom Small.


Source: Google AI Blog


Stay up to date with new Product updates and Alerts cards in the Admin console

What’s changing

We’re adding two new cards to the Admin console homepage:
  • Product updates: showing the latest posts from the Google Workspace Updates blog
  • Alerts: showing recent account-specific alerts from the alert center

These new cards help organizations stay up to date with the latest Google Workspace product updates and improvements along with easy access to new administration and security notifications— bringing together critical information for a more dynamic and insightful landing page experience.
Admin home page with new updated cards
Admin console home page, now with Product updates and Alerts cards


Who’s impacted

Admins

Why you’d use it

Previously, updates on new Google Workspace feature releases and updates were only accessible by visiting or subscribing to the Google Workspace Updates blog, but now you can directly access recent posts from the Admin console.

Before this change, to see the latest alert center notifications, you would have needed to navigate to the alert center to check for new notifications. Now these notifications will be visible directly from the homepage as well.

We hope these cards make the Admin console an even more centralized location for all the information you need to best manage your organization.

Additional details

Google Workspace Updates Card
This card will display the latest blog posts from the Google Workspace Updates blog.
  • Clicking on an announcement will open that blog post for more information
  • Clicking on ‘View all’ will open the Google Workspace Updates blog.

Please note that this card is currently only available in English.

Product updates card
New Product updates card


Alerts card
This card will automatically update with the latest alerts from the Admin console alert center.
  • Clicking on an individual alert will open the details of the alert
  • Clicking on ‘View alert center’ opens the alert center for a more robust view of open alerts

Note that the card will only display open alerts with “Not started” or “In progress” status. “Closed” alerts will not be displayed, but can be accessed in the alert center by using the status filter for closed.

Visit our Help Center to learn how to create custom alerts.

New Alerts card
New Alerts card


Getting started

  • Admins: The Product update card is available for all admins and can be expanded or collapsed. The Alerts card is only available for admins with alert center privilege with the same expand or collapse options. Visit the Help Center to learn more about alert center privileges.
  • End users: There is no end user impact for this feature.

Rollout pace

  • Rapid Release and Scheduled Release domains: Gradual rollout (up to 15 days for feature visibility) starting on November 15, 2021

Availability

  • Available to all Google Workspace customers, as well as G Suite Basic and Business customers

Resources

Indicate whether you’ll join a meeting virtually or in person, now on Gmail

Quick launch summary

In July of this year, we introduced new RSVP options for Calendar invitations to make Google Calendar more flexible in the hybrid workplace. We’re now adding this same functionality to RSVPs in Gmail.

Dropdown menu showing new RSVP methods in Gmail
New RSVP options in Gmail


With these RSVP options, you can indicate how you plan to join a meeting—in the meeting room, or virtually. Then, both the organizer and guests will be able to see how attendees are planning to attend the meeting in the event detail. This will help meeting attendees know what to expect when joining a meeting, and prepare accordingly.

Note that if you select the new RSVP options, the join method details (e.g. “joining virtually”) are not shared with contacts on other platforms, such as Microsoft Outlook.

Getting started


Rollout pace


Availability

  • Available to all Google Workspace customers, as well as G Suite Basic and Business customers

Resources

This Code Next student is paying it forward

As part of Google’s Code Next program, which brings computer science (CS) education to underrepresented communities in tech, student Gideon Buddenhagen took on a research project that would make a big impact. Through his research, he found that young students of color without financial resources don’t have the same access to technology, computer science education and mentors who look like them — opportunities that had a meaningful effect on Gideon’s own life. So for his final project with Code Next, Gideon is introducing technical education to middle school students and helping them see the many doors tech can open for them.

“I wanted to offer opportunities to learn about computer science as a pathway out of poverty and show these students cool, smart role models who look like them,” Gideon said.

Leadership in Motion is a free program Gideon designed to expose middle school students in underrepresented communities to the field of technology through mentorship from diverse high school students who have participated in Code Next. This not only gives younger students access to tech education, it also provides high school students with leadership opportunities.

Gideon collaborated with his Code Next mentors and partnered with Bridge the Gap College Prep, a nonprofit serving low-income youth, to launch a nine-week pilot of Leadership in Motion in early October. Fifteen students signed up for the pilot session, taught by four high school student engineers, and Gideon and his partners plan to scale the program to more participants soon.

Gideon knows firsthand that initiatives like Code Next and other CS programs at Google can be transformative. And with Leadership in Motion, Gideon is opening new pathways for younger students — helping them learn about technology, grow their tech networks and explore exciting possibilities for their futures.

To learn more about Code Next or if you know a student who should apply for the program, sign up for updates.

Upload massive lists of products to Merchant Center using Centimani

Posted by Hector Parra, Jaime Martínez, Miguel Fernandes, Julia Hernández

Merchant Center lets merchants manage how their in-store and online product inventory appears on Google. It allows them to reach hundreds of millions of people looking to buy products like yours each day.


To upload their products, merchants can make use of feeds, that is, files with a list of products in a specific format. These can be shared with Merchant Center in different ways: using Google Sheets, SFTP or FTP shares, Google Cloud Storage or manually through the user interface. These methods work great for the majority of cases. But, if a merchant's product list grows over time, they might reach the usage limits of the feeds. Depending on the case, quota extensions could be granted, but if the list continues to grow, it might reach a point where feeds no longer support that scale, and the Content API for Shopping would become the recommended way to go forward.


The main issue is, if a merchant is recommended to stop using feeds and start using the Content API due to scale problems, it means that the number of products is massive, and trying to use the Content API directly will give them usage and quota errors, as the QPS and products per call limits will be exceeded.


For this specific use case, Centimani becomes critical in helping merchants handle the upload process through the Content API in a controlled manner, avoiding any overload of the API.


Centimani is a configurable massive file processor able to split text files in chunks, process them following a strategic pattern and store the results in BigQuery for reporting. It provides configurable options for chunk size and number of retries, and takes care of exponential backoff to ensure all requests have enough retries to overcome potential temporary issues or errors. Centimani comes with two operators: Google Ads Offline Conversions Uploader, and Merchant Center Products Uploader, but it can be extended to other uses easily.


Centimani uses Google Cloud as its platform, and makes use of Cloud Storage for storing the data, Cloud Functions to do the data processing and the API calls, Cloud Tasks to coordinate the execution of each call, and BigQuery to store the audit information for reporting.

Centimani Architecture

To start using Centimani, a couple of configuration files need to be prepared with information about the Google Cloud Project to be used (including the element names), the credentials to access the Merchant Center accounts and how the load will be distributed (e.g., parallel executions, number of products per call). Then, the deployment is done automatically using a deployment script provided by the tool.


After the tool is deployed, a cloud function will be monitoring the input bucket in Cloud Storage, and every time a file is uploaded there, it will be processed. The tool uses the name of the file to select the operator that is going to be used (“MC” indicates Merchant Center Products Uploader), and the particular configuration to use (multiple configurations can be used to connect to Merchant Center accounts with different access credentials).


Whenever a file is uploaded, it will be sliced in parts if it is greater than the number of products allowed per call, they will be stored in the output bucket in Cloud Storage, and Cloud Tasks will start launching the API calls until all files are processed. Any file with errors will be stored in a folder called “slices_failed” to help troubleshoot any issues found in the process. Also, all the information about the executions will be stored temporarily in Datastore and then moved to BigQuery, where it can be used for monitoring the whole process from a centralized place.


Centimani Status Dashboard Architecture

Centimani provides an easy way for merchants to start using the Content API for Shopping to manage their products, without having to deal with the complexity of keeping the system under the limits.


For more information you can visit the Centimani repository on Github.


That’s a wrap: Tips on keeping holiday gifts organized

Because I have an enormous family and am the type of person who squirrels away random gifts over the course of the year, holiday gift giving can get disorganized to say the least. Last year, I decided to stop simply trying to write down my list and keep track of gift shopping and delivering by hand. In lieu of these mental gymnastics, I added some structure to the whole endeavor. And now, ahead of the holiday shopping season, I’m sharing my system with you.

Start the hunt with Google Shopping

Whenever I get an idea for a gift, I’ll head to Google Shopping and search for an item, select the product page and check typical prices across the web to see if I should grab it now or wait. If the price is high or I’m not quite ready to make a decision, I turn on “Track price” so I’ll get a notification if it drops.

Animated gif showing how price comparison works on Google Shopping.

But there are also folks on my list who I don’t know as well…and there are a few White Elephant gifts I’ll need, too. For these purposes, I keep an eye on the deals feed on the Shopping tab. I also take note of the price badges on product cards — they’ll tell you things like “$5 off” or “25% off,” which can be helpful so I know if the deal I’m getting is actually a good one or just a small price drop.

Animated GIF showing the deals feed on Google Shopping.

Stay organized in Gmail and Sheets

Once I decide on a gift, it goes in my “gift tracker” that I use Google Sheets to make. I keep track of what I bought and whether I’ve wrapped and delivered it or not. (Go ahead and make a copy of my template and create your own if you want.)

Screenshot of a Google Sheets document titled “Gift tracker” with a list of names and different gift ideas and checkboxes for “bought,” “wrapped,” and “sent/delivered” labels across the sheet.

And when the actual purchase confirmation or receipt hits my inbox, I add it to a label I’ve made for gifts. All these emails are nested under a designated folder so they aren’t mixed in with the rest of my emails. Plus, that way, if I missed the mark with a present, it’s easy to find the gift receipt…hey, it happens to all of us.

Moving forward in Music City

It’s been awhile since we’ve given an update from Nashville, but we’ve been busy during that time building out our network in new neighborhoods. Currently, residents in The Nations, Charlotte Park, Whitebridge, Burton Hills, Woodmont, Sylvan Park, North Nashville, Edgehill, East Nashville, including Lockeland Springs, and many downtown apartments and condominiums can sign up for Google Fiber’s 1 Gig and 2 Gig service.

We’ve also amped up our construction efforts over the past year. Our crews are busy laying fiber in several neighborhoods across the city, and we expect those activities to increase further as we head into the new year.

Our community work has also continued to grow as our service area expands. In 2021, we’ve supported many local digital equity efforts to help connect even more of Nashville to the resources they need. These include:


As Google Fiber continues to grow in Nashville, we’re looking for ways to connect more people to great internet. 2021 has been our biggest year of growth yet, and we don’t intend to slow down now that we’re in stride.

Posted by Lauren Johannesmeyer, Head of Sales; Jesse Quirion, Head of Metro Technical Operations; and Daynise Joseph, Government & Community Affairs Manager.


~~~


author: Lauren Johannesmeyer; Jesse Quirion; Daynise Joseph

title: Head of Sales; Head of Metro Technical Operations; Government & Community Affairs Manager

category: city_news

categoryimage: true