 Posted by Ben Trengrove – Developer Relations Engineer, and Nick Butcher – Product Manager for Jetpack Compose

At Google I/O 2024, we announced the upcoming June ‘24 Jetpack Compose release, packed with features designed to make Android development faster and easier, no matter what form factor you are building for. We also announced expanded Compose support across the ecosystem of Android devices. This post provides an overview of all the announcements, in case you missed any.
Compose June ‘24 release
Compose is Android's modern, native UI toolkit that is used by apps such as Threads, Google Drive, and SoundCloud. This release adds major features you have been asking for, including shared element transitions and list reordering animations, and improves performance.
Shared element transitions

Modifier.sharedElement() and Modifier.sharedBounds() have been added to Compose. They allow you to create beautiful transitions between screens with finer control than the View system allowed. Wrap your AnimatedContent composables in SharedTransitionLayout and then add the Modifier.sharedElement() or Modifier.sharedBounds() onto the content that you’d like to share between screens. Compose will then find composables with matching keys and smoothly transition between them.
Navigation Compose and predictive back animations in Android 15 also work smoothly together with shared element transitions. This allows you to create screen transitions directly tied to the navigation gesture, which provides a high quality user experience.
Check out the documentation for more information.
Lazy list item animations

Lazy row and column now have the ability to automatically animate the insertion, removal, and reordering of items. Just add Modifier.animateItem() to your list items and changes will automatically animate. You can also customize the animation by providing different animation specifications.
Check out the documentation for the instructions.
Text
Text now supports inline links and basic HTML formatting via the new AnnotatedString.fromHtml() extension. This converts basic HTML formatting, including links to an AnnotatedString, which can then be rendered by Compose.
BasicTextField gains a new overload that accepts a TextFieldState; a new rich state object that allows more robust user experiences (such as rich content like keyboard gifs) and can be hoisted out of the component and updated asynchronously.
Note: Material TextField will be updated to use the new BasicTextField in a subsequent release, but if you’d like to try it out in your apps, see the documentation.
Contextual Flow Layouts
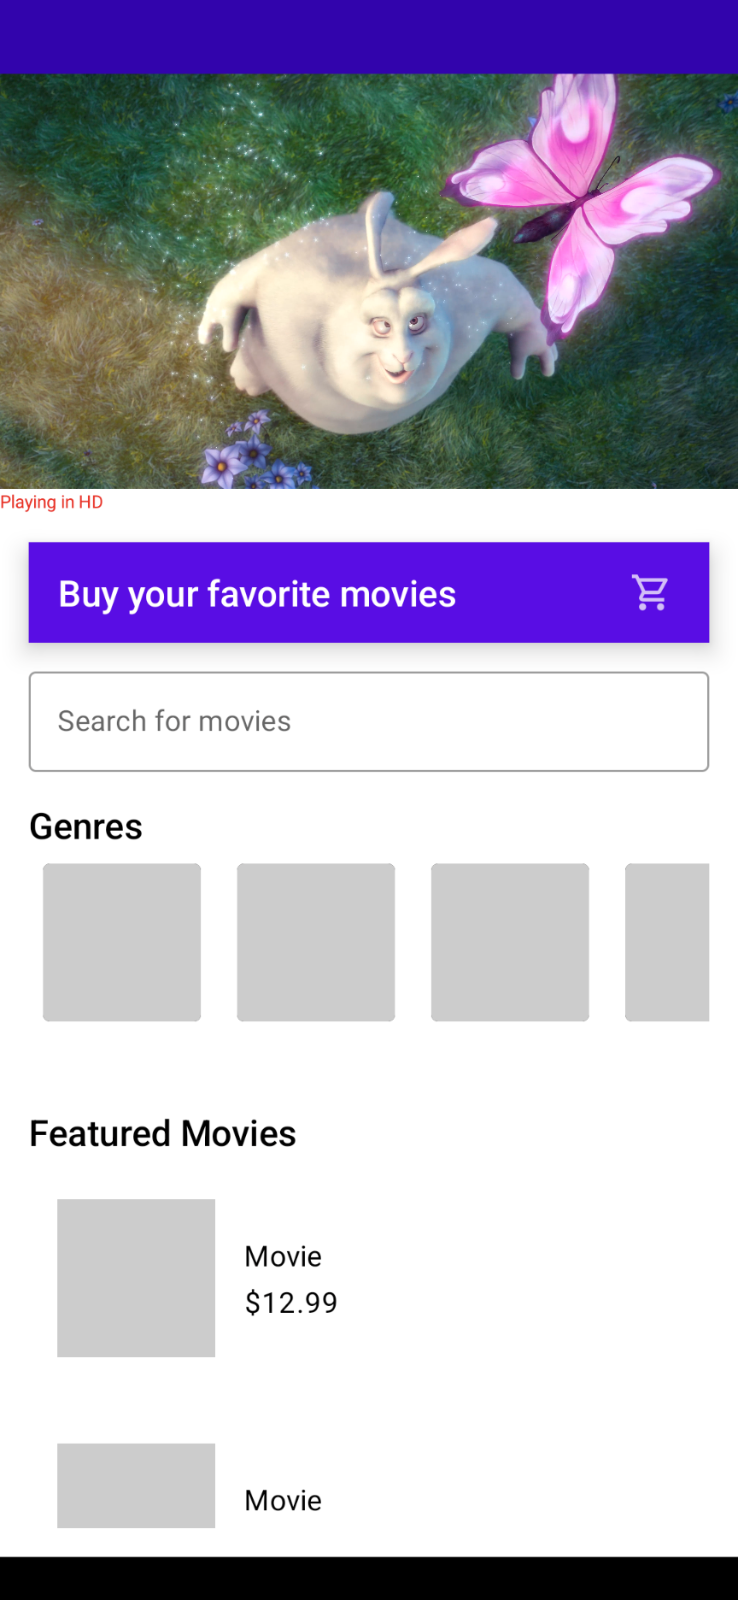
A commonly requested layout is a lazy flow layout that only composes the content that can fit. If you have ever needed this functionality, ContextualFlowRow and ContextualFlowColumn are for you. Given a max number of lines, the flow layout will compose as many items that can fit and then provide you the context of what was rendered. With this context, you can then render a custom expand indicator that shows a count of remaining items.
@OptIn(ExperimentalLayoutApi::class)
@Composable
private fun SuggestedSnacks(
   snacks: List<Snack>,
   onSnackClick: (Snack) -> Unit,
   modifier: Modifier = Modifier
) {
   var maxLines by remember { mutableIntStateOf(1) }
   ContextualFlowRow(
       maxLines = maxLines,
       overflow = ContextualFlowRowOverflow.expandIndicator {
           val remainingItems = totalItemCount - shownItemCount
           MyOverflowIndicator(
               remainingItems = remainingItems,
               modifier = Modifier
                   .clickable {
                       // Expand the max lines on click
                       maxLines += 1
                   }
           )
       },
       itemCount = snacks.size
   ) { index ->
       val snack = snacks[index]
       SnackItem(snack, onSnackClick)
   }
}

Performance improvements
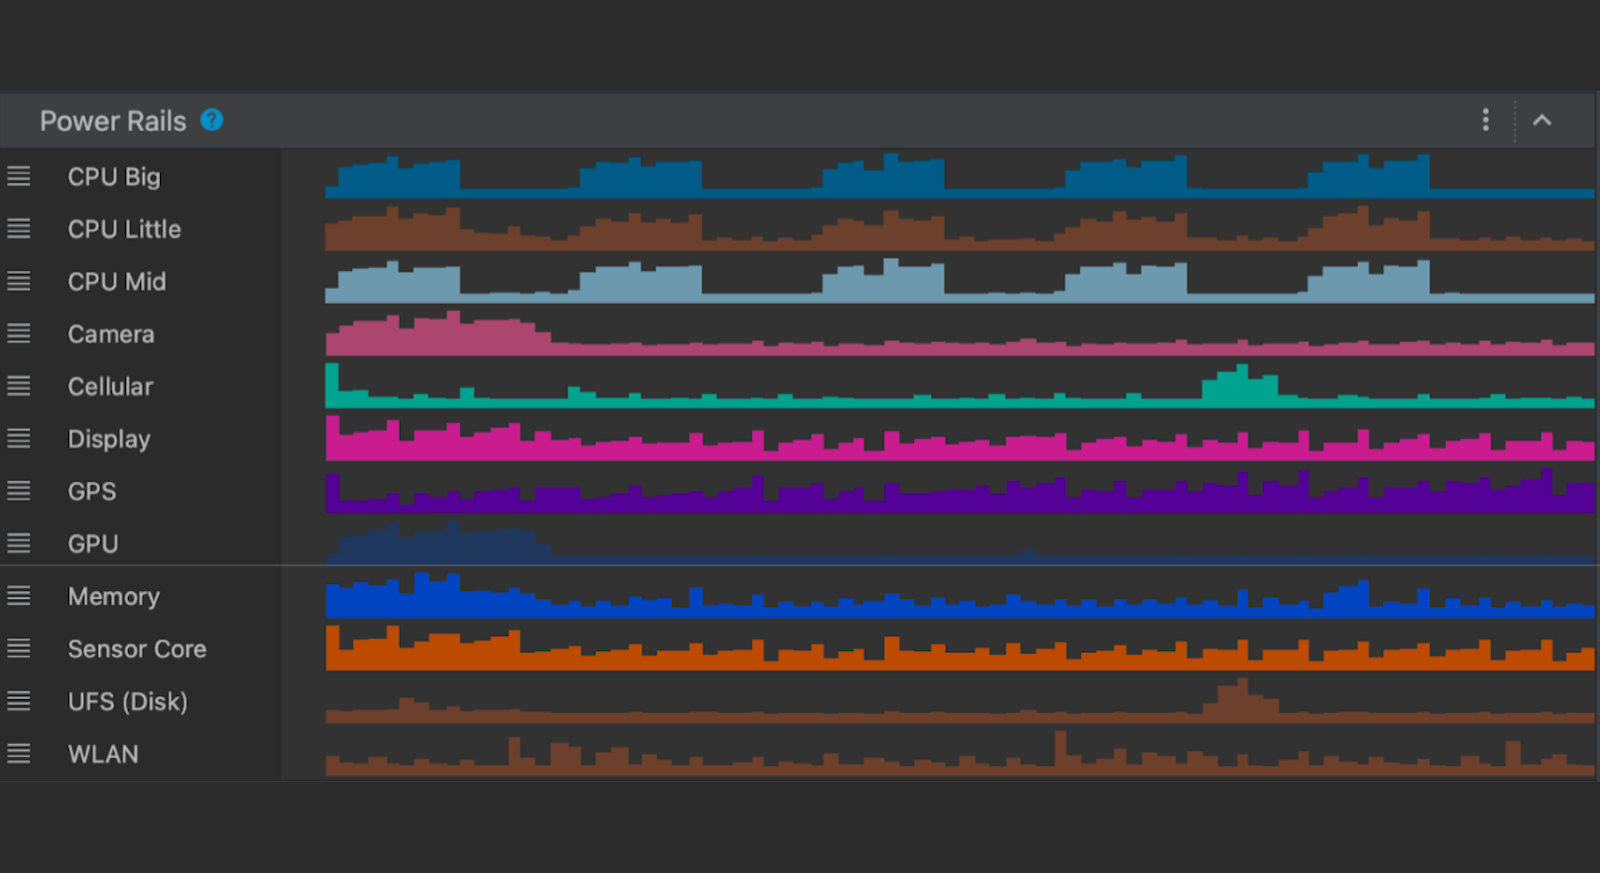
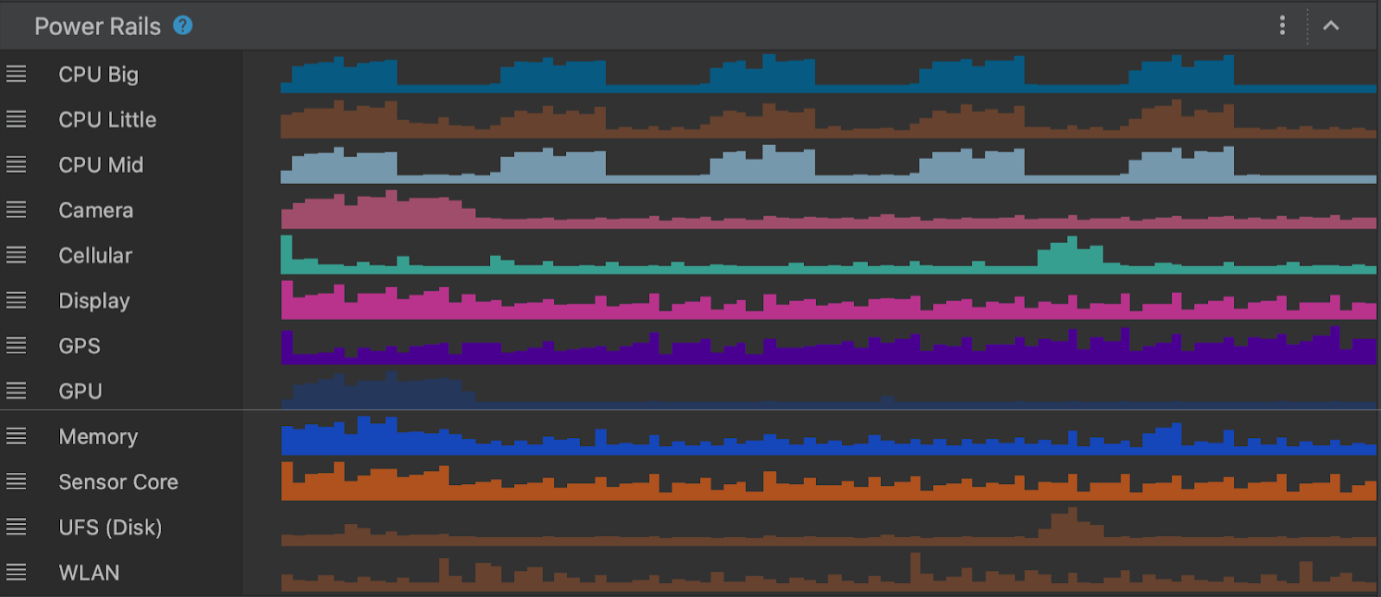
Jetpack Compose continues to get faster with every release. We are pleased to report that we have improved the time to first pixel benchmark of our Jetsnack sample by 17% compared to the January release. We gained these improvements simply by updating the sample app to the new Compose version. The chart below shows the improvement in Jetsnack with each Compose release, since the August 2023 release we have nearly halved the time to first pixel drawn of Jetsnack.

The indication APIs have been rewritten to allow for lazy creation of ripples, which is very important for scroll performance. For most apps, there should be no changes required, but upgrading might introduce breaking changes if you have custom indications. For help with the migration, see the new documentation.
We continue to improve the efficiency of the Compose runtime, which speeds up all Compose code in your app. We’ve re-engineered the slot table to a more efficient data structure, and we are also generating more efficient code by detecting and removing unused composition groups. Additionally, there are new APIs that now allow you to customize the behavior of lazy layout prefetching.
Strong skipping mode
Strong skipping mode has graduated from experimental status and is now production-ready—the upcoming 2.0.20 compiler release will enable this feature by default. Strong skipping mode simplifies composable skipping by allowing composables with unstable parameters to be skipped. This means more composables will skip automatically, reducing the need to manually annotate classes as stable. The Now In Android sample saw a 20% improvement in home screen recomposition time when enabling strong skipping. For more details see the documentation.
Compose compiler moving to the Kotlin repository
In case you missed our previous announcement, the Compose compiler will be hosted in the Kotlin repository from Kotlin 2.0. This means you will no longer have to wait for a matching Compose compiler to be released to upgrade your Kotlin version. For full details on this change and to learn about the new Compose Compiler Gradle plugin, see our announcement blog post.
Stable APIs
We continue to stabilize experimental APIs and remove experimental annotations. Notable APIs for this release include Pager, AnchoredDraggable, SegmentedButton, SwipeToDismissBox, Slider, and more.
Compose support across Android form factors
We continue to extend Jetpack Compose to all Android form factors to make it faster and easier to build beautiful Android apps, no matter what Android form factor you are targeting. At I/O this year we announced a number of updates to support building layouts that adapt across screen sizes, Compose for TV reaching 1.0 Beta and updates to Compose for Wear OS.
Jetpack Libraries
Type safe navigation in Navigation Compose
As of Jetpack Navigation 2.8.0-alpha08, the Navigation Component has a full type safe system based on Kotlin Serialization for defining your navigation graph when using our Kotlin DSL, designed to work best with integrations like Navigation Compose.
Now, you can define your navigation destinations and parameters as serializable objects.
// Define a home destination that doesn't take any arguments
@Serializable
object Home

// Define a profile destination that takes an ID
@Serializable
data class Profile(val id: String)
Then, when defining your NavGraph, passing the object is enough. No more route strings!
NavHost(navController, startDestination = Home) {
    composable<Home> {
        HomeScreen(onNavigateToProfile = { id ->
            navController.navigate(Profile(id))
        })
     }
     composable<Profile> { backStackEntry ->
         val profile: Profile = backStackEntry.toRoute()
         ProfileScreen(profile)
     }
}
For more information, see this blog post.
CameraX Compose
We are releasing a new Compose-specific CameraX artifact called camera-viewfinder-compose. In this first alpha release, you can use the new Viewfinder composable to display a camera preview on your screen that always shows the correct aspect ratio and rotation, whether you resize your window, unfold your device, or change the display or orientation. It also correctly handles camera and surface lifecycles, something that can be difficult when dealing with cameras. It also enables complex interactions in the camera coordinate system, making it easy for you to implement gestures such as tap-to-focus or pinch-to-zoom.
You can use the Viewfinder composable even when you aren’t using any of the other CameraX libraries, and link it directly to your Camera2 code.
We are actively working on improving the APIs and are looking forward to your feedback! Check out the known issues, and raise bugs or feature requests to help us create the best possible camera experience in Compose.
Get started
We’re grateful for all of the bug reports and feature requests submitted to our issue tracker that led to these changes — they help us to improve Compose and build the APIs you need. Please continue providing your feedback, and help us make Compose better for you.
Wondering what’s next? Check out our roadmap to see the features we’re currently thinking about and working on. We can’t wait to see what you build.
Happy composing!
 Posted by Yafit Becher – Product Manager


 Posted by Adarsh Fernando, Senior Product Manager, Android Studio

 Posted by Timothy Jordan – Director, Developer Relations and Open Source

 Posted by Chris Wilk – Senior Product Manager, Android Health
 Posted by


 Posted by Ben Trengrove - Developer Relations Engineer, Nick Butcher - Product Manager for Jetpack Compose

 Posted by Mayank Jain - Product Manager, and Yasser Dbeis - Software Engineer; Android Studio
 Posted by
.gif)


 Posted by Nick Butcher – Product Manager for Jetpack Compose, and Florina Muntenescu – Developer Relations Engineer