Posted by Neville Sicard-Gregory – Senior Product Manager, Android Studio
Looking for a more stable, reliable, and performant Emulator? Download the latest version of Android Studio or ensure your Emulator is up to date in the SDK Manager.
We know how critical the stability, reliability, and performance of the Android Emulator is to your everyday work as an Android developer. After listening to valuable feedback about stability, reliability, and performance, the Android Studio team took a step back from large feature work on the Android Emulator for six months and started an initiative called Project Quartz. This initiative was made up of several workstreams aimed at reducing crashes, speeding up startup time, closing out bugs, and setting up better ways to detect and prevent issues in the future.
Improved stability and reliability
A key goal of Project Quartz aimed to reduce Emulator crashes, which can frustrate and block developers, decreasing their productivity. We focused on fixing issues causing backend and UI crashes and freezes, updated the UI framework, updated our hypervisor framework, and our graphics libraries, and eliminated tech debt. This included:
Moving to a newer version of Qt, the cross-platform framework for building the graphical user interfaces of the Android Emulator, and making it stable on all platforms (as of version 34.2.13/ This was also a required change to ensure things like Google Maps and the location settings UI continued to work in the Android Emulator.
Updating gfxstream, the graphics rendering system used in the Android Emulator, to improve our graphics layer.
Adding more than 600 end-to-end tests to the existing pytests test suite.
As a result, we have seen 30% fewer crashes in the latest stable version of Android Studio, as reported by developers who have opted-in to sharing crash details with us. Along with additional end-to-end testing, this means a more stable, reliable, and higher quality experience with fewer interruptions while using the Android Emulator to test your apps.
This chart illustrates the reduction in reported crashes by stable versions of the Android Emulator (newer versions are at the top and shorter is better).
We have also enhanced our opt-in telemetry and logging to better understand and identify the root causes of crashes, and added more testing to our pre-launch release process to improve our ability to detect potential issues prior to release.
Improved release quality
We also implemented several measures to improve release quality, including increasing the number and frequency of end-to-end, automated, and integration tests on macOS, Microsoft Windows, and Linux. Now, more than 1,100 end-to-end tests are ran in postsubmit, up from 500 tests in the past implementation, on all supported operating system platforms . These tests cover various scenarios, including (among other features) different Android Emulator snapshot configurations, diverse graphics card considerations , networking and Bluetooth functionality, and performance benchmarks between Android Emulator system image versions.
This comprehensive testing ensures these critical components function correctly and translates to a more reliable testing environment for developers. As a result, Android app developers can accurately assess their app's behavior in a wider range of scenarios.
Reduced open issues and bugs
It was also important for us to reduce the number of open issues and bugs logged for the Android Emulator by addressing their root cause and ensuring we cover more of the use cases you run into in production. During Project Quartz, we reduced our open issues by 43.5% from 4,605 to 2,605. 17% of these were actively fixed during Quartz and the remaining were closed as either obsoleted or previously fixed (e.g. in an earlier version of the Android Emulator) or duplicates of other issues.
Next Steps
While these improvements are exciting, it's not the end. We will continue to build on the quality improvements from Project Quartz to further enhance the Android Emulator experience for Android app developers.
As always, your feedback has and continues to be invaluable in helping us make the Android Emulator and Android Studio more robust and effective for your development needs. Sharing your metrics and crashdumps is crucial in helping us understand what specifically causes your crashes so we can prioritize fixes.
You can opt-in by going to Settings, then Appearance and Behavior, then System Settings, then Data Sharing, and selecting the checkbox marked ‘Send usage statistics to Google.'
Be sure to download the latest version of the Android Emulator alongside Android Studio to experience these improvements.
As always, your feedback is important to us – check known issues, report bugs, suggest improvements, and be part of our vibrant community on LinkedIn, Medium, YouTube, or X. Together, we can create incredible Android experiences for users worldwide!
Posted by Sandhya Mohan, Product Manager, Android Studio
Today, we are thrilled to announce the stable release of Android Studio Koala Feature Drop (2024.1.2)!🐨
Earlier this year, we announced that every Android Studio animal version will have two releases: a platform release and a feature drop release. These more frequent updates get important IntelliJ updates to you faster, while we focus on quality and polish for Android-specific features. The Koala platform release was launched in June. Today, we'll walk through the feature drop release.
Get access to cutting-edge features like new devices in device streaming, Compose previews for Glance widgets, USB cable speed detection, support for Android 15 in the Android SDK Upgrade Assistant, and much more. All of these new features are designed to accelerate your Android app development workflow in building next-generation and high-quality apps.
Read on to learn more about all the updates, quality improvements, and new features across your key workflows in Android Studio Koala Feature Drop, and download the latest stable version today to try them out!
Develop
Android Device Streaming: more devices and improved sign-up
Android Device Streaming now includes the following devices, in addition to the portfolio of 20+ device models already available:
Google Pixel 9
Google Pixel 9 Pro
Google Pixel 9 Pro XL
Google Pixel 9 Pro Fold
Google Pixel 8a
Samsung Galaxy Fold5
Samsung Galaxy S23 Ultra
Additionally, if you're new to Firebase, Android Studio automatically creates and sets up a no-cost Firebase project for you when you sign-in to Android Studio to use Device Streaming. As a result, you can get to streaming the device you need much faster. Learn more about Android Device Streaming quotas, including promotional quota for the Firebase Blaze plan projects available for a limited time.
As we announced at Google I/O 2024, we’re further expanding the selection of devices available by working with partners, such as Samsung, Xiaomi, and OnePlus, to allow you to connect to devices hosted in their device labs. To learn more and enroll in the upcoming Early Access Preview, see the official blog post.
Device Streaming
Target Android 15 using Android SDK Upgrade Assistant
The Android SDK Upgrade Assistant provides a step-by-step wizard to help you upgrade your targetSdkVersion. It also pulls documentation directly into Android Studio, saving you time and effort. Android Studio Koala Feature Drop adds support for upgrading projects to Android 15 (API Level 35).
Android SDK Upgrade Assistant
Updated sign-in flow to Google services
It's now easier to sign in to multiple Google services with one authentication step. Whether you use Gemini in Android Studio, Firebase for Android Device Streaming, Crashlytics in App Quality Insights, Google Play for Android Vitals reports, or some combination of these services, the new sign-in flow makes it easier to get up and running. With granular permissions scoping, you'll always be in control of which services have access to your account. To get started, click the profile avatar on the top right corner and sign-in with your developer account.
Updated sign-in wizard
Wear OS Tile Preview Panel
You can now view snapshots of your Wear OS app's tiles by including version 1.4 of the Jetpack Tiles library. This preview panel is particularly useful if your tile's appearance changes based on certain conditions, such as content that depends on the device's display size, or a sports event reaching halftime.
Wear OS Tile Preview Panel
Compose Glance widget previews
Android Studio Koala Feature Drop makes it easy to preview your Jetpack Compose Glance widgets directly within the IDE. You can even use multi-previews to preview at standard widget sizes and their designed widget breakpoints (sample code). Catch potential UI issues and fine-tune your widget's appearance early in the development process or while debugging any UI issues. Learn more.
Previews for Compose Glance widgets
Live Edit (Compose)
Live Edit is now enabled in manual mode by default. It has increased stability and more robust change detection, including support for import statements. Note that starting with Android Studio Koala Feature Drop, the default shortcut to push your changes in manual mode has been updated to Control+' (Command+' on macOS). You can customize the shortcut on the Keymap settings page.
Making an update with Live Edit in manual mode
Debug
USB Cable Speed Detection
Android Studio now detects when it's possible to connect your Android device with a faster USB cable and suggests an upgrade that maximizes your device capabilities. Using an appropriate USB cable optimizes app installation time and minimizes latency when using tools such as the Android Studio debugger. USB cable speed detection is currently available for macOS and Linux. Learn more.
While most readily available USB cables are still the older USB 2.0 standard, the majority of modern devices support the significantly faster USB 3.0. Upgrading to a USB 3.0 cable can potentially increase your data transfer speeds up to 10x.
USB cable speed detection
Device UI Shortcuts
To help you build and debug your UI, we've introduced Device UI shortcuts button action in the Running Devices tool window in Android Studio. Use the shortcuts to view the effect of common UI settings such as dark theme, font size, screen size, app language and TalkBack. You can use the shortcuts with emulators, mirrored physical devices, and devices streamed from Firebase Test Lab. Device UI shortcuts are available for devices running API level 33 or higher. Learn more.
Device UI Setting Shortcuts in Running Device Window
Pixel 8a in Emulator
The Android Emulator (35.1+) now supports the Pixel 8a in the stable channel, enabling you to test your apps on more Pixel devices without needing a physical device. Find the new Pixel 8a in the phone category when you create a new virtual device. Additionally, you can find Pixel 9 devices in the canary release channel of Android Studio.
Pixel 8a in Emulator
Optimize
Faster and improved Profiler with a task-centric approach
Popular performance optimization tasks like capturing a system trace with profileable apps now start up to 60% faster*. The Profiler's task-centric redesign also makes it easier to start the task you're interested in, whether it's profiling your app's CPU, memory, or power usage. For example, you can start a system trace task to profile and improve your app's startup time right from the UI as soon as you open the Profiler.
Faster and improved Profiler with a task-centric approach
* Based on internal data, as tested in April 2024
Quality improvements
Beyond new features, we also continue to improve the overall quality and stability of Android Studio. In fact, the Android Studio team addressed over 520 bugs during the Koala Feature Drop development cycle.
IntelliJ platform update
Android Studio Koala Feature Drop (2024.1.2) includes the IntelliJ 2024.1 platform release, which has many new features such as comprehensive support for the latest Java** 22 features, an improved terminal, and sticky lines in the editor to simplify working with large files and exploring new codebases.
The improved terminal features a fresh new look, with commands separated into distinct blocks, along with an expanded set of features, such as smooth navigation between blocks, command completion, and easy access to the command history. Learn more.
Sticky lines in the editor keeps key structural elements, like the beginnings of classes or methods, pinned to the top of the editor as you scroll and provides an option to promptly navigate through the code by clicking on a pinned line. Learn more.
Basic IDE functionalities like code highlighting and completion now work for Java and Kotlin during project indexing, which should enhance your startup experience.
To recap, Android Studio Koala Feature Drop includes the following enhancements and features:
Develop
Android Device Streaming: more devices and improved sign-up
Target Android 15 using Android SDK Upgrade Assistant
Updated sign-in flow to Google services
Wear OS Tile Preview Panel
Compose Glance widget previews
Live Edit (Compose)
Debug
USB Cable Speed Detection
Device UI Settings Picker
Pixel 8a in Emulator
Optimize
New Task UX for Profilers
Quality Improvements
520+ bugs addressed
IntelliJ Platform Update
Improved terminal
Sticky lines in the editor to simplify working with large codebases
Enhanced startup experience
Getting Started
Ready for next-level Android development? Download Android Studio Koala Feature Drop and unlock these cutting-edge features today! As always, your feedback is important to us – check known issues, report bugs, suggest improvements, and be part of our vibrant community on LinkedIn, Medium, YouTube, or X. Let's build the future of Android apps together!
**Java is a trademark or registered trademark of Oracle and/or its affiliates.
Posted by Grant Yang (Product Manager for OmniLab) & Adarsh Fernando (Product Manager for Android Studio)
At Google I/O 2024, we announced Android Device Streaming in open beta, which allows you as a developer to more easily access and interactively test your app on real physical devices located in Google data centers and streamed directly to Android Studio. This enables teams in any location to access a variety of devices across top Android device manufacturers, including the latest family of Google Pixel and Samsung Galaxy series devices.
We’re significantly expanding on the diversity of devices available in this service by working closely with Android device manufacturers (also known as original equipment manufacturers, or OEMs)—such as Samsung, Xiaomi, and Oppo—to connect their device labs to Android Device Streaming, so you can access even more physical devices directly in your workflow in Android Studio. This integration is offered with the same performance, stability, and security benefits you get with devices provided by Google. Keep reading for more details below, as well as how you can sign up for the early access and take advantage of these new devices.
Access devices hosted by Google and other OEMs, such as Samsung, with Android Device Streaming, powered by Firebase
Signup for Early Access to OEM Lab Devices
If you haven’t already done so, follow the steps to get up and running with the beta release of Android Device Streaming, which will give you access to all the Google-hosted devices to test with directly from Android Studio. Later this year, we will start an Early Access Program that allows participants to use Android Device Streaming to connect to devices hosted by our OEM partners. This expands the catalog of test devices available to you with Android Device Streaming.
To kick off this program, we’re first partnering with Samsung, Xiaomi, and Oppo. These labs will be situated in various locations around the world, and you will be able to use the Firebase project you’re already using with Android Device Streaming in Android Studio to access them. Your Firebase project’s administrator will have control to enable or disable individual OEM labs.
If you’d like to participate in the EAP for accessing OEM device labs, fill out this form, and we will let you know if you and your team have been accepted. During the EAP, OEM-provided devices will not be billed or counted against your promotional monthly quota.
We look forward to sharing more details during Google’s I/O Connect Beijing in early August 2024.
In the meantime, we encourage you to try out the devices currently available in Android Device Streaming. Currently, the Android Device Streaming program is in a promotional period, with a higher amount of monthly minutes offered at no cost, which will last until approximately February 2025.
OEM Labs powered by OmniLab
Some of you may wonder how these devices are being connected through to Android Studio. Under the hood, Android Device Streaming is built on top of the device platform for Google, OmniLab. OmniLab, the same device platform that powers all internal device labs, is also powering the OEM labs. Omnilab did this by open sourcing their Android Test Station (ATS) framework available to its open source.
OmniLab provides a framework to ensure that your Android Device Streaming session is secure and performant. You’re able to deploy, debug, and interact with your app on these remote devices through a direct ADB over SSL connection, all without having to leave the IDE. And when the session ends, the device data is fully wiped and factory reset before it’s made available to another developer.
In summary, if you’d like to participate in the EAP for accessing OEM device labs, fill out this form, and we will let you know if you and your team have been accepted. During the EAP, OEM-provided devices will not be billed or counted against your promotional monthly quota.
Be part of our vibrant community on LinkedIn, Medium, YouTube, or X and share your experiences on using Android Device streaming in Android Studio.
Posted by Paris Hsu – Product Manager, Android Studio
We shared an exciting live demo from the Developer Keynote at Google I/O 2024 where Gemini transformed a wireframe sketch of an app's UI into Jetpack Compose code, directly within Android Studio. While we're still refining this feature to make sure you get a great experience inside of Android Studio, it's built on top of foundational Gemini capabilities which you can experiment with today in Google AI Studio.
Specifically, we'll delve into:
Turning designs into UI code: Convert a simple image of your app's UI into working code.
Smart UI fixes with Gemini: Receive suggestions on how to improve or fix your UI.
Integrating Gemini prompts in your app: Simplify complex tasks and streamline user experiences with tailored prompts.
Note: Google AI Studio offers various general-purpose Gemini models, whereas Android Studio uses a custom version of Gemini which has been specifically optimized for developer tasks. While this means that these general-purpose models may not offer the same depth of Android knowledge as Gemini in Android Studio, they provide a fun and engaging playground to experiment and gain insight into the potential of AI in Android development.
Experiment 1: Turning designs into UI code
First, to turn designs into Compose UI code: Open the chat prompt section of Google AI Studio, upload an image of your app's UI screen (see example below) and enter the following prompt:
"Act as an Android app developer. For the image provided, use Jetpack Compose to build the screen so that the Compose Preview is as close to this image as possible. Also make sure to include imports and use Material3."
Then, click "run" to execute your query and see the generated code. You can copy the generated output directly into a new file in Android Studio.
Image uploaded: Designer mockup of an application's detail screen
Running the generated code (with minor fixes) in Android Studio
With this experiment, Gemini was able to infer details from the image and generate corresponding code elements. For example, the original image of the plant detail screen featured a "Care Instructions" section with an expandable icon — Gemini's generated code included an expandable card specifically for plant care instructions, showcasing its contextual understanding and code generation capabilities.
Experiment 2: Smart UI fixes with Gemini in AI Studio
Inspired by "Circle to Search", another fun experiment you can try is to "circle" problem areas on a screenshot, along with relevant Compose code context, and ask Gemini to suggest appropriate code fixes.
You can explore with this concept in Google AI Studio:
1. Upload Compose code and screenshot: Upload the Compose code file for a UI screen and a screenshot of its Compose Preview, with a red outline highlighting the issue—in this case, items in the Bottom Navigation Bar that should be evenly spaced.
Example: Preview with problem area highlighted
2. Prompt Gemini: Open the chat prompt section and enter
"Given this code file describing a UI screen and the image of its Compose Preview, please fix the part within the red outline so that the items are evenly distributed."
Google AI Studio: Smart UI Fixes with Gemini
3. Gemini's solution: Gemini returned code that successfully resolved the UI issue.
Example: Generated code fixed by Gemini
Example: Preview with fixes applied
Experiment 3: Integrating Gemini prompts in your app
Gemini can streamline experimentation and development of custom app features. Imagine you want to build a feature that gives users recipe ideas based on an image of the ingredients they have on hand. In the past, this would have involved complex tasks like hosting an image recognition library, training your own ingredient-to-recipe model, and managing the infrastructure to support it all.
Now, with Gemini, you can achieve this with a simple, tailored prompt. Let's walk through how to add this "Cook Helper" feature into your Android app as an example:
1. Explore the Gemini prompt gallery: Discover example prompts or craft your own. We'll use the "Cook Helper" prompt.
2. Open and experiment in Google AI Studio: Test the prompt with different images, settings, and models to ensure the model responds as expected and the prompt aligns with your goals.
3. Generate the integration code: Once you're satisfied with the prompt's performance, click "Get code" and select "Android (Kotlin)". Copy the generated code snippet.
4. Integrate the Gemini API into Android Studio: Open your Android Studio project. You can either use the new Gemini API app template provided within Android Studio or follow this tutorial. Paste the copied generated prompt code into your project.
That's it - your app now has a functioning Cook Helper feature powered by Gemini. We encourage you to experiment with different example prompts or even create your own custom prompts to enhance your Android app with powerful Gemini features.
Our approach on bringing AI to Android Studio
While these experiments are promising, it's important to remember that large language model (LLM) technology is still evolving, and we're learning along the way. LLMs can be non-deterministic, meaning they can sometimes produce unexpected results. That's why we're taking a cautious and thoughtful approach to integrating AI features into Android Studio.
Our philosophy towards AI in Android Studio is to augment the developer and ensure they remain "in the loop." In particular, when the AI is making suggestions or writing code, we want developers to be able to carefully audit the code before checking it into production. That's why, for example, the new Code Suggestions feature in Canary automatically brings up a diff view for developers to preview how Gemini is proposing to modify your code, rather than blindly applying the changes directly.
We want to make sure these features, like Gemini in Android Studio itself, are thoroughly tested, reliable, and truly useful to developers before we bring them into the IDE.
What's next?
We invite you to try these experiments and share your favorite prompts and examples with us using the #AndroidGeminiEra tag on X and LinkedIn as we continue to explore this exciting frontier together. Also, make sure to follow Android Developer on LinkedIn, Medium, YouTube, or X for more updates! AI has the potential to revolutionize the way we build Android apps, and we can't wait to see what we can create together.
Posted by Adarsh Fernando, Senior Product Manager, Android Studio
Three years ago, we changed how we named and versioned Android Studio to make it easier to follow updates – we changed how we numbered the versions of the IDE to more closely map to versioning of the IntelliJ IDEA platform, on which Android Studio is built. We also introduced animal codenames to signify each major release, starting with Arctic Fox. Our most recent release, Koala (2024.1.1), will soon be available in the Beta channel and is built on top of IntelliJ IDEA 2024.1. All Studio releases use a version number that maps to the following schema:
<Year of IntelliJ Version>.<IntelliJ major version>.<Studio major version>
Soon, we are launching the Koala Feature Drop to the Canary channel as version 2024.1.2 — our second release based on IntelliJ IDEA 2024.1. This signals the start of an improved release cycle, where each animal codename includes two major Studio releases: a platform update followed by a feature drop.
The initial animal releases will have the ‘.1’ Android Studio major version and introduce the updated IntelliJ platform version, while subsequent Feature Drops will increase the Android major version to ‘.2’ and focus on introducing Android-specific features that help you be more productive for Android app development.
Versioning system
Year of IntelliJ Version
IntelliJ major version
Studio major version
Jellyfish
2023
.3
.1
Koala
2024
.1
.1
Koala Feature Drop
2024
.1
.2
Leading with IDE platform updates
Going forward, each new “animal” of Android Studio will prioritize updates to the underlying IntelliJ platform. This focus on foundational elements lets developers benefit from usability, performance, and stability improvements to the underlying IntelliJ IDEA platform.
The base version of Android Studio Koala, numbered 2024.1.1 and launched to Canary in March, focuses on adopting updates from IntelliJ IDEA 2024.1. Some benefits of this platform update include:
Sticky lines in the editor to simplify working with large files and exploring new codebases
Overhauled terminal featuring both visual and functional enhancements
Basic IDE functionalities available for Java and Kotlin during indexing
Language injections in string templates
(Alpha) K2 Kotlin mode for enhanced Kotlin code analysis
By focusing a whole release cycle on updating to the latest IntelliJ IDEA platform version, we’re able to get those changes into the Stable channel faster than with the previous release process — ensuring developers have access to the latest upstream features and improvements.
Android-specific functionality with Feature Drops
Feature Drops are built on top of the IntelliJ platform updates, and follow soon after each new animal release.
Android Studio is a tailored environment for Android developers. You will continue to receive new and updated features specifically designed for Android development. These will arrive through Feature Drops that share the same animal codename as the base release, and will follow soon after the base animal release hits the Stable channel. Our first such release is Android Studio Koala Feature Drop, and numbered 2024.1.2.
When the Android Studio Koala Feature Drop is available, you can benefit from these new features:
A new sign-in flow that makes onboarding with multiple Google services, such as Firebase and Gemini in Android Studio, much easier
Device UI Setting Shortcuts in the Running Device Window to quickly test your app against different device UI settings
A new Gemini API template to help build Generative AI into your app
Feature Drops will leverage the stabilized IDE platform from the previous Android Studio update and focus on new features geared towards Android development. By doing so, we hope to bring these features to the stable channel faster and with higher quality. To learn about even more new features coming to Koala Feature Drop, make sure to tune in to Google I/O 2024.
To sum it up: 2X more frequent updates
Expected release schedule in the Android Studio Stable channel.
Our primary goal with these changes is to ensure that important updates to the IntelliJ IDEA platform reach the Android Studio Stable channel more frequently, and new Android-specific features ship with higher quality and polish. Expect the first animal release to introduce a number of updates from the latest IntelliJ IDEA platform, with a Feature Drop update to follow soon after with more Android-specific features and tools.
By separating IDE platform updates from Feature Drops, we can deliver both types of enhancements in a more streamlined manner, resulting in much more frequent updates to the stable channel that are each focused on improving your productivity.
Similarly, versions of the Android Gradle plugin will also see updates to the stable channel more frequently. Each new animal version and Feature Drop of Android Studio will be accompanied by a new version of the Android Gradle plugin. For example, Android Studio Koala was released alongside AGP 8.5 and Android Studio Koala Feature Drop will be released alongside AGP 8.6.
As always, if you want to be on the cutting edge, we encourage you to join the Canary channel by downloading and installing Android Studio Koala Feature Drop for early access to the latest and greatest. Also you can be part of our vibrant Android developer community on LinkedIn, Medium, YouTube, or X.
Posted by Paris Hsu – Product Manager, Android Studio
Android Studio Jellyfish (2023.3.1) is making waves with its official stable release! 🪼🌊 Dive into cutting-edge AI features like Gemini in Android Studio, seamless Google services integrations like Android Device Streaming, and much more. All designed to supercharge your Android development to build next-generation, high-quality apps.
Surf below to learn more about all the updates, product quality improvements, and new features across your key flows in Android Studio Jellyfish, and download the latest stable version today to try them out!
Develop
Gemini in Android Studio: stable, and now available in 200+ countries!
Today, Gemini in Android Studio is available in over 200+ countries and territories, including a new set of countries in Europe. Thanks to all of the valuable feedback you’ve provided us over the last year, we’re excited to bring Gemini in Android Studio (formerly Studio Bot) into this stable release of Android Studio, as your AI-powered development companion in Android Studio, ready to level up your productivity. Ask your Android development questions and get help instantly: whether it’s to generate code, find resources, or explain best practices, Gemini in Android Studio is here to save you valuable time. Plus, it integrates seamlessly with your workflow:
Chat: Get code samples and questions answered
AI code completion: Intelligent suggestions as you type
Error analysis: Understand Logcat and Build errors with ease
Smart actions: Streamline tasks with powerful shortcuts
Onboard and then opt-in with the built-in AI privacy controls, and learn more about how the current capabilities of Gemini in Android Studio can accelerate your development workflow.
Modular login permissions
To provide you with more precise control over the permissions you grant for specific features, the new sign-in flow lets you select only the Google Service integrations you want to enable. This means you decide exactly which features, like Gemini for Android Studio, App Quality Insights, and Android Device Streaming, are able to access the required Google services using your Google account.
Manage login settings in Android Studio
Switch accounts in Android Studio
Debug
Android Device Streaming, powered by Firebase
Android Device Streaming, powered by Firebase, lets you securely connect to remote physical Android devices hosted in Google's secure data centers. It’s a fast and easy way to test your app against physical units of some of the latest Android devices, including the Google Pixel 8 and 8 Pro, Pixel Fold, select Samsung devices, and more.
Device Streaming in Android Studio, running your app on a remote Pixel Fold
After connecting to a device, you can deploy your app, view the display, interact with the device (including rotating or unfolding the device), and anything else you might do with a device using a direct ADB over SSL connection—all without leaving Android Studio. When you're done using the device, Google wipes all your data and factory resets the device before making it available to another developer.
Android Device Streaming is currently available as a no-cost trial after you sign in to Android Studio with your Google account and select a Firebase project to use. If you don’t already have a Firebase project, it’s easy to create one.
AQI Crashlytics: Multi-events, keys, and logs
Dive deeper into App Quality Insights (AQI) crash reports with Android Studio Jellyfish! We've listened to your feedback and made analyzing crashes easier than ever:
Iterate through events: Now explore multiple events within a Crashlytics report in reverse chronological order, revealing patterns for faster debugging.
Explore custom data: View custom keys/values and logs for each Crashlytics crash report (find them in the Keys and Logs tabs after selecting a report).
Analyze ANRs (Application Not Responding): Access and investigate ANRs directly within both the Android Vitals and Crashlytics tabs.
Device Streaming in Android Studio, running your app on a remote Pixel Fold
Embedded Layout Inspector
In Android Studio Jellyfish, Layout Inspector is now embedded by default in the Running Devices tool window. This integration saves screen real-estate, centralizes your workflow in a single tool window, and delivers significant performance gains - with a 50% improvement in rendering speeds. You can effortlessly toggle between deeply inspecting and interacting with your app, and use snapshots for 3D visualizations of your UI. Discover the full range of features here.
Embedded Layout Inspector with Pixel Fold Emulator
Optimize
App Links Assistant: Web associations file support
App Links Assistant now supports web association file validation. This new feature streamlines deep linking by helping you identify and fix errors in your deep links setup (both in your Android manifest file and the corresponding Digital Asset Links JSON file). Ensure a seamless user experience by validating that your JSON file is correctly formatted for upload to your domain.
App Links Assistant: Web associations file support
Baseline Profile installation
Baseline Profiles improve code execution speed by about 30% from the first launch by avoiding interpretation and just-in-time (JIT) compilation steps for included code paths. While Android Studio has included Baseline Profiles in builds for years now, these were only actually compiled by the OS in production (often by Play Store).
Android Studio Jellyfish now compiles these Baseline Profiles when any non-debuggable app build is installed on a device. This applies to release builds, as well as when you're profiling with low-overhead.
This means — as long as you aren't using a debug variant of your app — the performance you see when installing from Studio / CLI now much more closely matches production by taking advantage of profiles from a Baseline Profile generator module and libraries like Compose.
Quality improvements
Beyond new features, we also continue to improve the overall quality and stability of Android Studio. In fact, over 900 bugs were addressed during the Jellyfish/AGP-8.4 cycle, and memory errors are down by 40%.
IntelliJ platform update
Android Studio Jellyfish (2023.3.1) includes the IntelliJ 2023.3 platform release, which has many new features such as comprehensive support for the latest Java 21 programing language features, an intuitive floating toolbar with editing actions, and a Run to Cursor inlay option in the debugger to speed up your workflow. Learn more.
Summary
To recap, Android Studio Jellyfish 🪼includes the following enhancements and features:
Develop
Gemini in Android Studio
Modular login permissions
Debug
Android Device Streaming
AQI Crashlytics: Multi-events, keys, and logs
Embedded Layout Inspector
Optimize
App Links Assistant: Web associations file support
Baseline Profile installation
Quality Improvements
900+ bugs addressed
Memory errors down by 40%
IntelliJ Platform Update
Latest Java 21 feature support
Run to Cursor inlay option
More 2023.3 features
Getting Started
Ready for next-level Android development? Download Android Studio Jellyfish 🪼 and unlock cutting-edge features today! As always, your feedback is important to us – check known issues, report bugs, suggest improvements, and be part of our vibrant community on LinkedIn, Medium, YouTube, or X. Let's build the future of Android apps together!
Posted by Neville Sicard-Gregory – Senior Product Manager, Android Studio
Today we are launching Android Studio Iguana 🦎 in the stable release channel to make it easier for you to create high quality apps. With features like Version Control System support in App Quality Insights, to the new built-in support to create Baseline Profiles for Jetpack Compose apps, this version should enhance your development workflow as you optimize your app. Download the latest version today!
Check out the list of new features in Android Studio Iguana below, organized by key developer flows.
Debugging
Version control system integration in App Quality Insights
When your release build is several commits behind your local source code, line numbers in Firebase Crashlytics crash reports can easily go stale, making it more difficult to accurately navigate from crash to code when using App Quality Insights. If you’re using git for your version control, there’s now a solution to this problem.
When you build your app using Android Gradle Plugin 8.3 or later and the latest version of the Crashlytics SDK, AGP includes git commit information as part of the build artifact that is published to the Play Store. When a crash occurs, Crashlytics attaches the git information to the report, and Android Studio Iguana uses this information to compare your local checkout with the exact code that caused the crash from your git history.
After you build your app using Android Gradle Plugin 8.3 or higher with the latest Crashlytics SDK, and publish it, new crash reports in the App Quality Insights window let you either navigate to the line of code in your current git checkout or view a diff report between the current checkout and the version of your app codebase that generated the crash report. Learn more.
App Quality Insights with Version Control System Integration
View Crashlytics crash variants in App Quality Insights
Crash variants in App Quality Insights
Today, when you select a Crashlytics issue in App Quality Insights, you see aggregated data from events that share identical points of failure in your code, but may have different root causes. To aid in your analysis of the root causes of a crash, Crashlytics now groups events that share very similar stack traces as issue variants. You can now view events in each variant of a crash report in App Quality Insights by selecting a variant from the dropdown. Alternatively, you can view aggregate information for all variants by selecting All.
Design
Jetpack Compose UI Check
To help developers build adaptive and accessible UI in Jetpack Compose, Iguana introduces a new UI Check mode in Compose Preview. This feature works similarly to visual linting and accessibility checks integrations for views. Activate Compose UI check mode to automatically audit your Compose UI and check for adaptive and accessibility issues across different screen sizes, such as text that's stretched on large screens or low color contrast. The mode highlights issues found in different preview configurations and lists them in the problems panel.
Try it out by clicking the UI Check icon in Compose Preview.
UI Check entry point in Compose Preview
UI Check results of Reply App in Compose Preview
Progressive rendering for Compose Preview
Compose Previews in Android Studio Iguana now implement progressive rendering, allowing you to iterate on your designs with less loading time. This feature automatically lowers the detail of out-of-view previews to boost performance, meaning you can scroll through even the most complex layouts without lag.
Progressive Rendering in Compose
Develop
Intellij Platform Update
Android Studio Iguana includes the IntelliJ 2023.2 platform release, which has many new features such as support for GitLab, text search in Search Everywhere, color customization updates to the new UI and a host of new improvements. Learn more.
Testing
Baseline Profiles module wizard
Many times when you run an Android app for the first time on a device, the app can appear to have a slow start time because the operating system has to run just-in-time compilation. To improve this situation, you can create Baseline Profiles that help Android improve aspects like app start-up time, scrolling, and navigation speed in your apps. We are simplifying the process of setting up a Baseline Profile by offering a new Baseline Profile Generator template in the new module wizard (File > New > New Module). This template configures your project to support Baseline Profiles and employs the latest Baseline Profiles Gradle plugin, which simplifies setup by automating required tasks with a single Gradle command.
Baseline Profile Generator
Furthermore, the template creates a run configuration that enables you to generate a Baseline Profile with a single click from the "Select Run/Debug Configuration" dropdown list.
Generate Baseline Profile drop-down menu
Test against configuration changes with the Espresso Device API
Synchronous testing of window size changes using Espresso Device API
Catch layout problems early and ensure your app delivers a seamless user experience across devices and orientations. The Espresso Device API simulates how your app reacts to configuration changes—such as screen rotation, device folding/unfolding, or window size changes—in a synchronous way on virtual devices. These APIs help you rigorously test and preemptively fix issues that frustrate users so you build more reliable Android apps with confidence. These APIs are built on top of new gRPC endpoints introduced in Android Emulator 34.2, which enables secure bidirectional data streaming and precise sensor simulation.
Pixel 8 and Pixel 8 Pro devices in Android Emulator (34.2)
Test your app on the latest Google Pixel device configurations with the updated Android Virtual Device definitions in Android Studio. With Android Studio Iguana and the latest Android Emulator (34.2+), access the Pixel Fold, Pixel Tablet, Pixel 7a, Pixel 8, and Pixel 8 Pro. Validating your app on these virtual devices is a convenient way to ensure that your app reacts correctly to a variety of screen sizes and device types.
New Pixel Android Virtual Devices in the Android Emulator.
Build
Support for Gradle Version Catalogs
Android Studio Iguana streamlines dependency management with its enhanced support for TOML-based Gradle Version Catalogs. You'll benefit from:
Centralized dependency management: Keep all your project's dependencies organized in a single file for easier editing and updating.
Time-saving features: Enjoy seamless code completion, smart navigation within your code, and the ability to quickly edit project dependencies through the convenient Project Structure dialog.
Increased efficiency: Say goodbye to scattered dependencies and manual version updates. Version catalogs give you a more manageable, efficient development workflow.
New projects will automatically use version catalogs for dependency management. If you have an existing project, consider making the switch to benefit from these workflow improvements. To learn how to update to Gradle version catalogs, see Migrate your build to version catalogs.
Additional SDK insights: policy issues
Android Studio Iguana now proactively alerts you to potential Google Play policy violations through integration with the Google Play SDK Index. Easily see Play policy issues right in your build files and Project Structure Dialog. This streamlines compliance, helping you avoid unexpected publishing delays or rejections on the Google Play Store.
A warning from the Google Play SDK Index in Android Studio’s Project Structure dialog
Android Studio compileSdk version support
Using Android Studio to develop a project that has an unsupported compileSdk version can lead to unexpected errors because older versions of Android Studio may not handle the new Android SDK correctly. To avoid these issues, Android Studio Iguana now explicitly warns you if your project’s intended compileSdk is for a newer version that it does not officially support. If available, it also suggests moving to a version of Android Studio that supports the compileSdk used by your project. Keep in mind that upgrading Android Studio might also require that you upgrade AGP.
Today, we are thrilled to announce the stable release of Android Studio Giraffe 🦒 : The official IDE for building Android apps!
In this Android Studio release, we have upgraded the IntelliJ platform to 2022.3, including a brand new visual look and feel in Android Studio, improvements to Live Edit, Compose animation previews, a new Device Explorer, a new SDK upgrade assistant, ability to use Kotlin DSL in your Gradle build scripts and much more. Read on to learn more about how Android Studio Giraffe 🦒 can help supercharge your developer productivity.
Thank you to all of you who have given us feedback and used Android Studio since we launched our initial version just over 10 years ago. Download the latest stable version today and we look forward to continuing to deliver on our commitment of delivering a best-in-class integrated development environment (IDE) focused on Android app development!
IDE Enhancements
New UI for Android Studio (Preview)
Along with the much anticipated IntelliJ Platform update, we are excited to share a preview of the visual look that we call the “New UI” for Android Studio Giraffe. The redesigned theme aims to reduce visual complexity, provide easier access to essential features, and disclose complex functionality as needed—resulting in a modern, cleaner look and feel.
The New UI was first released as an early preview in IntelliJ 2022.2 to gather feedback from users and other IntelliJ-based IDEs to ensure it could fully replace the previous UI. Since then, it’s progressed to beta in IntelliJ 2022.3, with many bug fixes and improvements.
With the Giraffe release, we’ve started adopting the new UI, with several Android Studio specific changes, such as optimizing the default main toolbar and tool windows configurations for Android and refreshing our iconography in the style. We are excited by this new design direction and will continue adoption through the Hedgehog release and onward.
To use the New UI, enable it in Settings > Appearance & Behavior > New UI. For a full list of changes, see the IntelliJ New UI documentation.
The New UI adopted from IntelliJ
New diagnostic & bug reporting tool
As you try the New UI, please provide us detailed feedback through our new diagnostic & bug reporting tool that makes it easier to report bugs with relevant log files already attached. The new bug reporting tool is found at Help > Collect Logs and Diagnostic Data.
New diagnostic & bug reporting tool
Updated Device Explorer
Also shipping with the new UI, is an updated Device Explorer (known as the Device File Explorer in previous versions of Android Studio). In the Device Explorer, files and related actions are located in the Files tab. Additionally, in the new Processes tab, you can view a list of debuggable processes for the connected device. From there you can also select a process and perform a kill , force-stop, or attach the debugger to a given process.
Updated Device Explorer
Coding Productivity
Use Live Edit to update composables in real time
Live Edit lets you update composables in Android emulators and physical devices in near real time. You can now edit composables and see the UI changes on the running device without re-deploying your app.
This helps you by minimizing the context switching between writing and building your app, letting you focus on writing code longer without interruption. To try Live Edit, enable it via Settings > Editor > Live Edit and use Android Gradle Plugin (AGP) 8.1 or higher and Jetpack Compose Runtime 1.3.0 or higher.
Use Live Edit to update composables in real time
Compose Animation Preview - Extend animation support
Compose Animation Preview now supports a number of additional Compose APIs, such as animate*AsState, CrossFade, rememberInfiniteTransition, and AnimatedContent (in addition to updateTransition and AnimatedVisibility). Additionally, now there are new pickers that let you set non-enum or boolean states to debug your Compose animation using precise inputs. For all supported Compose Animation APIs, you can play, pause, scrub & control speed.
Compose Animation Preview - Extend animation support
Android SDK Upgrade Assistant
The new Android SDK upgrade assistant lets you see the steps required to upgrade the targetSdkVersion, or the API level that your app targets, directly in the IDE. It also pulls upgrade-related documentation directly from the Android Developer site into its tool window, so you don't have to jump back and forth between your browser and the IDE. For each migration step, it highlights the major breaking changes and how to address them, and even filters the full list of changes to only show steps relevant to your app.
To open the Android SDK Upgrade Assistant, go to Tools > Android SDK Upgrade Assistant.
Android SDK Upgrade Assistant
Improvements to the build system
Kotlin DSL in your Gradle build scripts
Kotlin is not only more readable, it also offers better compile-time checking and IDE support. With Android Studio Giraffe, we are excited to offer the official support for Kotlin DSL in your Gradle build scripts. This means that Kotlin is the default language used in your project code, including UI with Jetpack Compose, and now editing the build scripts too!
Now, when you are creating new projects or modules starting from Android Studio Giraffe, you get the Kotlin DSL by default. And if you want to migrate existing builds, check out the Kotlin DSL migration guide.
We've been working with the Gradle and JetBrains teams on this improvement, and you can read more in their related announcements: Gradle Blog; JetBrains Blog.
Additionally, we’ve also added experimental support for TOML-based Gradle Version Catalogs, a feature that lets you manage dependencies in one central location and share dependencies across modules or projects. Android Studio now makes it easier to configure version catalogs through editor suggestions and integrations with the Project Structure dialog, plus the New Project Wizard.
Kotlin DSL in your Gradle build scripts
Download info during Gradle sync
If you’ve ever wondered if any unexpected dependency downloads are negatively impacting your sync performance, the new Sync tool window now includes a summary of time spent downloading dependencies, and a detailed view of downloads per repository. This view updates live as sync takes place. It can even help you identify inefficiencies in how you configure your repositories.
Download info during Gradle sync
Automatic per-app language support
Typically, multilingual users set their system language to one language—such as English—but they want to select other languages for specific apps, such as Dutch, Chinese, or Hindi. Android 13 introduced support for per-app language preferences, and now Android Gradle plugin 8.1 and higher can configure your app to support it automatically based on your project’s resources. Learn more.
Make selected modules toolbar button
With Android Studio Giraffe, you can now build only the current module you're working on by selecting the Make Selected Modules build option in the toolbar. This new option lets you check that the code you just wrote compiles without building more than needed. Learn more.
Kotlin DSL in your Gradle build scripts
Summary
To recap, Android Studio Giraffe includes these new enhancements and features. You can always learn more with our detailed release notes.
IDE Enhancements
Upgraded to IntelliJ Platform 2022.3: Includes a number of features and bug fixes
New UI for Android Studio : Android Studio now adopts a number of improvements from the IntelliJ's modern design language
Updated Device Explorer : Offers two new tabs : Files & Processes from where you can view a list of debuggable processes, perform a kill, force-stop, or attach the debugger
New diagnostic & bug reporting tool : Easier to report bugs for Android Studio with relevant log files already attached
Coding Productivity
Use Live Edit to update composables in real time : Update composables in real time, edit composables and see the UI changes on the running device without re-deploying your app
Compose Animation Preview - Extend animation support : Now supports a number of additional Compose APIs and new pickers that let you set non-enum or boolean states to debug your Compose animation using precise inputs
Android SDK Upgrade Assistant : Now lets you see the steps required to upgrade the targetSdkVersion, or the API level that your app targets directly in Studio
Improvements to the build system
Kotlin DSL in your Gradle build scripts : With official support for Kotlin DSL in your Gradle build scripts, Kotlin is now the single default language for project code, UI with Jetpack Compose, and now for build scripts
Download info during Gradle sync : Shows a summary of time spent downloading dependencies and a detailed view of downloads per repository
Automatic per-app language support : AGP can now automatically configure per-app language preferences
Make selected modules toolbar button : build only the current module you're working on by selecting the Make Selected Modules build option in the toolbar
Download Android Studio Today!
Now is the time to download Android Studio Giraffe 🦒 to incorporate the new features into your workflow. As always, we appreciate any feedback on things you like and issues or features you would like to see. If you find a bug or issue, please file an issue and also check out known issues. Remember to also follow us on Twitter, Medium, or YouTube for more Android development updates!
Posted by Adarsh Fernando, Senior Product Manager, Android Studio
We first announced Android Studio at I/O 2013 with a promise to deliver a best-in-class integrated development environment (IDE) focused on Android app developers. 10 years later, this commitment to developer productivity still drives the team to deliver new tools and solutions that help teams around the world to create amazing app experiences for their users. And with Google's push to unlock the power of AI to help you throughout your day, Android Studio Hedgehog introduces a key breakthrough: an AI-powered conversational experience designed to make you more productive.
In addition to accelerating coding productivity, this latest version of the IDE provides better tools when you develop for multiple form factors, and helps you improve app quality with new insights, debugging, and testing solutions. All these improvements add to the many updates we’ve included in Android Studio Giraffe, which is now in the Beta channel and helps make it easier to configure your builds with Kotlin DSL support, improve sync times with new data and guidance, target the latest Android SDK version with the new Android SDK Upgrade Assistant, and more.
To see highlights of the new features in action including Studio Bot, watch the What’s new in Android Developer Tools session from Google I/O 2023.
What’s new in Android Development Tools - with Studio Bot Demo
At the heart of our mission is to accelerate your ability to write high-quality code for Android. In this release we are excited to introduce an AI-powered conversational experience called Studio Bot, that leverages Codey, Google's foundation model for coding that is a descendant of PaLM 2, to help you generate code for your app and make you more productive. You can also ask questions to learn more about Android development or help fix errors in your existing code — all without ever having to leave Android Studio. Studio Bot is in its very early days, and we’re training it to become even better at answering your questions and helping you learn best practices. We encourage you to try it out for yourselves, and help it improve by sharing your feedback directly with Studio Bot.
Privacy is top of mind, and what is unique in this integration is that you don’t need to send your source code to Google to use Studio Bot—only the chat dialogue between you and Studio Bot is shared. Much like our work on other AI projects, we stick to a set of principles that hold us accountable. We’re taking a measured approach to our rollout; for this initial launch, Studio Bot is only available to Android developers in the US. You can read more here
Studio Bot
Live Edit
Live Edit helps keep you in the flow by minimizing interruptions when you make updates to your Compose UI and validates those changes on a running device. You can use it in manual mode to control when the running app should be updated or in automatic mode to update the running app as you make code changes. Live Edit is available in Android Studio Giraffe Beta, with the Hedgehog release providing additional improvements in error handling and reporting.
Live Edit with Compose
Build productivity
Kotlin DSL and Version Catalogs
A number of updates help you leverage more modern syntax and conventions when configuring your build. Kotlin is the recommended language when developing for Android. Now, with official support for Kotlin DSL in your Gradle build scripts, it’s also the preferred way to configure your build because Kotlin is more readable and offers better compile-time checking and IDE support. Additionally, we’ve also added experimental support for TOML-based Gradle Version Catalogs, a feature that lets you manage dependencies in one central location and share dependencies across modules or projects. Android Studio now makes it easier to configure version catalogs through editor suggestions and integrations with the Project Structure dialog, plus the New Project Wizard.
Kotlin DSL and Version Catalogs in the New Project Wizard
Per-app language preferences
Typically, multilingual users set their system language to one language—such as English—but they want to select other languages for specific apps, such as Dutch, Chinese, or Hindi. Android 13 introduced support for per-app language preferences, and now Android Gradle plugin 8.1 and higher can configure your app to support it automatically. Learn more.
Download impact during Sync
When using Android Gradle Plugin 7.3 or higher, The Build > Sync tool window now includes a summary of time spent downloading dependencies and a detailed view of downloads per repository, so you can easily determine whether unexpected downloads are impacting build performance. Additionally, it can help you identify inefficiencies in how you configure your repositories. Learn more.
Build Analyzer showing impact of downloads during build
New Android SDK Upgrade Assistant
Android Studio Giraffe introduces the Android SDK Upgrade Assistant, a new tool that helps you upgrade the targetSdkVersion, which is the API level that your app targets. Instead of having to navigate every API change with an Android SDK release, the Android SDK Upgrade Assistant guides you through upgrading targetSdkVersion level by level by creating a customized filter of API changes that are relevant to your app. For each migration step, it highlights the major breaking changes and how to address them, helping you get to taking advantage of what the latest versions of Android have to offer much more quickly. To open the Android SDK Upgrade Assistant, go to Tools > Android SDK Upgrade Assistant. In the Assistant panel, select the API level that you want to upgrade to for guidance.
Upgrade more quickly with the Android SDK Upgrade Assistant
Developing for form factors
Google Pixel Fold and Tablet Virtual Devices
Although these devices won’t launch until later this year, you can start preparing your app to take full advantage of the expanded screen sizes and functionality of these devices by creating virtual devices using new Google Pixel Fold and Google Pixel Tablet device profiles in Android Studio Hedgehog. To start, open Device Manager and select Create Device.
Pixel Tablet running on the Android Emulator
Emulator Support for Wear OS 4 Developer Preview
Wear OS 4 is the next generation OS for Wear. Based on Android 13, it officially launches in the fall and has a great selection of new features and optimizations. We’re giving you a preview of all the new platform features with the new Wear OS 4 emulator. We recommend you try it with Android Studio Hedgehog and test that your Wear OS app works as intended with the latest platform updates. The Wear OS 4 emulator will give you a faster and smoother transition to Wear OS 4, and help you make apps ready in time for the official Wear OS 4 release on real devices. Check out the Wear 4 Preview site for how to get started with the new Wear OS 4 emulator.
Watch Face Format support in Wear OS 4 Emulator
Together with Samsung, we’re excited to announce the launch of the Watch Face Format, a new way to build watch faces for Wear OS. The Watch Face Format is a declarative XML format, meaning there will be no code in your watch face APK. The platform takes care of the logic needed to render the watch face so you no longer have to worry about code optimizations or battery performance. Use watch face creation tools such as Watch Face Studio to design watch faces, or you can manually or dynamically edit the watch face format to build watch faces directly. You can test the new Watch Face Format on the Wear OS 4 emulator.
Watch Face Format Watchface on Wear 4 Emulator
Device Mirroring for local devices
Whether you use a direct USB connection or ADB over Wi-Fi, Device Mirroring lets you see and interact with your local physical devices directly within the Android Studio Running Devices window. This feature lets you focus on how you develop and test your app all in one place. With the Hedgehog release, we’re adding more functionality, including the ability to mirror Wear OS devices and simulate folding actions on foldable devices directly from the IDE.
Device Mirroring with the Pixel Fold
Android Device Streaming
We know sometimes it’s critical for you to see and test how your apps work on physical hardware to ensure that your users have the best experience. However, accessing the latest flagship devices isn’t always easy. Building on top of Device Mirroring for local devices, we’re introducing device streaming of remote physical Google Pixel devices, such as the Pixel Fold and Pixel Tablet, directly within Android Studio. Device streaming will let you deploy your app to these remote devices and interact with them, all without having to leave the IDE. If you’re interested in getting early access later this year, enroll now.
Espresso Device API
Automated testing of your app using Espresso APIs helps you catch potential issues early, before they reach users. However, testing your app across configuration changes, such as rotating or folding a device, has always been a challenge. Espresso Device API is now available to help you write tests that perform synchronous configuration changes when testing on Android virtual devices running API level 24 and higher. You can also set up test filters to ensure that tests that require certain device features, such as a folding action, only run on devices that support them. Learn more.
Synchronous device configuration changes using the Espresso Device API
Improve your app quality
App Quality Insights with Android vitals
App Quality Insights launched in Android Studio Electric Eel to provide access to Firebase Crashlytics issue reports directly from the IDE. The integration lets you navigate between your stack trace and code with a click, use filters to see only the most important issues, and see report details to help you reproduce issues. In Android Studio Hedgehog, you can now view important crash reports from Android vitals, powered by Google Play. Android vitals reports also include useful insights, such as notes from SDK providers so that you can quickly diagnose and resolve crashes related to SDKs your app might be using.
Android vitals crash reports in the App Quality Insights window
App Quality Insights with improved code navigation
When you publish your app using the latest version of AGP 8.2, crash reports now attach minimal git commit hash data to help Android Studio navigate to your code when investigating Crashlytics crash reports in the IDE. Now, when you view a report that includes the necessary metadata, you can choose to either navigate to the line of code in your current git checkout, or view a diff between the checkout and the version of your codebase that generated the crash. To get started with the right dependencies, see the documentation.
Compose State information in Debugger
When parts of your Compose UI recompose unexpectedly, it can sometimes be difficult to understand why. Now, when setting a breakpoint on a Composable function, the debugger lists the parameters of the composable and their state, so you can more easily identify what changes might have caused the recomposition. For example, when you pause on a composable, the debugger can tell you exactly which parameters have “Changed” or have remained “Unchanged”, so you can more efficiently investigate the cause of the recomposition.
Compose state information in the debugger
New Power Profiler
We are excited to announce a brand new Power Profiler in Android Studio Hedgehog, which shows power consumption on the Pixel 6 and higher devices running Android 10 and higher. Data is segmented by each sub-system (such as, Camera, GPS, and more). This data is made available when recording a System Trace via the Profiler and helps you to visually correlate power consumption of the device to the actions happening in your app. For example, you can A/B test multiple algorithms of your video calling app to optimize power consumed by the camera sensor.
The new Power Profiler
Device Explorer
The Device File Explorer in Giraffe has been renamed to Device Explorer and updated to include information about debuggable processes running on connected devices. In addition to the Files tab, which includes existing functionality that allows you to explore a device’s file hierarchy, the new Processes tab allows you to view a list of debuggable processes for the connected device. From there you can also select a process and perform a Kill process action (which runs am kill), a Force stop (which runs am force-stop) , or attach the debugger to a selected process.
Processes tab in the Device Explorer window
Compose animation preview
Compose Animation Preview in Android Studio Hedgehog now supports a number of additional Compose APIs, animate*AsState, CrossFade, rememberInfiniteTransition, and AnimatedContent (in addition to updateTransition and AnimatedVisibility). Compose Animation Preview also has new pickers that let you set non-enum or boolean states to debug your Compose animation using precise inputs. For all supported Compose Animation APIs, you can play, pause, scrub, control speed, and coordinate.
Compose Animation Preview
Embedded Layout Inspector
You can now run Layout Inspector directly embedded in the Running Device Window in Android Studio! Try out this feature today in Android Studio Hedgehog to conserve screen real estate and organize your UI debugging workflow in a single tool window. You can access common Layout Inspector features such as debugging the layout of your app by showing a view hierarchy and allowing you to inspect the properties of each view. Additionally, because the embedded Layout Inspector overlays on top of the existing device mirroring stream, overall performance when using the inspector is now much faster. To get started and understand known limitations, read the release notes.
Embedded Layout Inspector
Firebase Test Lab support for Gradle Managed Devices
Gradle Managed Devices launched in Android Gradle Plugin (AGP) 7.3 to make it easier to utilize virtual devices when running automated tests in your continuous integration (CI) infrastructure by allowing Gradle to manage all aspects of device provisioning. All you need to do is use the AGP DSL to describe the devices you wanted Gradle to use. But sometimes you need to run your tests on physical Android devices. With AGP 8.2, we have expanded Gradle Managed Devices with the ability to target real physical (and virtual) devices running in Firebase Test Lab (FTL). The capability makes it easier than ever to scalably test across the large selection of FTL devices with only a few simple steps. Additionally, this version of AGP can also take advantage of FTL’s new Smart Sharding capabilities, which allows you to get test results back much more quickly by utilizing multiple devices that run in parallel. To learn more and get started, read the release notes.
Gradle Managed Devices with support for Firebase Test Lab
IntelliJ
IntelliJ Platform Update
Android Studio Hedgehog (2023.1) includes the IntelliJ 2023.1 platform release, which comes with IDE startup performance improvements, faster import of Maven projects, and a more streamlined commit process. Read the IntelliJ release notes here.
New UI
Along with the IntelliJ platform update comes further improvements to the New UI. In large part due to community feedback, there’s a new Compact Mode, which provides a more consolidated look and feel of the IDE, and an option to vertically split the tool window area and conveniently arrange the windows, just like in the old UI. We also improved the Android-specific UI by updating the main toolbar, tool windows, and new iconography. To use the New UI, enable it in Settings > Appearance & Behavior > New UI. For a full list of changes, see the IntelliJ New UI documentation.
The New UI adopted from IntelliJ
Summary
To recap, Android Studio Giraffe is available in the Beta channel. Android Studio Hedgehog is the latest version of the IDE and is available in the Canary channel, and includes all of these new enhancements and features:
Coding productivity
Android Studio Bot, is a tightly integrated, AI-powered assistant in Android Studio designed to make you more productive.
(Beta) Live Edit, which helps keep you in the flow by minimizing interruptions when you make updates to your Compose UI and validate those changes on a running device.
Build productivity
(Beta) Kotlin DSL and Version Catalogs, which helps you take advantage of more modern syntax and conventions when configuring your build.
(Beta) Per-app language preferences, built-in support in AGP for automatically configuring per-app language preferences.
(Beta) Download impact in Build Analyzer, which provides a summary of time spent downloading dependencies and a detailed view of downloads per repository, so you can easily determine whether unexpected downloads are impacting build performance.
(Beta) New Android SDK Upgrade Assistant, which helps you upgrade the targetSdkVersion, which is the API level that your app targets, much more quickly.
Developing for form factors
Google Pixel Fold and Google Pixel Tablet Virtual Devices, which can help you start preparing your app to take full advantage of the expanded screen sizes and functionality of these devices before they are available in stores.
Wear OS 4 Developer Preview Emulator, which similarly provides you early access to test and optimize your app against the next generation of Wear OS by Google.
Watch Face Format support in Wear OS 4 Developer Preview Emulator, a new way to build watch faces for Wear OS.
Device Mirroring for local devices, which lets you see and interact with your local physical devices directly within Android Studio’s Running Devices window.
Android Device Streaming, a device streaming of remote physical Google Pixel devices, which you can register for early access today!
Espresso Device API, which helps you write tests that perform synchronous configuration changes when testing on Android virtual devices running API level 24 and higher.
Improve your app quality
App Quality Insights: Android vitals, which now lets your view, filter, and navigate important crash reports from Android vitals, powered by Google Play.
App Quality Insights with improved code navigation, which lets you now choose to either navigate to the line of code in your current git checkout, or view a diff between the checkout and the version of your codebase that generated the crash.
Compose State information in Debugger, which lists the parameters of the composable and their state when paused on a breakpoint in a composable, so you can more easily identify what changes might have caused the recomposition.
New Power Profiler, which shows highly accurate power consumption from the device segmented by each sub-system.
(Beta) Device Explorer, which now includes information about debuggable processes running on connected devices and actions you can perform on them.
(Beta) Compose animation preview, now supports a number of additional Compose APIs and new pickers that let you set non-enum or boolean states to debug your Compose animation using precise inputs.
Embedded Layout Inspector, which runs Layout Inspector directly embedded in the Running Device Window in Android Studio, leading to a more seamless debugging experience and significant performance improvements.
Firebase Test Lab support for Gradle Managed Devices, which leverages GMD to help you seamlessly configure Firebase Test Lab devices for your automated testing, and now with additional support for smart sharding.
IntelliJ
IntelliJ Platform Update to the IntelliJ 2023.1 platform release, which includes a number of performance and quality of life improvements.
New UI update that allows Android Studio to adopt a number of improvements to IntilliJ’s modern design language.
You can download Android Studio Hedgehog Canary or Android Studio Giraffe Beta today to incorporate the new features into your workflow. You can install them side by side with a stable version of Android Studio by following these instructions. The Beta release is near stable release quality, but bugs might still exist, and Canary features are leading edge features. As always, we appreciate any feedback on things you like or features you would like to see. If you find a bug, please report the issue and also check out known issues. Remember to also follow us on Twitter, Medium, or YouTube for more Android development updates!
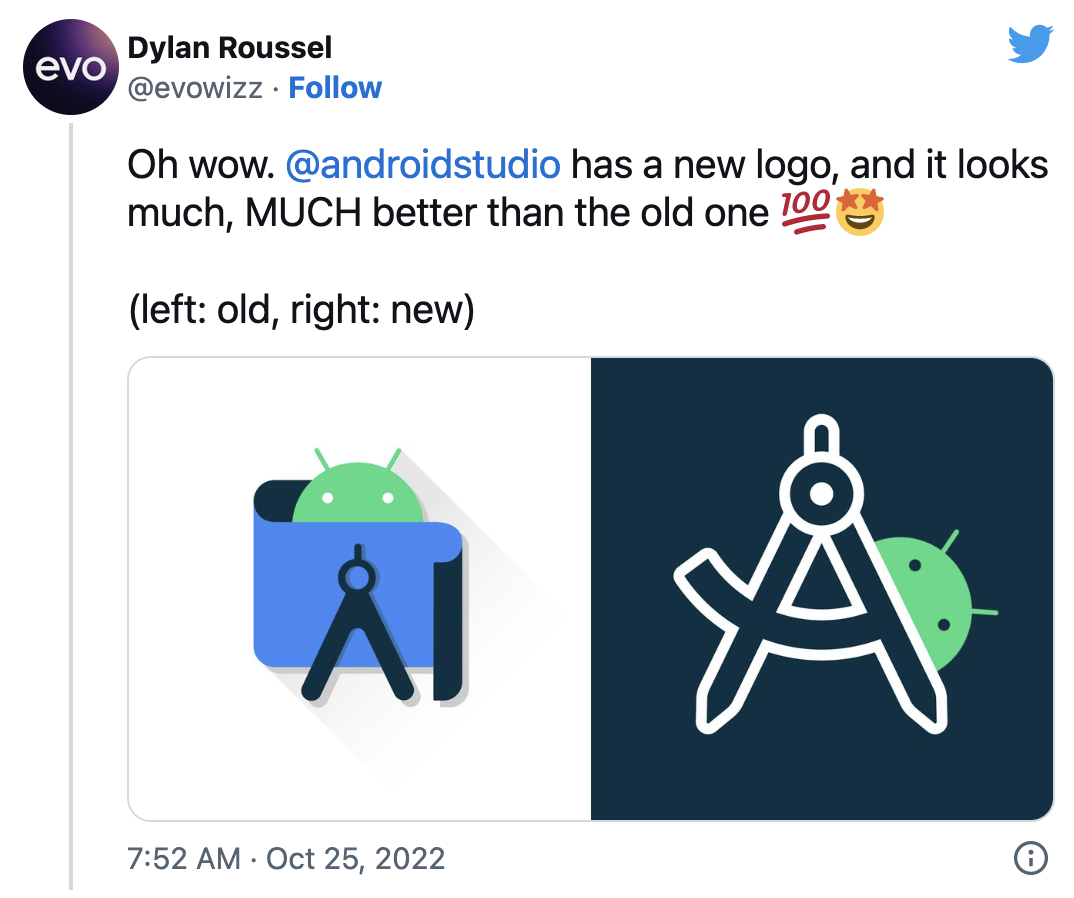
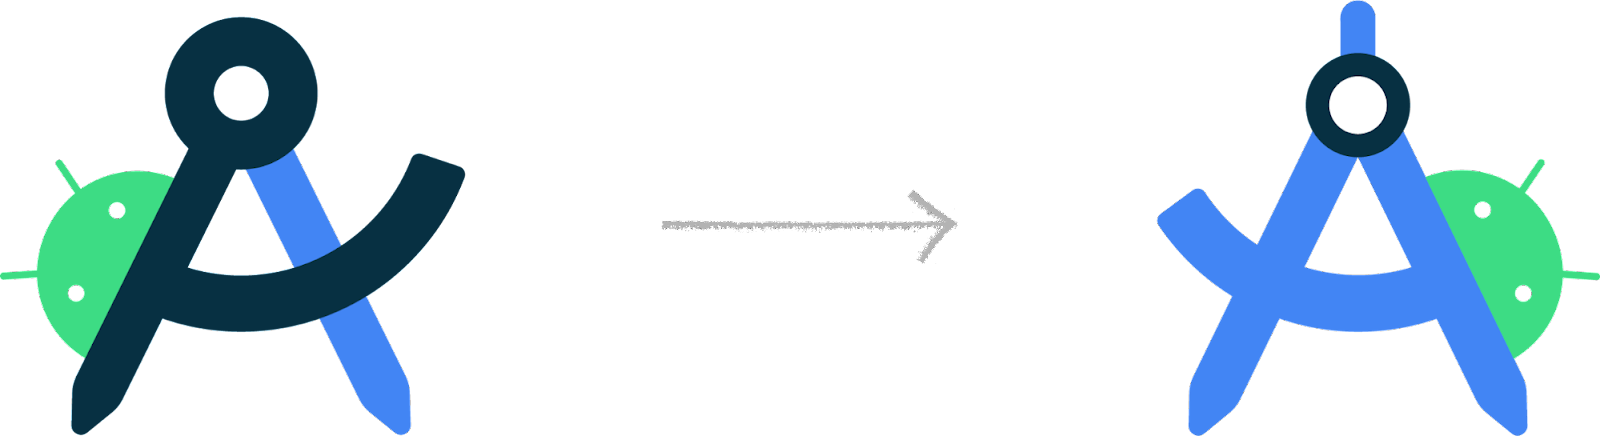
The Android Studio logo redesign caught the attention of the developer community since its sneak peek at the Android Developer Summit ‘22. We are thrilled to release the new Android Studio logo with the stable release of Flamingo. Now that the new logo is available to most Android Studio users, we can examine the design changes in greater detail and decode their meaning.
This case study offers a comprehensive overview of the design journey, from identifying the initial problem to the final outcome. It explores the critical brand elements that the team needed to consider and the tools used throughout the redesign process. This case study also delves into the various stages of design exploration, highlighting the efforts to create a modern logo while honoring the Android Studio brand's legacy.
You told us the Android Studio logo looked a little weird and complicated. It doesn't shrink down well and it's way too similar to the emulator. We heard you!
With Android Studio’s new Logo, it seems like the studio team gave high consideration to Android Launcher Icon guidelines with no regards for how it looks on a Windows Machine Taskbar” tweet by @theretroportal Oct 22, 2020
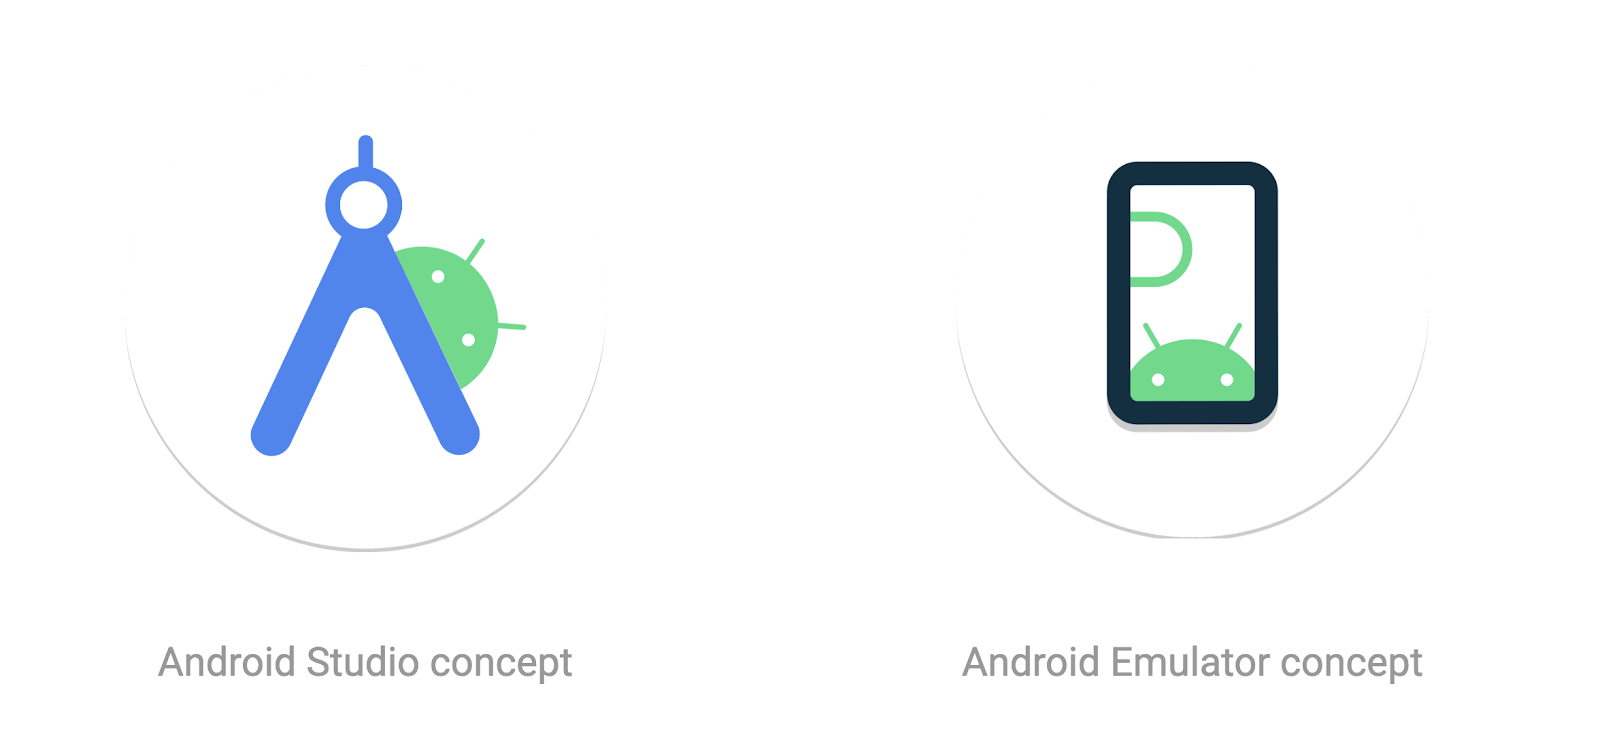
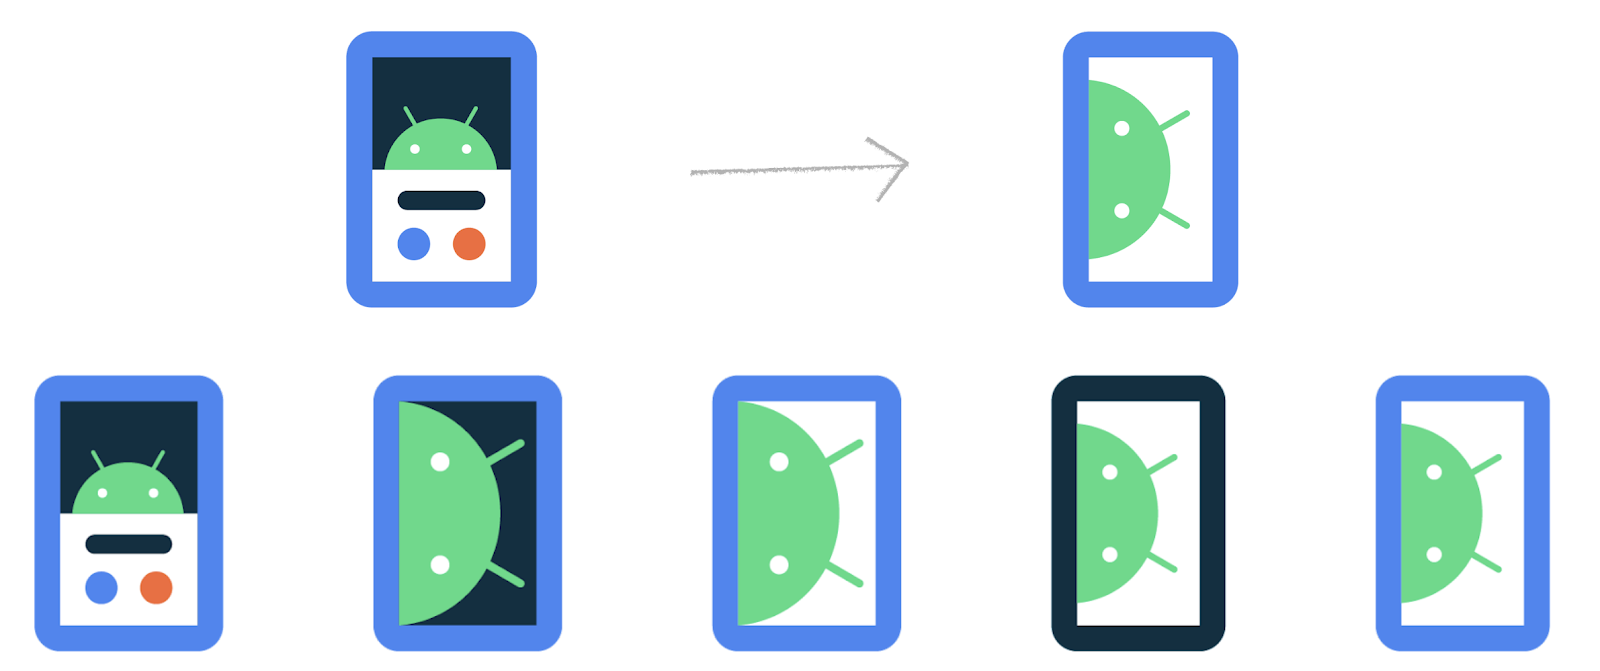
The Android Studio logo used between 2020 and 2022 was well-suited for print, but it posed challenges when used as an application icon. Its readability suffered when reduced to smaller sizes, and its similarity to the emulator caused confusion.
2020 - 2022 Android Studio Stable scalability issues
Additionally, the use of color alone to differentiate between Canary and Stable versions made it difficult for users with color vision deficiencies.
The redesign aimed to resolve these concerns by creating a logo that was easy to read, visually distinctive, and followed the OS guidelines when necessary, ensuring accessibility. The new design also maintained a connection with the Android logo family while honoring its legacy.
Android Developer Logo Family
In this case study, we will delve into the version history and evolution of the Android Studio logo and how it has changed over the years.
A brief history of the Android Studio logo
2013: The original Android Studio logo was a 3D robot that highlighted the gears and interworking of the bugdroid. At this time, the Android Emulator was the bugdroid.
2014: The Android Emulator merged to a flat mark but remained otherwise unchanged.
2014-2019: An updated Android Studio logo was introduced featuring an "A" compass in front of a green circle.
2019: In Canary 3.6, the color palette was updated to match Android 10.
2020-2022: With the release of Android Studio 4.1 Canary, the "A" compass was reduced to an abstract form placed in front of a blueprint. The Android head was also added, peeking over the top.
A timeline of Android Studio & Emulator design evolution
Understanding the Android brand elements
When redesigning a logo, it's important to consider brand elements that unify products within an ecosystem. For the Android Developer ecosystem, the “robot head” is a key brand element, alongside the primaryAndroid green color. The secondary colors blue and navy, and tertiary colors like orange, can also be utilized for support.
Android brand color palette
Key objectives
Iconography: use recognizable and appropriate symbols, such as compass "A" for Android Studio or a device for Android Emulator, to convey the purpose and functionality clearly and quickly.
Enhance recognition and scalability: the Android Studio and Android Emulator should prioritize legibility and scalability, ensuring that they can be easily recognized and understood even at smaller sizes.
Establish distinction: the Android Studio and Android Emulator need to be easily distinguishable, to avoid confusion.
Maintain brand consistency: the Android Studio and Android Emulator designs should be consistent with the overall branding and visual identity of the Android family, while still being distinctive.
Ensure accessibility: the logo should be accessible to all users, including those with visual impairments. This means using clear shapes, colors, and contrast.
Follow OS guidelines: the updated application icon must align with the Android visual language and conform to the guidelines of macOS, Windows, and Linux operating systems, ensuring consistency and coherence across all platforms.
Ensure versatility: the Android Studio logo should be versatile enough to work in a variety of sizes and contexts, such as on different devices and platforms.
The tools
Paper, pencil and pen sketching, markers, Adobe Illustrator and Figma.
Design exploration: how it started
It all started as a simple brief: redesign the Android Studio logo. We initiated our creative process by brainstorming objects and concepts that evoke a sense of software development - such as pencils, rulers, building blocks, construction sites, tape measures, compasses, and protractors.
Logo exploration and sketches: pencils, rulers and compass
Logo exploration and sketches: blueprint, rulers and Android head
We experimented with replacing the drawing compass with a ruler and tried various combinations of design elements. We even explored the idea of incorporating bricks, similar to building blocks, and playfully stacked the Android head, a ruler, and a pencil together, with a nod to the terminal prompt symbol '>'.
Logo exploration with building blocks and a ‘play on terminal’
During the logo exploration phase, we examined different approaches to incorporating an "A" for Android into the design. One concept highlighted the precision of Android development tools through an "A" ruler, while another featured the original "A" compass from 2014.
Once we had generated a variety of logo concepts through sketching, we then proceeded to add the Android color palette to our designs. This was an important step to ensure that our new logo would not only stand out on its own but also maintain a strong visual connection with the wider Android Developer family branding.
Android Studio logo exploration with an “A” ruler
Android Studio logo exploration with a “A” compass
To ensure clear differentiation between the redesigned Emulator and Android Studio, we explored the option of removing elements and reversing the colors of both marks, which would simplify their overall design and make them easier to recognize at a glance.
Android Studio & Android Emulator exploration
We aimed to enhance the distinctiveness, scalability, and iconography by carefully analyzing various design elements such as line weight, corner radius, and the placement of the Android head, to create a visually strong mark. We further simplified the design by eliminating all shadow effects and reorienting the emulator phone to an upright position, which improved recognition, scalability, and scannability. This heightened the visual differentiation between the two marks, making them more recognizable and visually distinct.
Android Emulator exploration
Design exploration: how it ended
The redesigned Android Studio logo is a fresh take on the original design, featuring the Android head and the iconic A compass. The team initially considered keeping the simplified A used in the 2020- 2022, but ultimately decided that the simplified A was not strong enough of a mark to be the central symbol of the Android Studio brand. The compass's handle and hinge have been reintroduced, while the legs of the compass have been sharpened to points, reflecting the meticulousness and precision that developers bring to their craft. Additionally, the adjustment angle radius has been reinstated, creating the crossbar necessary to form the letter A.
Inclusive design: improved accessibility and scalability
Accessible: the logo uses secondary encoding with an outlined A for Canary and a solid A for Stable in addition to color. This makes it easier for users with color vision deficiencies to distinguish between the two application icons.
Minimal and scalable: the blueprint drawing in the 2020 - 2022 was removed to create a minimalist design that is scalable and legible at smaller sizes. This makes it easier for low vision users to see.
Ensuring recognition: the new logo's central focus is the A compass, which incorporates elements from the original compass mark. This helps ensure that the application icon is recognizable to users, even at small sizes.
The unique shapes: squircle and 13-pointed bottle cap
The Android Studio application icon consists of two unique shapes: a squircle, a square with slightly rounded corners commonly used in macOS applications, and a 13-pointed bottle cap, which is a shape derived from the Modern Android design system. Besides reflecting the design system, the 13-pointed bottle cap also serves as a delightful Easter egg 🥚, with 13 points specifically included to coincide with Android 13's release. These two background shapes are used on desktop to adhere to OS guidelines, and to ensure that the application icon is legible and recognizable in both dark and light mode.
Android Studio has two application icons - one for the Canary version and one for the Stable release. The Canary application icon is a white outline on a dark blue background, representing a blueprint or prototype. The Android Studio Preview (Canary) version enables developers to experiment with new features that are still in development. The white outline of the A compass in Canary indicates that the features are not yet finalized and may change.
From 2014 to 2022, the Android Studio application icons featured different background colors, with yellow representing Canary and green (2014 - 2019) and white (2020-2022) representing Stable releases. However, the most recent redesign takes accessibility to a new level by going beyond the use of background colors alone to differentiate between Canary and Stable. The new design employs a secondary encoding method, featuring an outlined A for Canary and a solid A for Stable, in addition to color, to effectively convey meaning and make the application icons more accessible for users with color vision deficiencies.
The new Android Studio application icons also embody the spirit of software development, highlighting the transformation from a blueprint/prototype (Canary) to a fully designed and polished product (Stable). Drawing inspiration from the design language of the Canary and Stable Splash Screens, the Android Studio Canary and Stable icons visually reinforce the progression of the developer's journey from the blueprint and ideation stages to execution.
A modern Android Studio & Emulator logo that honors its legacy
The new Android Studio logo illustrates how a brand can evolve through simplification, improve clarity and recognition while honoring its legacy. By keeping the A compass as a reference to the 2014 logo, the team created a modern design that represents the evolution of the Android Studio platform. This minimalist design is easily recognizable and aligns with the rest of the Android Developer branding.
It is a good time to download the latest stable version of Android Studio to see the new icon. As always, we appreciate any feedback on things you like and issues or features you would like to see. If you find a bug or issue, please file an issue and also check out known-issues. Remember to also follow us on Twitter, Medium, or YouTube for more Android Development updates!


 Posted by


 Posted by Grant Yang (Product Manager for OmniLab) & Adarsh Fernando (Product Manager for Android Studio)


 Posted by
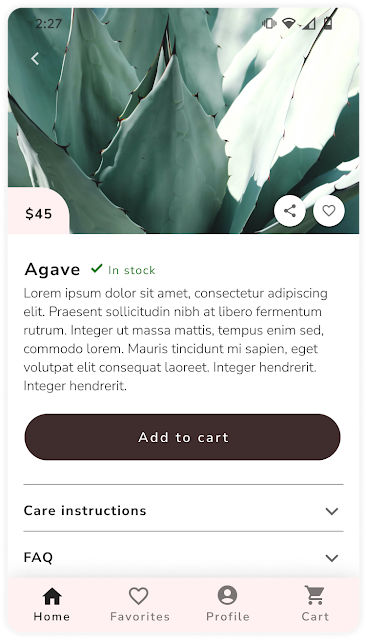
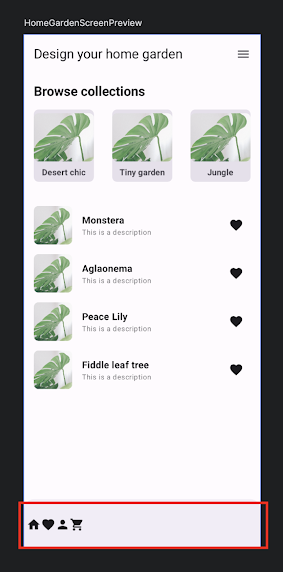
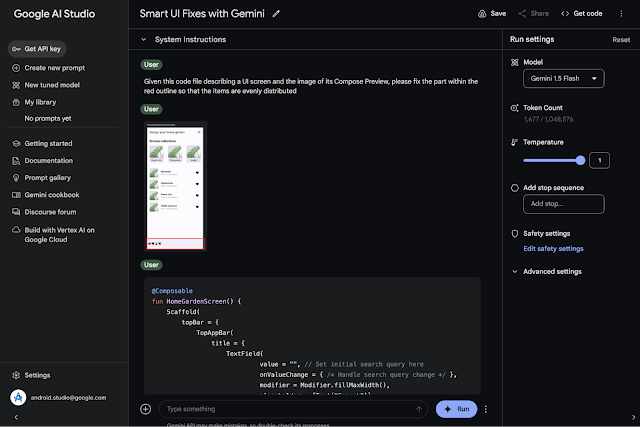
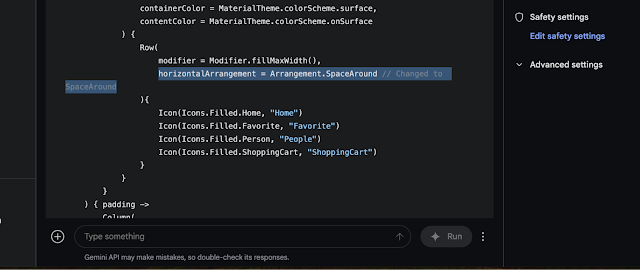

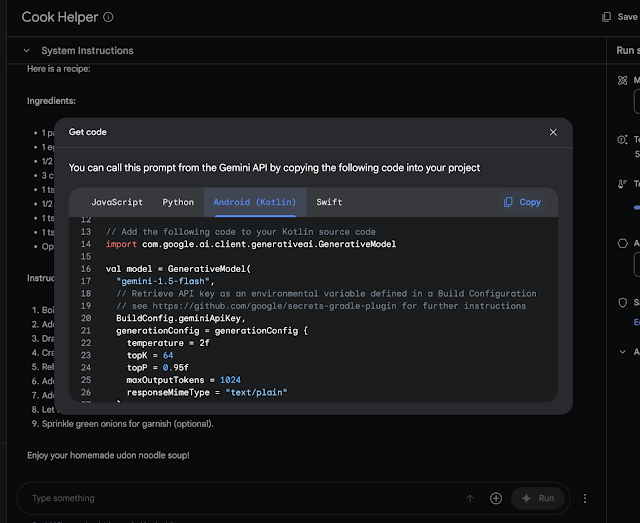
 Posted by Adarsh Fernando, Senior Product Manager, Android Studio
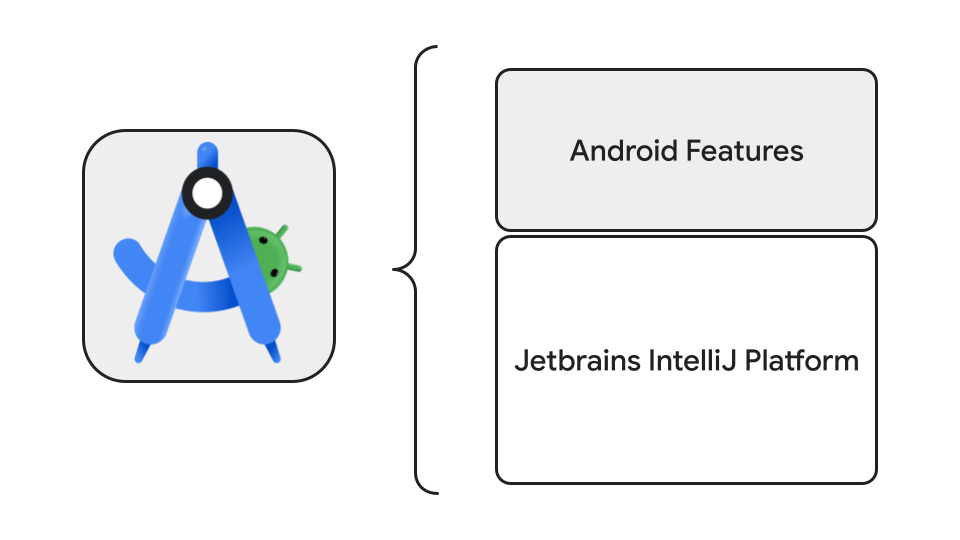

 Posted by


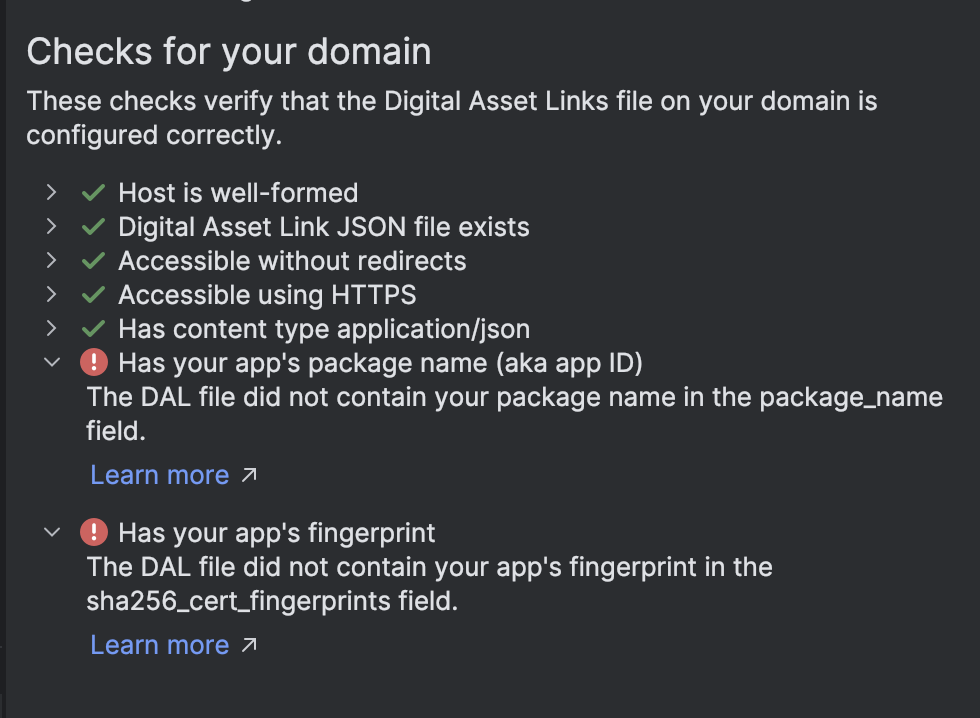
 Posted by Neville Sicard-Gregory – Senior Product Manager, Android Studio
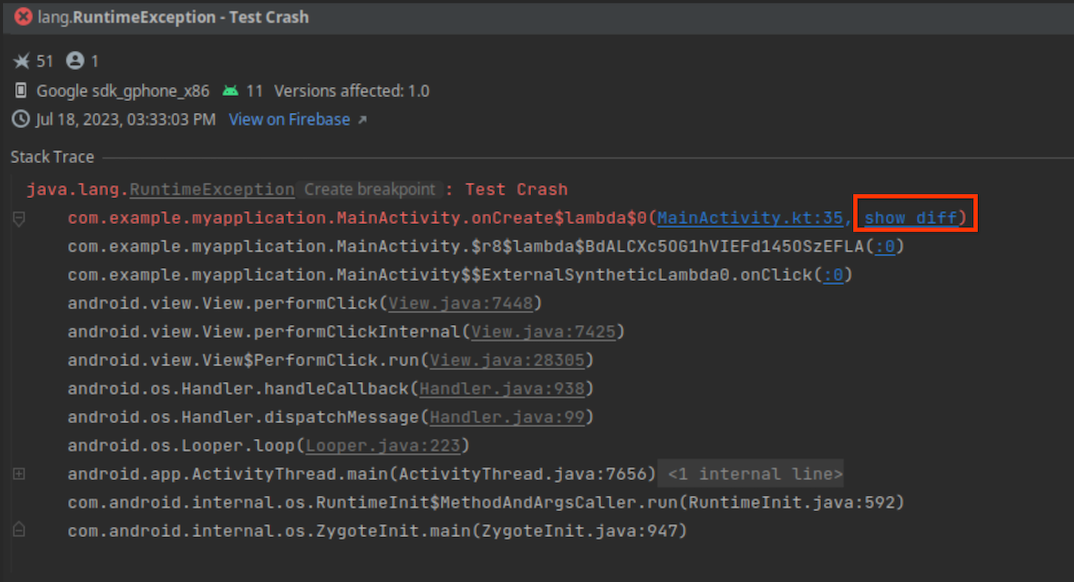
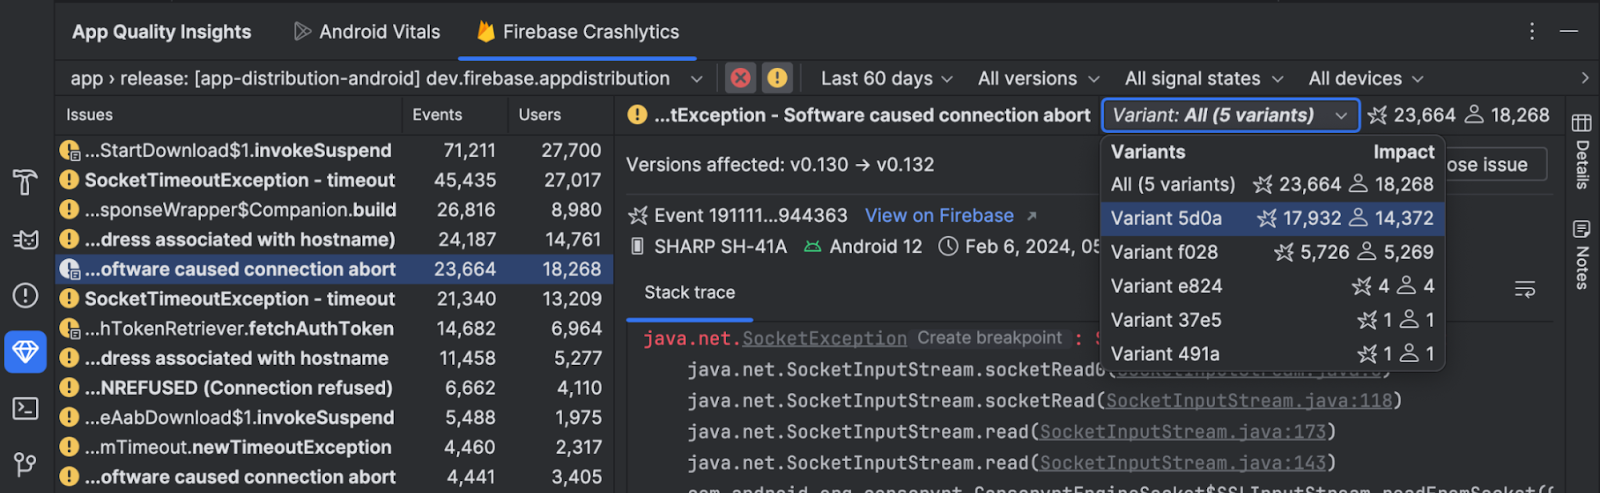
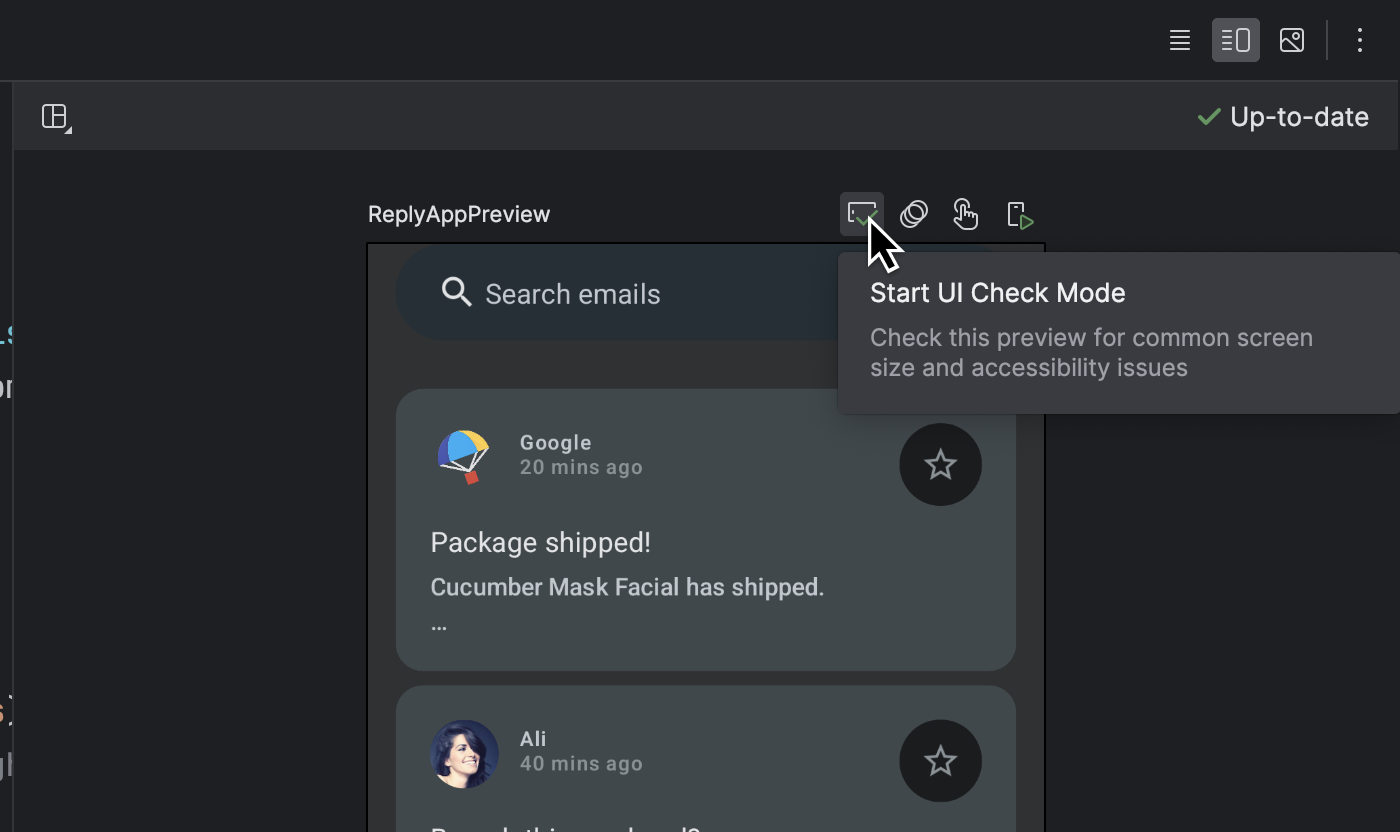


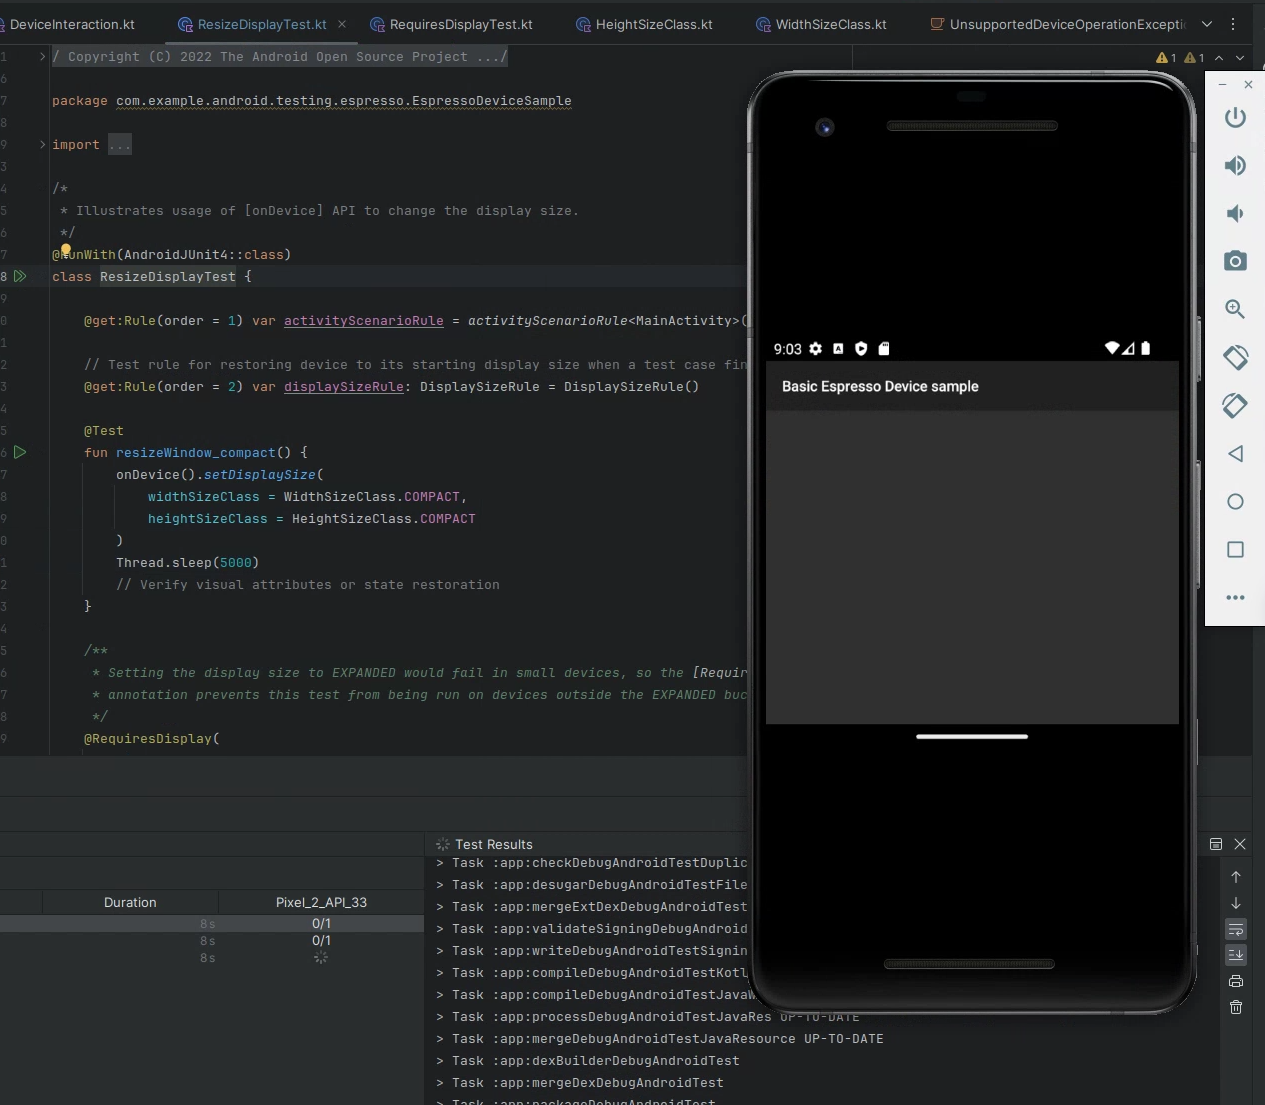
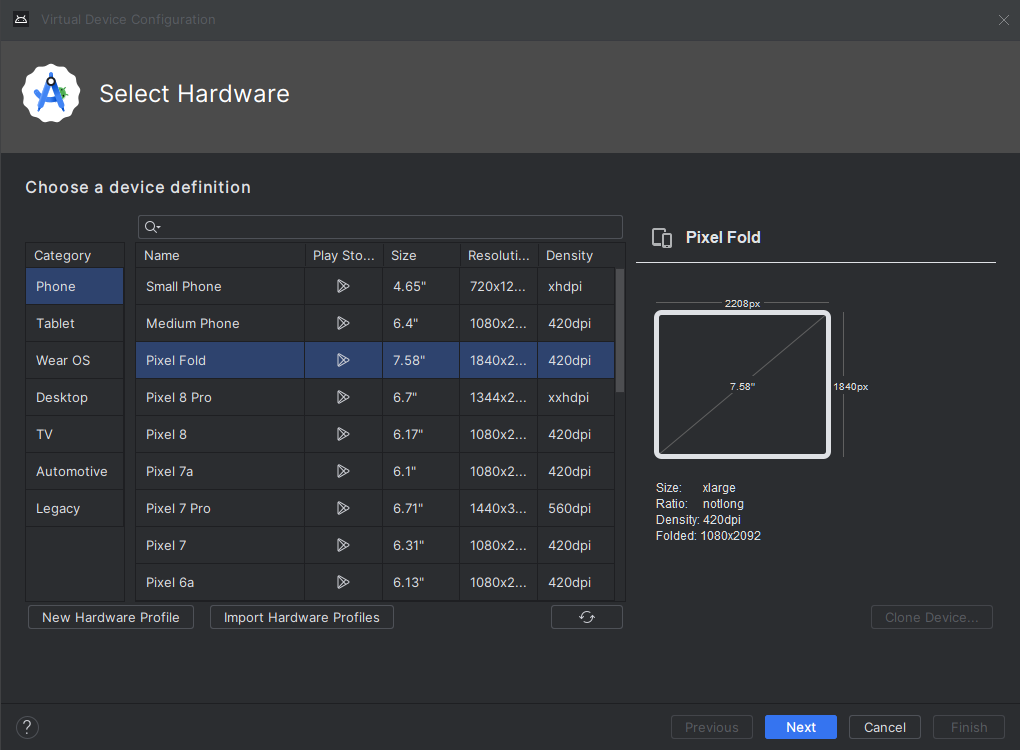
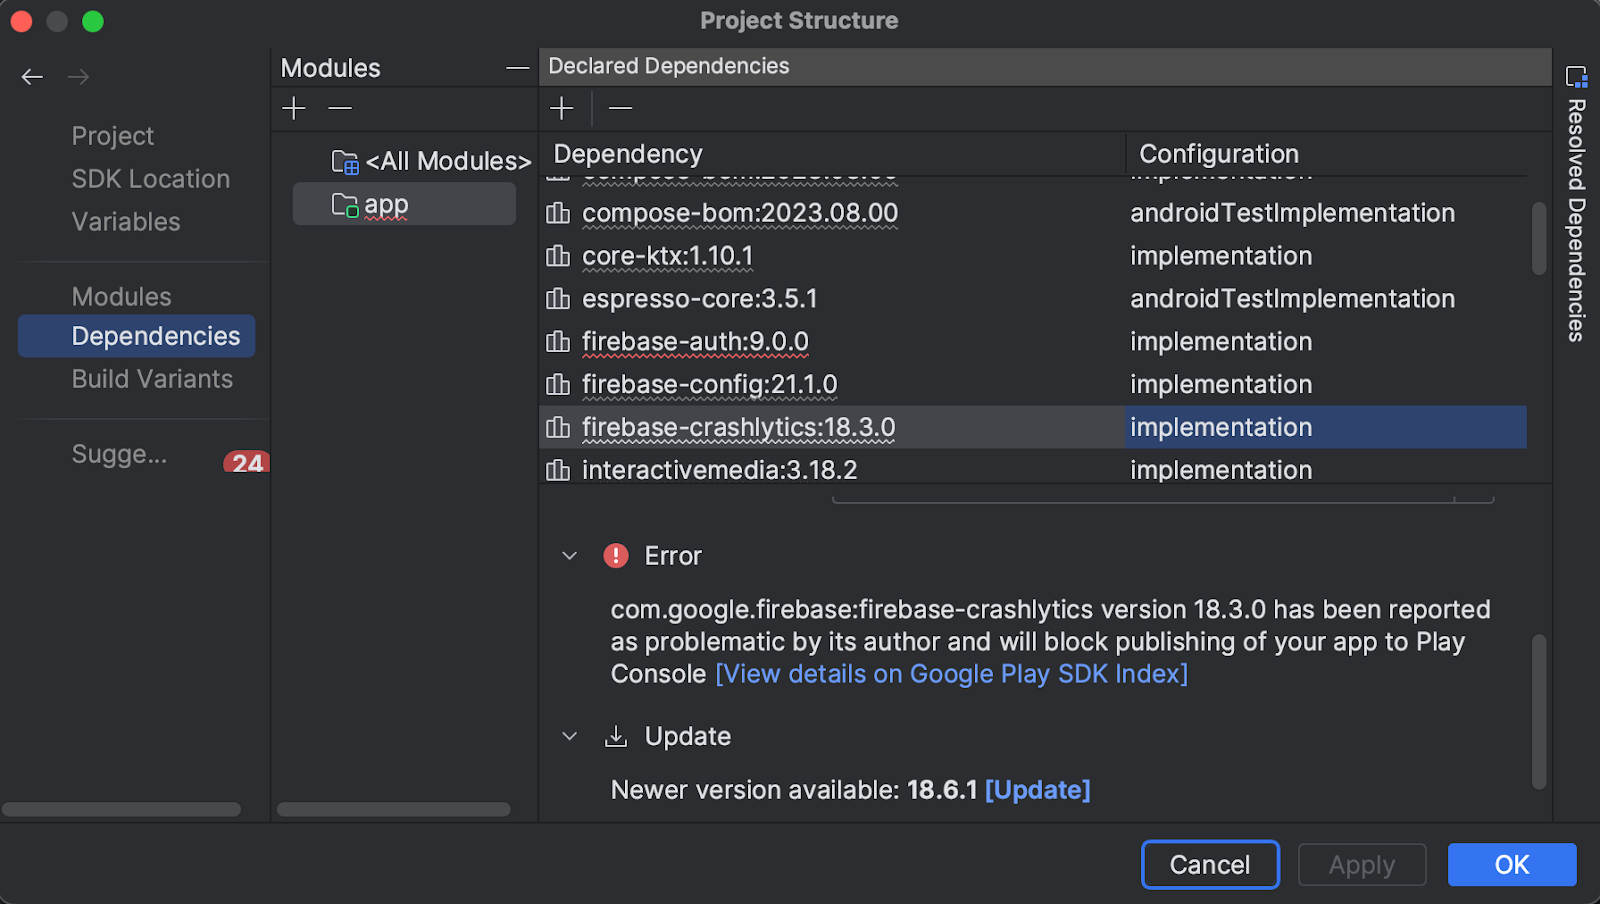
 Posted by Mayank Jain, Product Manager


.gif)

 Posted by Adarsh Fernando, Senior Product Manager, Android Studio
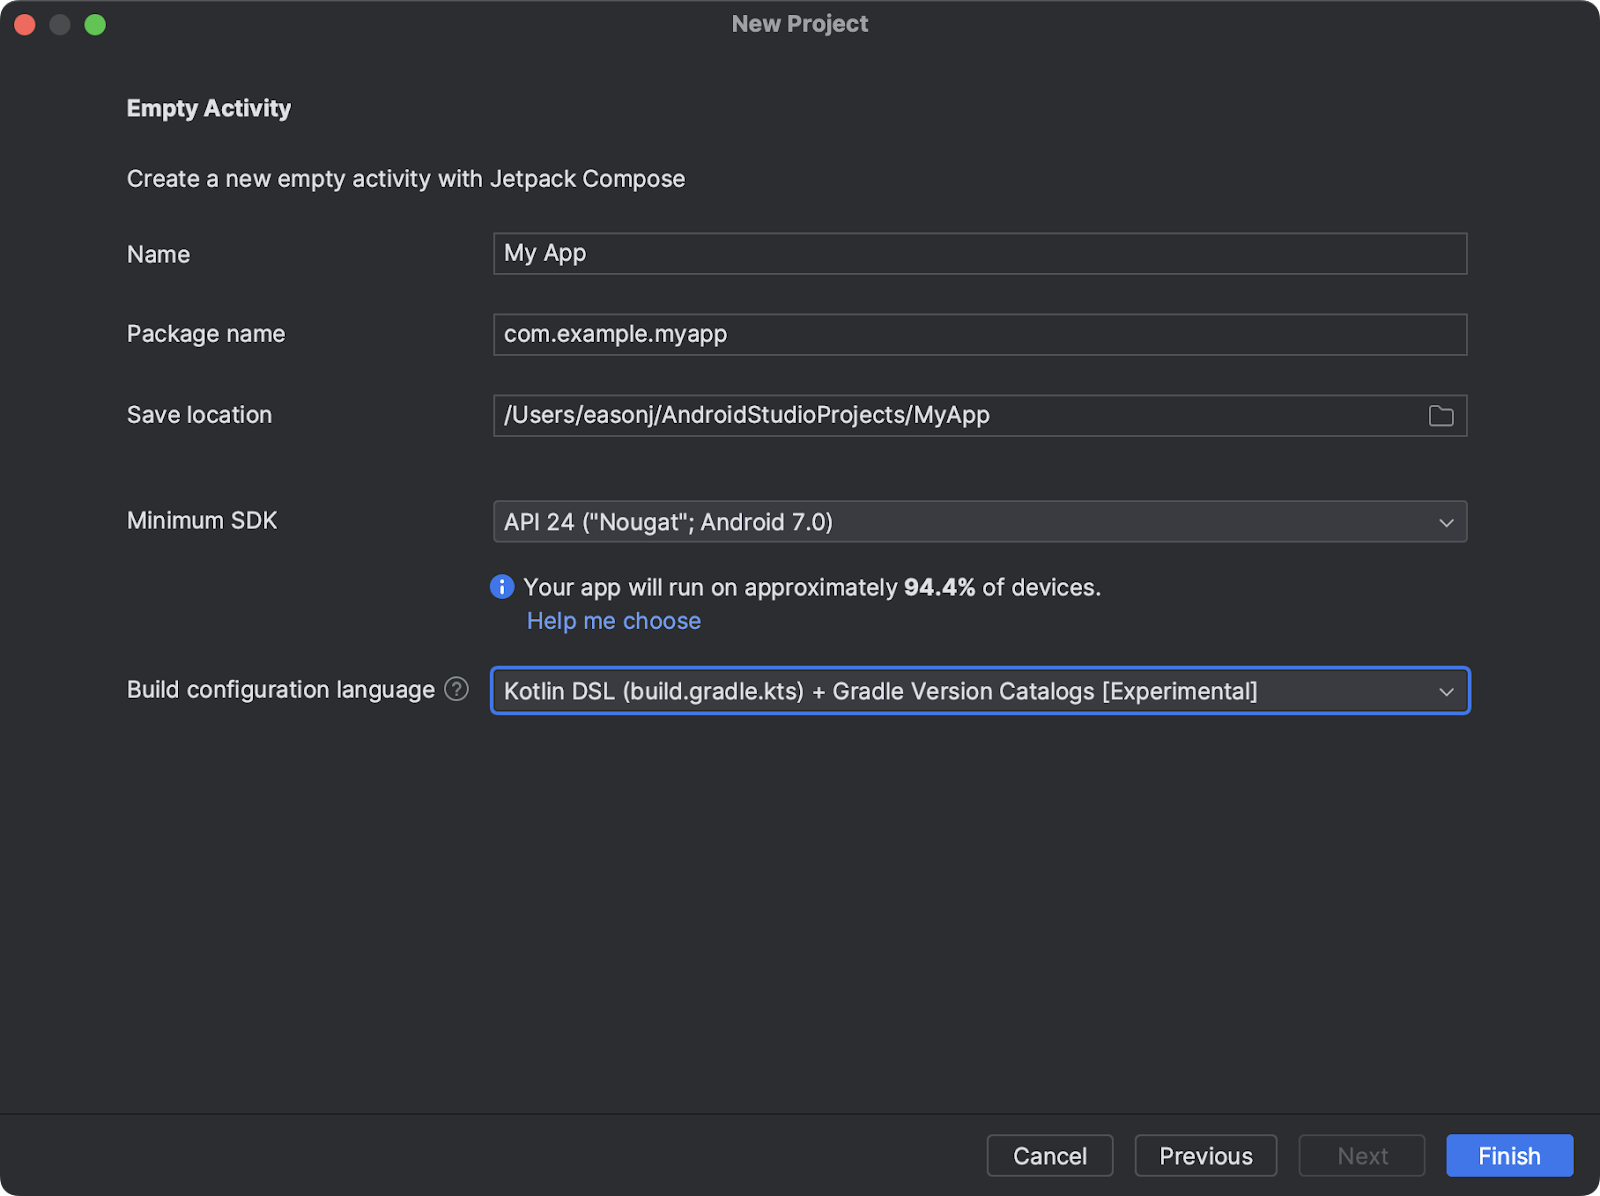
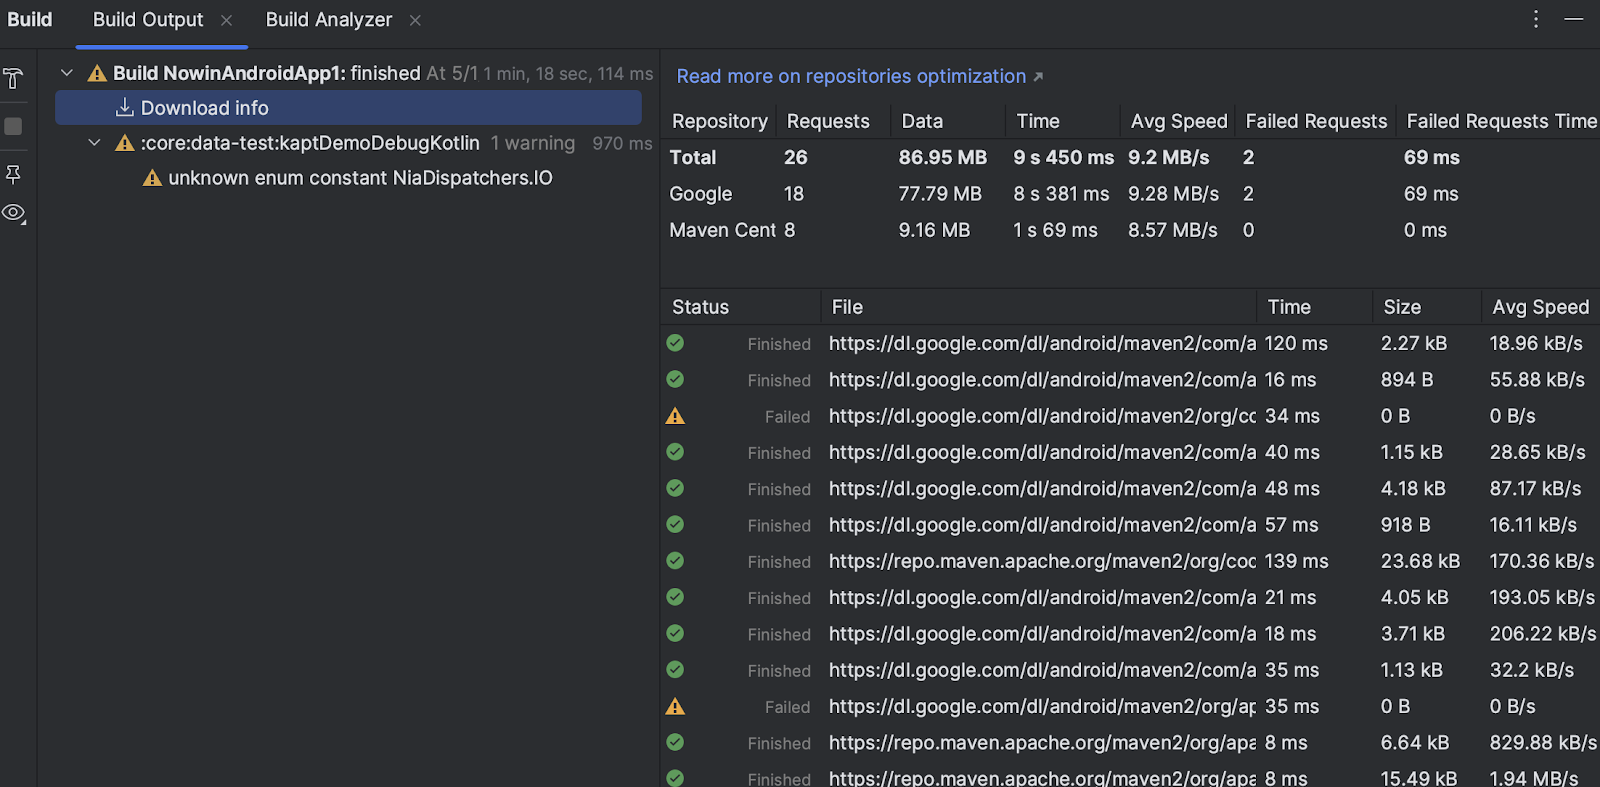
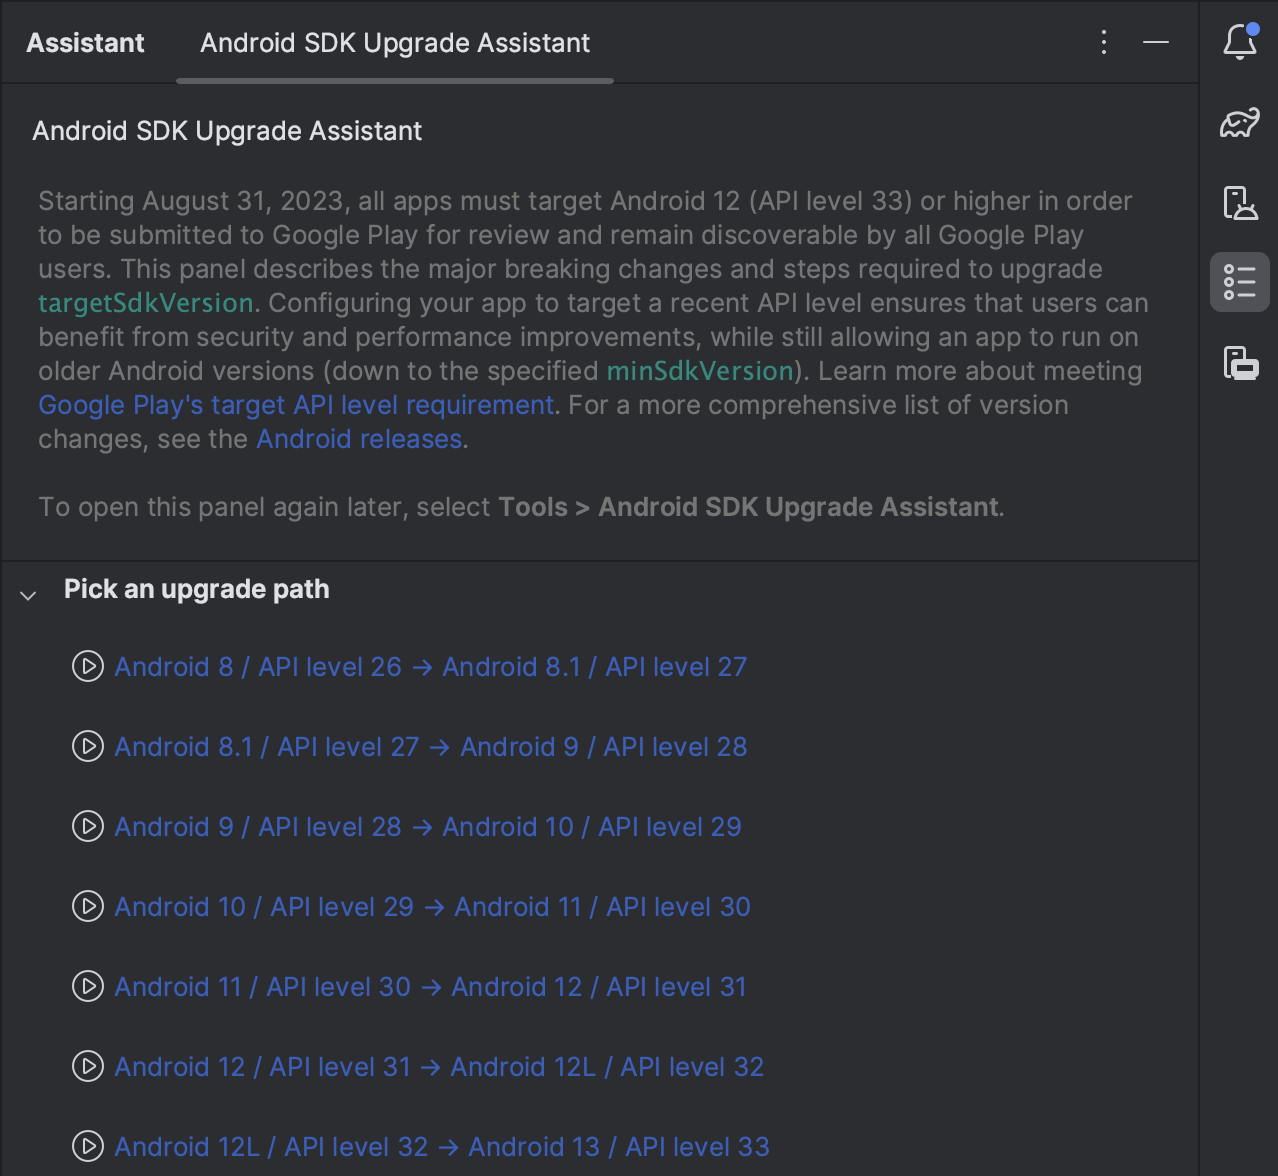


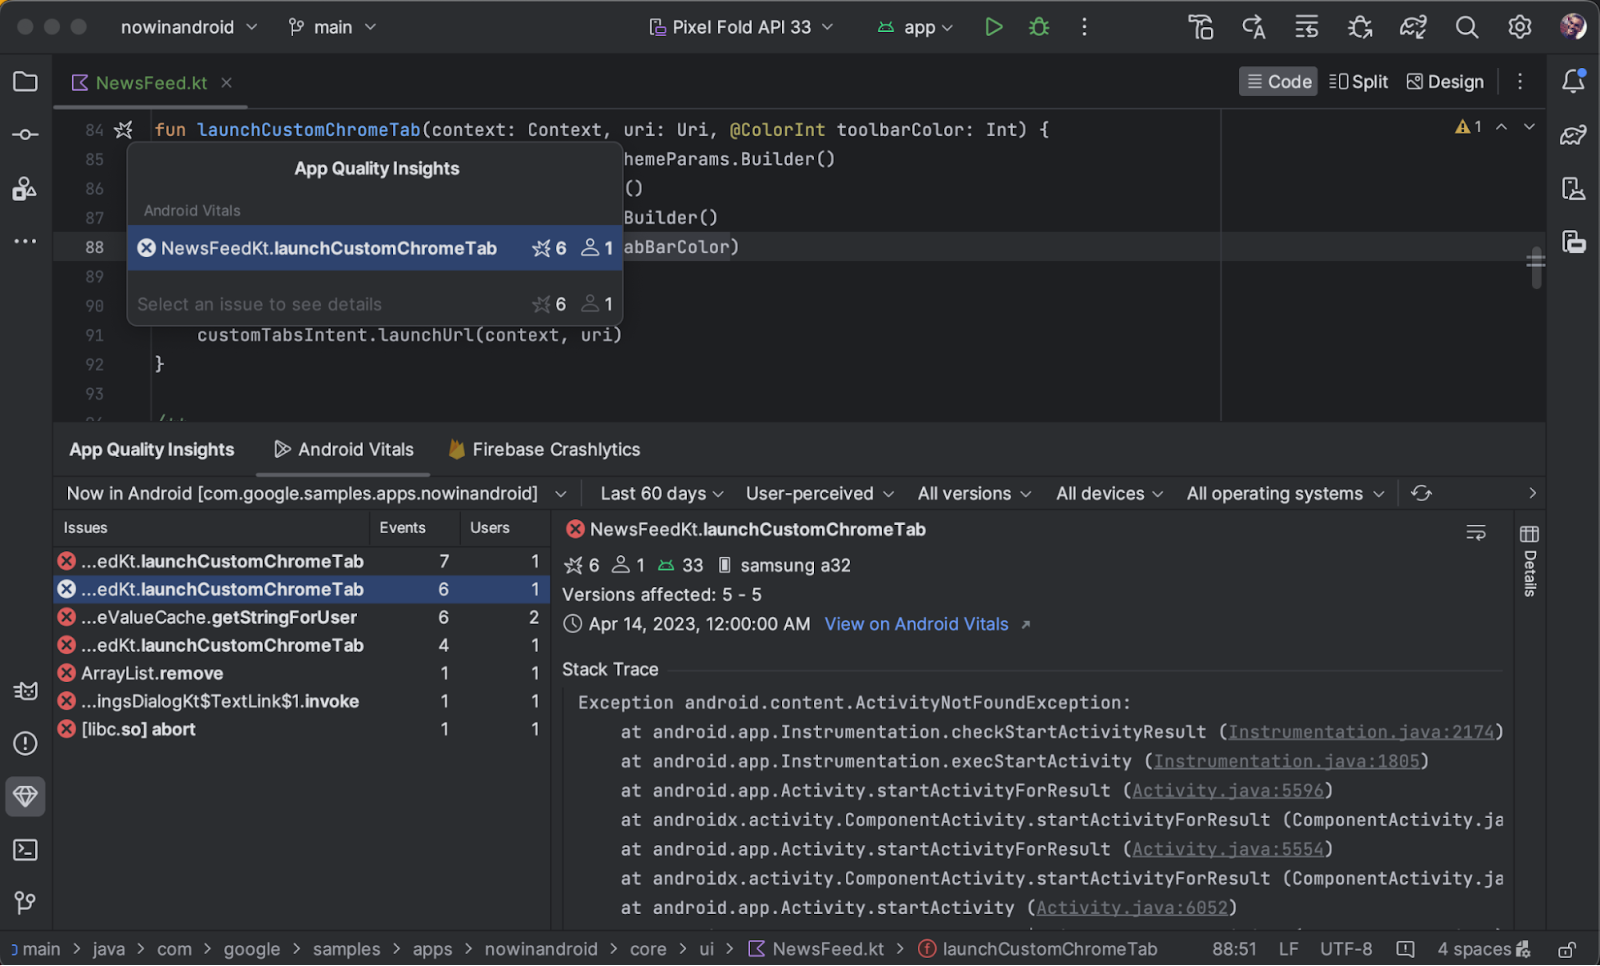


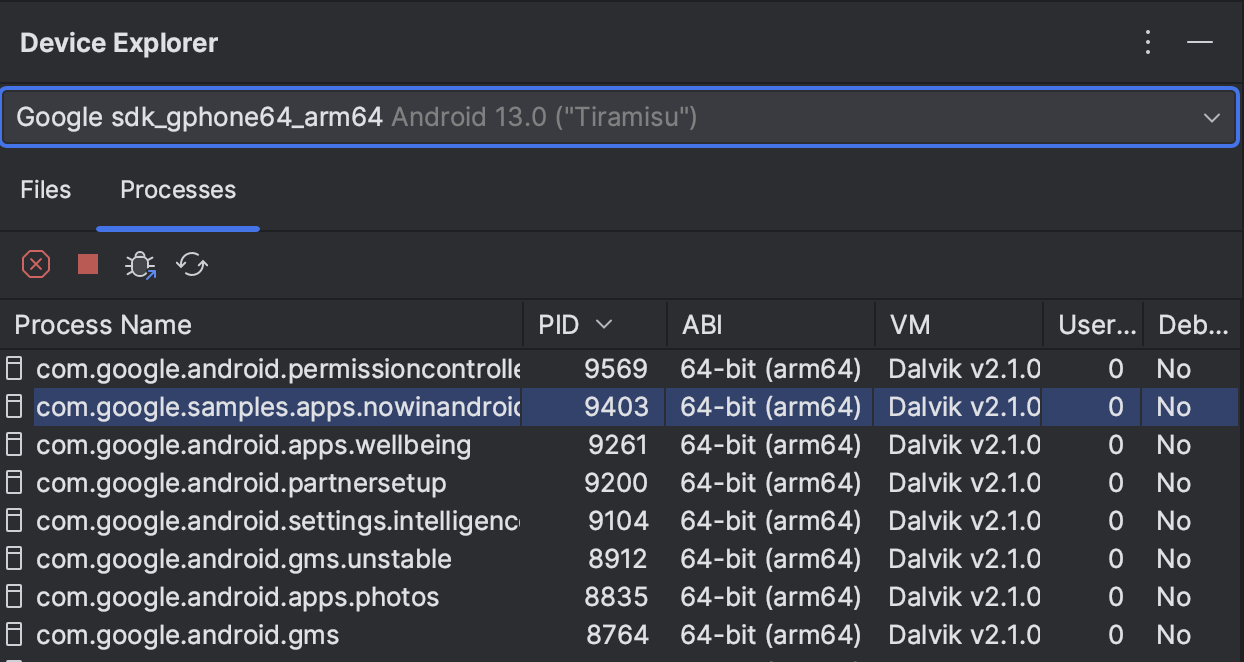
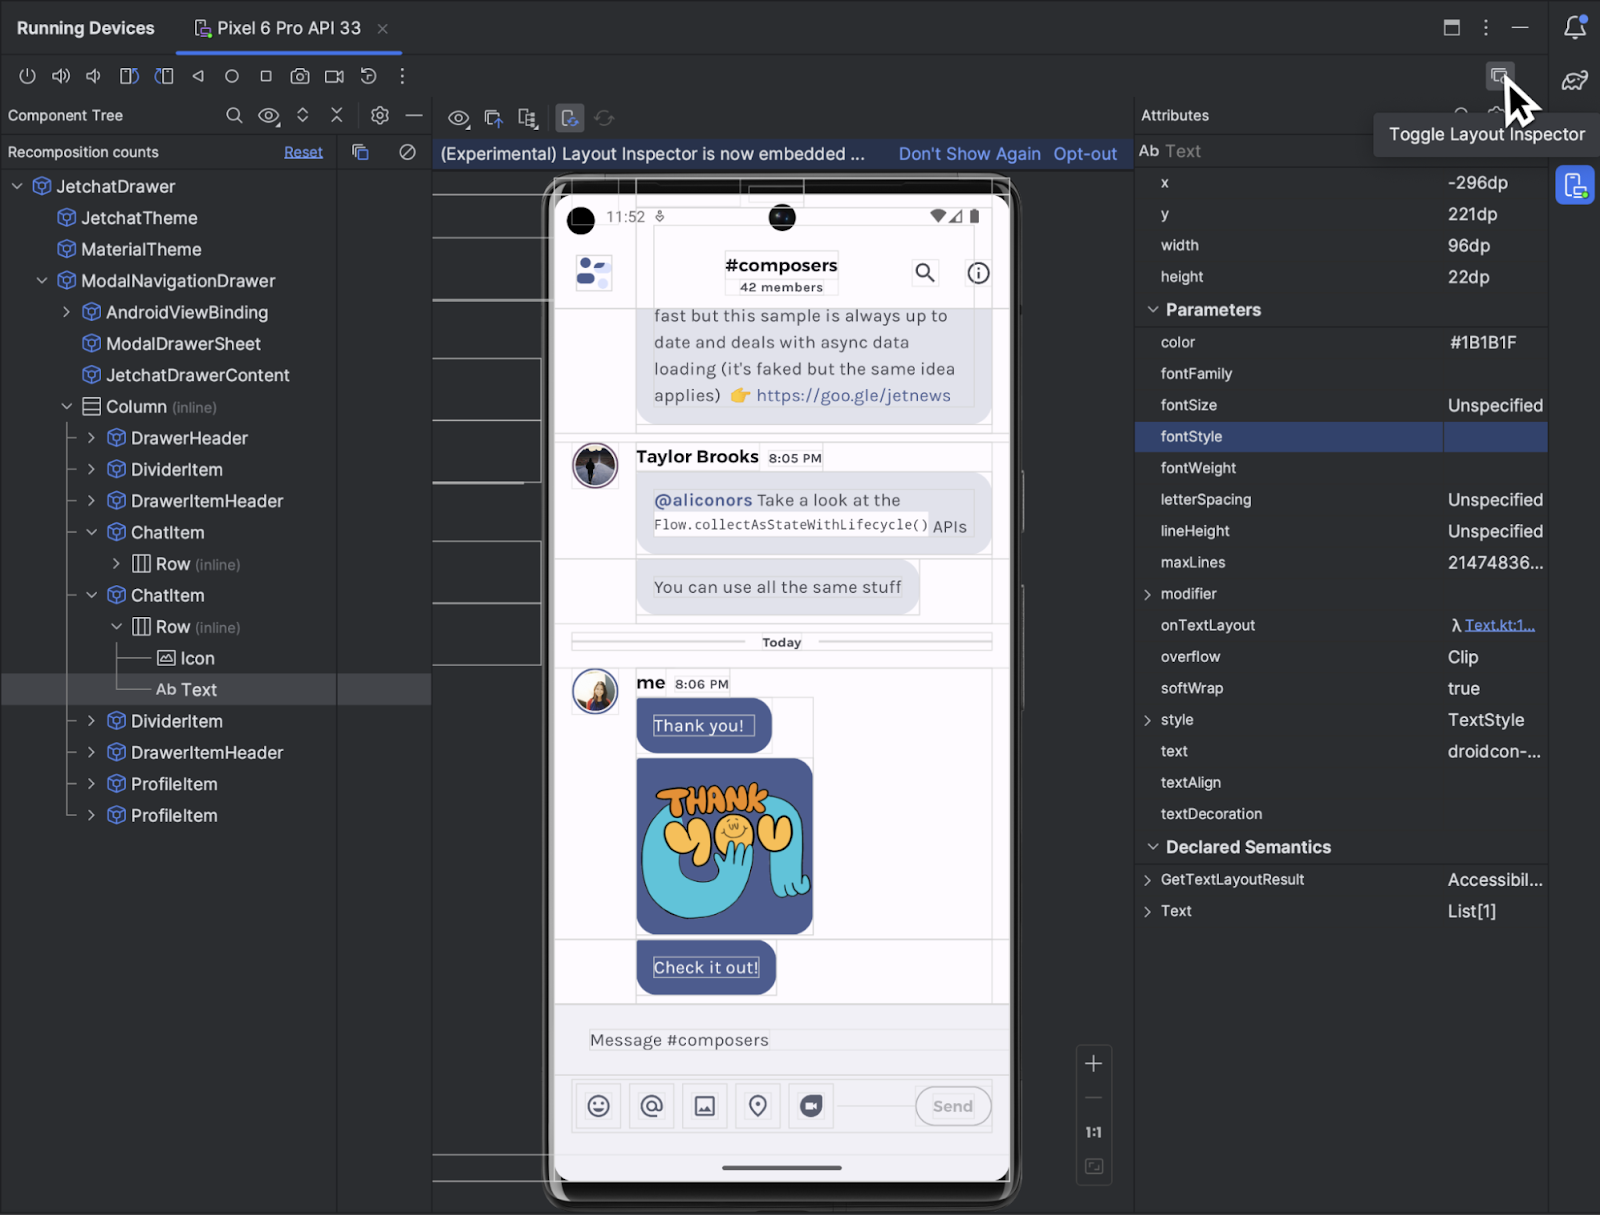
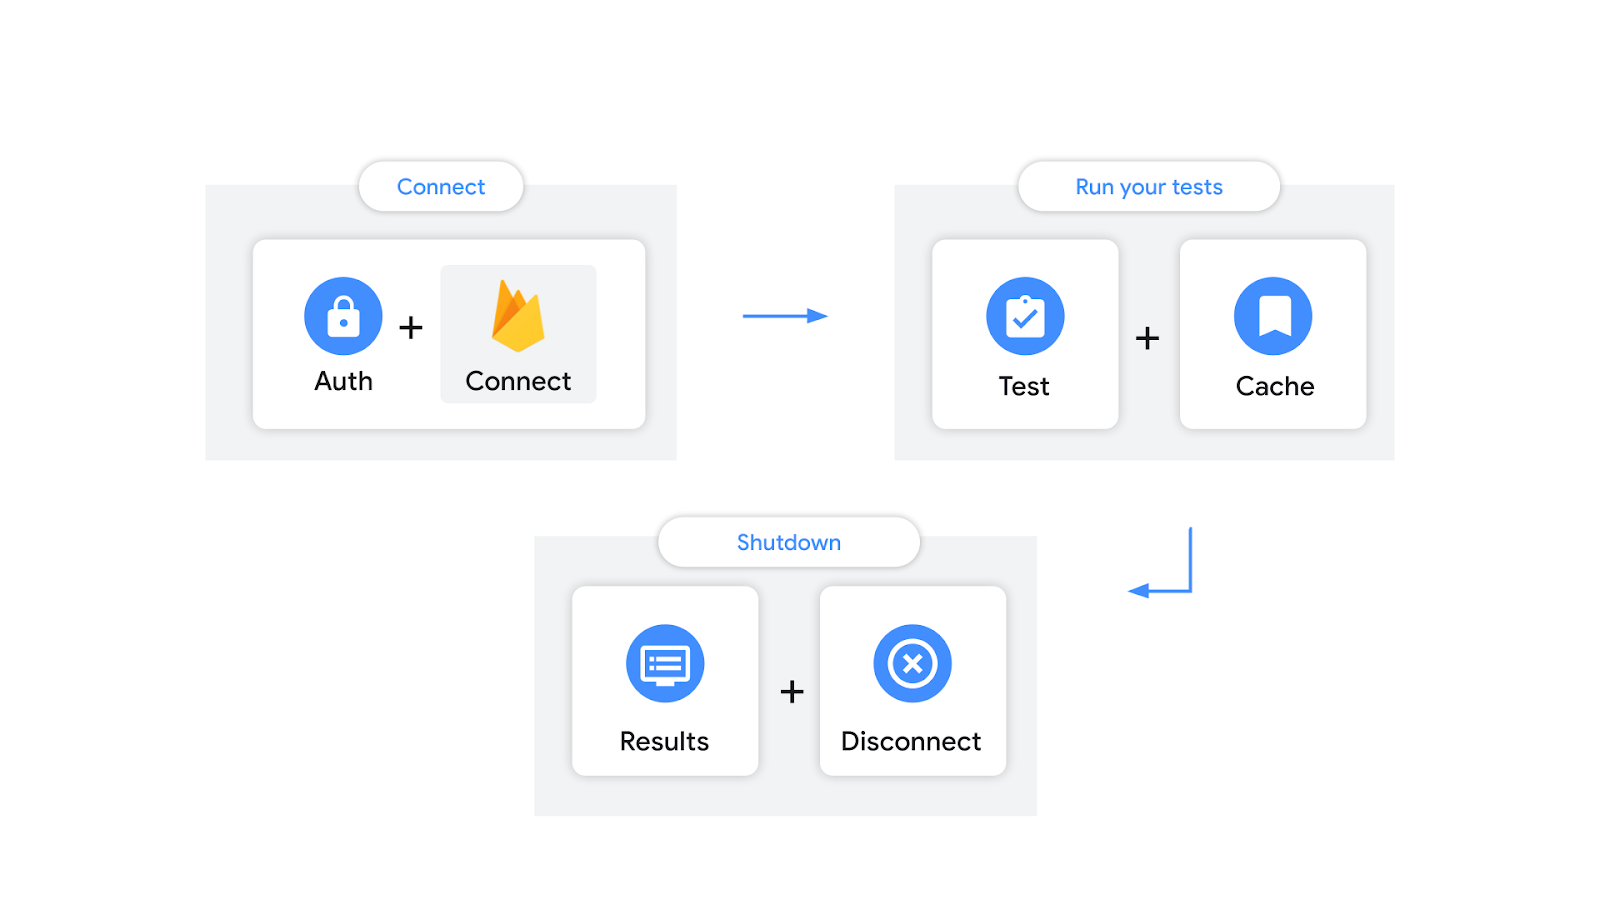
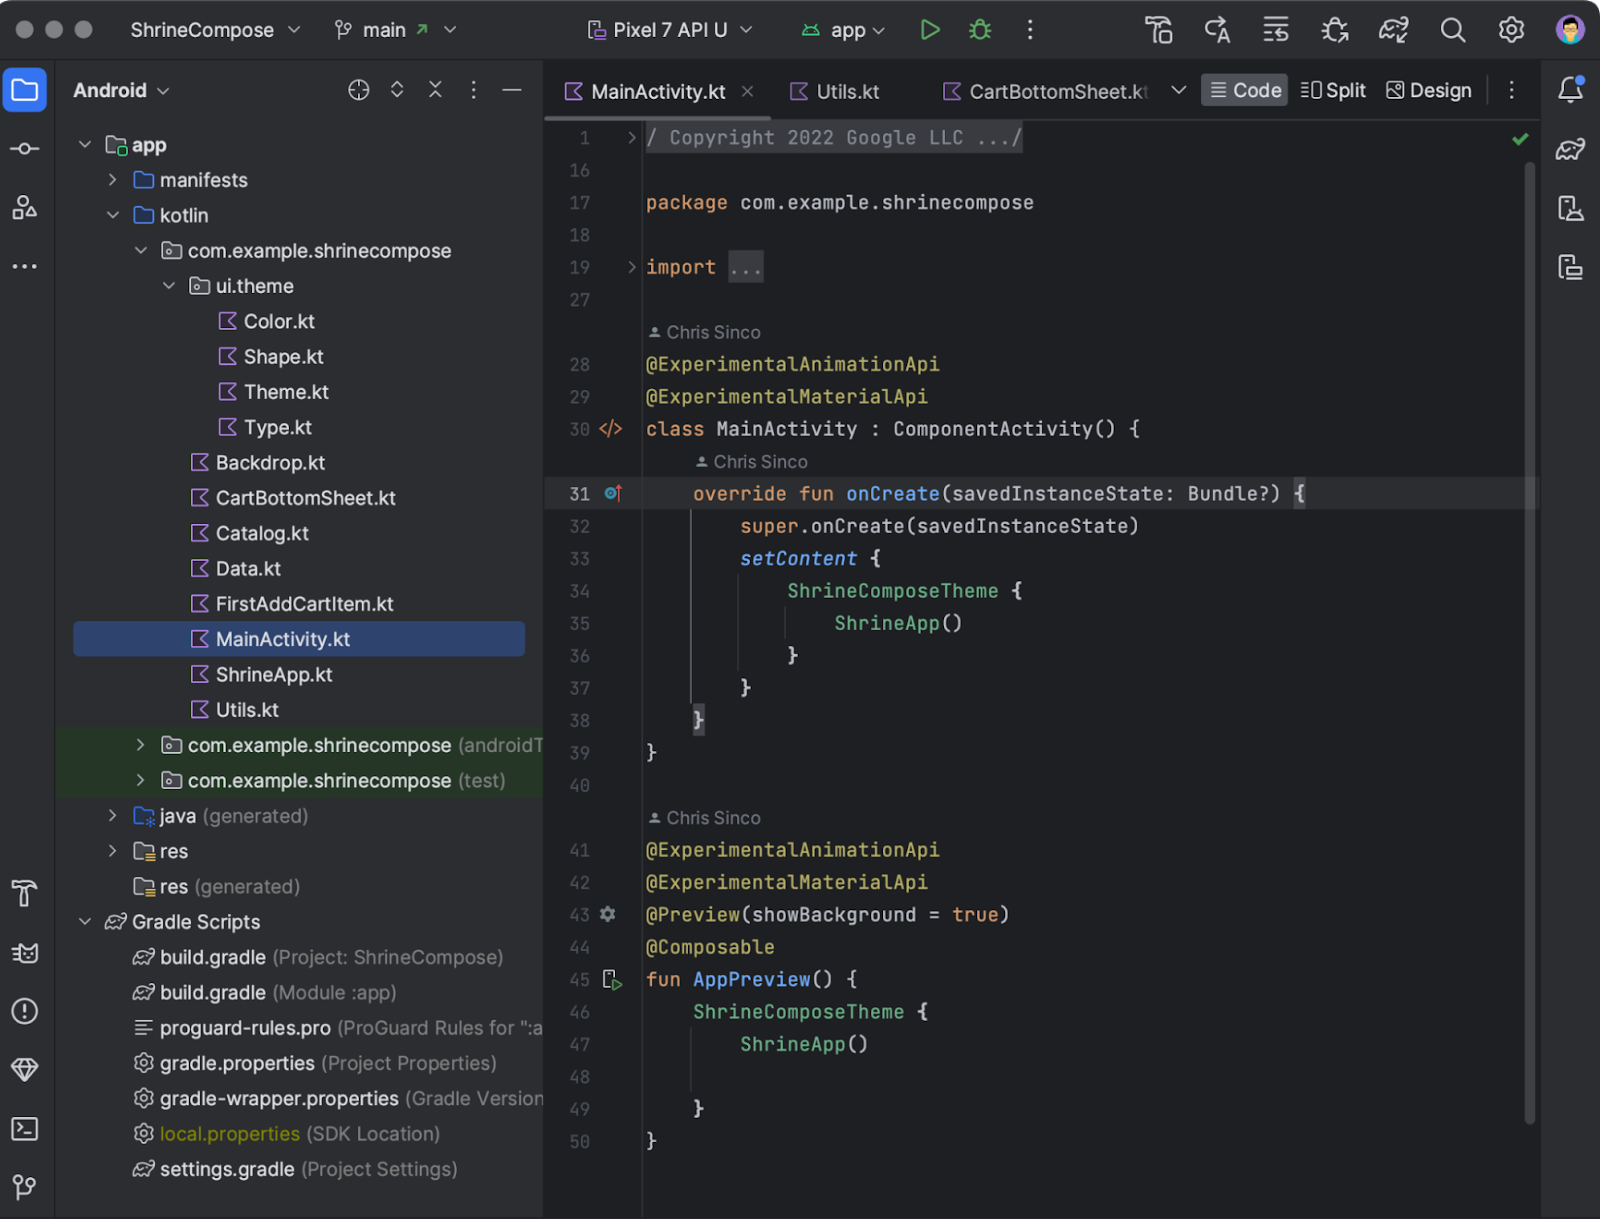
 Posted by Marie Prezner, UX Product Design, Android Developer UX