Tag Archives: Tools

Android Studio’s 10 year anniversary

Posted by Tor Norbye – Engineering Director, Jamal Eason – Director of Product Management, and Xavier Ducrohet – Tech Lead | Android Studio

Android Studio provides you an integrated development environment (IDE) to develop, test, debug, and package Android apps that can reach billions of users across a diverse set of Android devices. Last month we reached a big milestone for the product: 10 years since the Android Studio 1.0 release reached the stable channel. You can hear a bit more about its history in the most recent episode of Android Developers Backstage, or watch some of the team’s favorite moments: 🎉

When we set out to develop Android Studio we started with these three principles:

First, we wanted to build and release a complete IDE, not just a plugin. Before Android Studio, users had to go download a JDK, then download Eclipse, then configure it with an update center to point to Android, install the Eclipse plugin for Android, and then configure that plugin to point to an Android SDK install. Not only did we want everything to work out-of-the-box, but we also wanted to be able to configure and improve everything: from having an integrated dependency management system to offering code inspections that were relevant to Android app developers to having a single place to report bugs.

Second, we wanted to build it on top of an actively maintained, open-sourced, and best-of-breed Java programing language IDE. Not too long before releasing Android Studio, we had all used IntelliJ and felt it was superior from a code editing perspective.

And third, we wanted to not only provide a build system that was better suited for Android app development, but to also enable this build system to work consistently from both from the command line and from inside the IDE. This was important because in the previous tool chain, we found that there were discrepancies in behavior and capability between the in-IDE builds with Eclipse, and CI builds with Ant.

This led to the release of Android Studio, including these highlights:

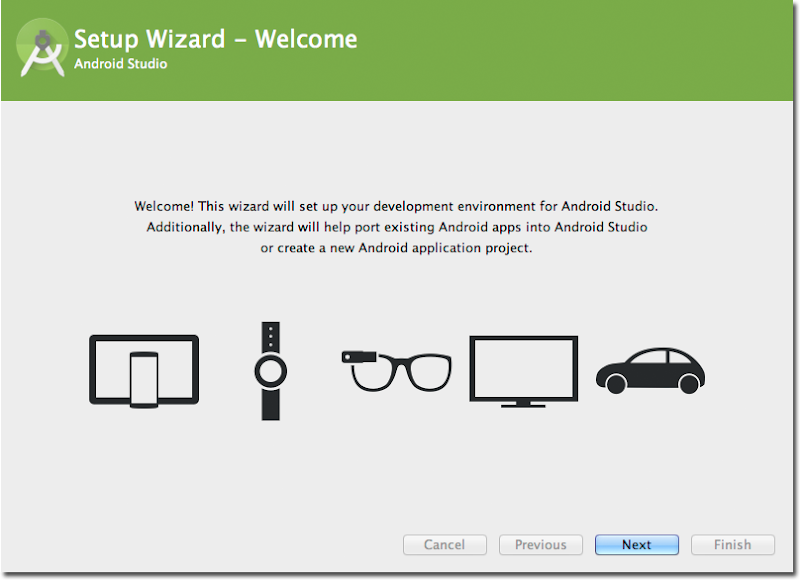
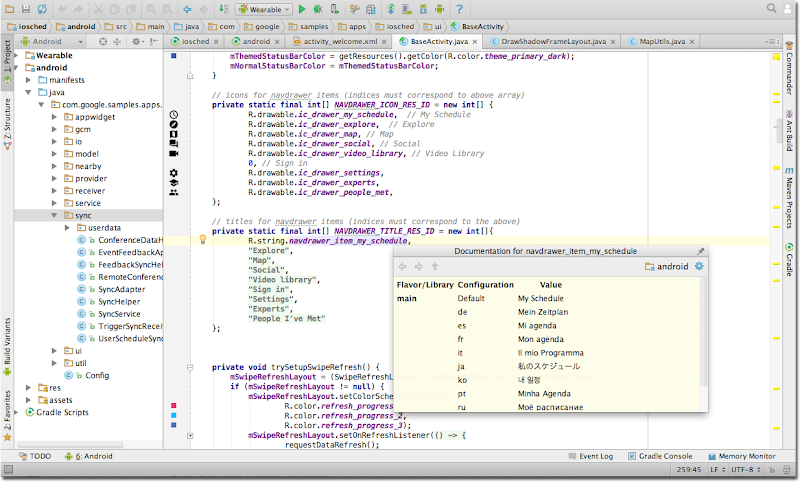
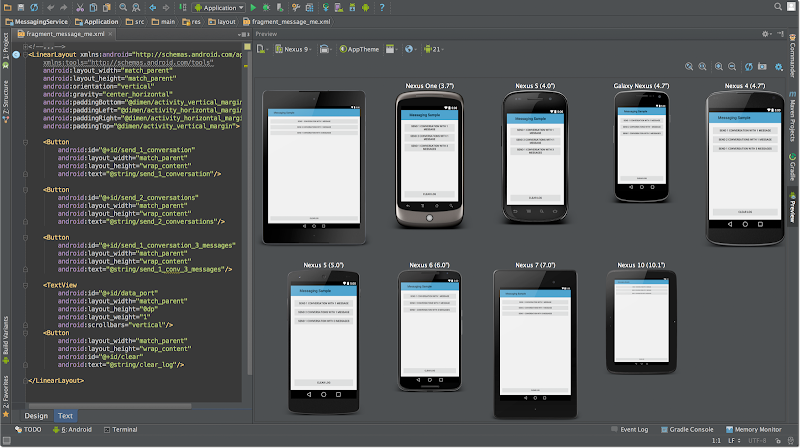
Here are some nostalgic screenshots from that first version of Android Studio:

The Setup Wizard welcome screen displays icons of a tablet, a watch, glasses, a TV, and a car, indicating the variety of devices supported in Android Studio
First-run setup wizard of Android Studio

Android Studio is open with Java code visible in the main window and project files listed in the left sidebar.  A documentation window is open, displaying translation strings for a schedule view.
Editing code within Android Studio

A screenshot of Android Studio shows XML code on the left and previews of a messaging app layout on different Android devices on the right.
Editing and previewing layouts across different screen sizes

Android Studio has come a long way since those early days, but our mission of empowering Android developers with excellent tools continues to be our focus.

Let’s hear from some team members across Android, JetBrains, and Gradle as they reflect on this milestone and how far the ecosystem has come since then.

Android Studio team

“Inside the Android team, engineers who didn't work on apps had the choice between using Eclipse and using IntelliJ, and most of them chose IntelliJ. We knew that it was the gold standard for Java development (and still is, all these years later.) So we asked ourselves: if this is what developers prefer when given a choice, wouldn't this be for our users as well? 

And the warm reception when we unveiled the alpha at I/O in 2013 made it clear that it was the right choice.” 

 - Tor Norbye, Engineering Director of Android Studio at Google

“We had a vision of creating a truly Integrated Development Environment for Android app development instead of a collection of related tools. In our previous working model, we had contributions of Android tools from a range of frameworks and UX flows that did not 100% work well end-to-end. The move to the open-sourced JetBrains IntelliJ platform enabled the Google team to tie tools together in a thoughtful way with Android Studio, plus it allowed others to contribute in a more seamless way. Lastly, looking back at the last 10 years, I’m proud of the partnership with Jetbrains and Gradle, plus the community of contributors to bring the best suite of tools to Android app developers.” 

 – Jamal Eason, Director of Product Management of Android Studio at Google

JetBrains

“Google choosing IntelliJ as the platform to build Android Studio was a very exciting moment for us at JetBrains. It allowed us to strengthen and build on the platform even further, and paved the way for further collaboration in other projects such as Kotlin.” 

 – Hadi Hariri, VP of Program Management at JetBrains

Gradle

“Android Studio's 10th anniversary marks a decade of incredible progress for Android developers. We are proud that Gradle Build Tool has continued to be a foundational part of the Android toolchain, enabling millions of Android developers to build their apps faster, more elegantly, and at scale.”

 – Hans Dockter, creator of Gradle Build Tool and CEO/Founder of Gradle Inc.

“Our long-standing strategic partnership with Google and our mutual commitment to improving the developer experience continues to impact millions of developers. We look forward to continuing that journey for many years to come.” 

 – Piotr Jagielski, VP of Engineering, Gradle Build Tool


Last but not least, we want to thank you for your feedback and support over the last decade. Android Studio wouldn’t be where it is today without the active community of developers who are using it to build Android apps for their communities and the world and providing input on how we can make it better each day.

As we head into this new year, we’ll be bringing Gemini into more aspects of Android Studio to help you across the development lifecycle to build quality apps faster. We’ll strive to make it easier and more seamless to build, test, and deploy your apps with Jetpack Compose across the range of form factors. We are proud of what we launch, but we always have room to improve in the evolving mobile ecosystem. Therefore, quality and stability of the IDE is our top priority so that you can be as productive as possible.

We look forward to continuing to empower you with great tools and improvements as we take Android Studio forward into the next decade. 🚀 We also welcome you to be a part of our developer community on LinkedIn, Medium, YouTube, or X.

Introducing the Google Wallet API

Posted by Petra Cross, Engineer, Google Wallet and Jose Ugia, Google Developer Relations Engineer

Google Pay API for Passes is now called Google Wallet API

Formerly known as Google Pay API for Passes, the Google Wallet API lets you digitize everything from boarding passes to loyalty programs, and engage your customers with notifications and real-time updates.

New features in Google Wallet API

Support for Generic Pass Type

The Google Pay API for Passes supported 7 types of passes: offers, loyalty cards, gift cards, event tickets, boarding passes, transit tickets and vaccine cards. But what if you want to issue passes or cards that do not fit into any of these categories, such as membership cards, or insurance cards?

We are thrilled to announce support for generic passes to the Google Wallet API so you can customize your pass objects to adapt to your program characteristics. The options are endless. If it is a card and has some text, a barcode or a QR code, it can be saved as a generic card.

You now have the flexibility to control the look and design of the card itself, by providing a card template that can contain up to 3 rows with 1-3 fields per row. You can also configure a number of attributes such as the barcode, QR code, or a hero image. Check out our documentation to learn more about how to create generic passes.

While generic passes can be used to mimic the appearance of any existing supported pass type (such as a loyalty card), we recommend you to continue to use specialized pass types when available. For example, when you use the boarding pass type for boarding passes your users receive flight delay notifications.

Grouping passes and mixing pass types

With the new Google Wallet API, you can also group passes to offer a better experience to your users when multiple passes are needed. For example, you can group the entry ticket, a parking pass, and food vouchers for a concert.

In your user’s list of passes, your users see a pass tile with a badge showing the number of items in the group. When they tap on this tile, a carousel with all passes appears, allowing them to easily swipe between all passes in the group.


Here is an example JSON Web Token payload showing one offer and one event ticket, mixed together and sharing the same groupingId. Later, if you need to add or remove passes to/from the group, you can use the REST API to update the grouping information.

{

  "iss""OWNER_EMAIL_ADDRESS",

  "aud""google",

  "typ""savetowallet",

  "iat""UNIX_TIME",

  "origins": [],

  "payload": {

    "offerObjects": [

      {

        "classId""YOUR_ISSUER_ID.OFFER_CLASS_ID",

        "id""YOUR_ISSUER_ID.OFFER_ID",

        "groupingInfo": {

          "groupingId""groupId1",

          "sortIndex"2

        }

      }

    ],

    "eventTicketObjects": [

      {

        "classId""YOUR_ISSUER_ID.EVENT_CLASS_ID",

        "id""YOUR_ISSUER_ID.EVENT_ID",

        "groupingInfo": {

          "groupingId""groupId1",

          "sortIndex"1

        }

      }

    ] 

  }

}


A note about Google Pay API for Passes:

Although we are introducing the Google Wallet API, all existing developer integrations with the previous Google Pay Passes API will continue to work. When the Google Wallet app is launched in just a few weeks, make sure to use the new “Add to Google Wallet” button in the updated button guidelines.

We’re really excited to build a great digital wallet experience with you, and can’t wait to see how you use the Google Wallet API to enhance your user experience.

Learn more

Write better tests with the new testing guidance

Posted by Jose Alcérreca, Android Developer Relations Engineer

Blue illustration with Android phone 

As apps increase in functionality and complexity, manually testing them to verify behavior becomes tedious, expensive, or impossible. Modern apps, even simple ones, require you to verify an ever-growing list of test points such as UI flows, localization, or database migrations. Having a QA team whose job is to manually verify that the app works is an option, but fixing bugs at that stage is expensive. The sooner you fix a problem in the development process the better.

Automating tests is the best approach to catching bugs early. Automated testing (from now on, testing) is a broad domain and Android offers many tools and libraries that can overlap. For this reason, beginners often find testing challenging.

In response to this feedback, and to accommodate for Compose and new architecture guidelines, we revamped two testing sections on d.android.com:

Training

Firstly, there is the new Testing training, which includes the fundamentals of testing in Android with two new articles: What to test, an opinionated guide for beginners, and a detailed guide on Test doubles.

Faking dependencies in unit tests

Faking dependencies in unit tests


After providing an overview of the theory, the guide focuses on practical examples of the two main types of tests.

Developer tools to debug WebView in Beta

Posted by Nate Fischer, Software Engineer, WebView team

Since 2014, Android WebView has paved the way as an updateable system component, delivering stability and performance improvements, modern web platform features, and security patches to Android apps and users. However, updates can be a double edged sword: as much as we strive for stability and backward compatibility, new crashes and breaking changes occasionally slip through. To solve these issues faster, today we're announcing WebView DevTools, a new set of on-device debugging tools to diagnose WebView-caused crashes and misbehaving web platform features.

For your convenience, WebView DevTools comes included as part of WebView itself. The easiest way to launch WebView Devtools is to try out WebView Beta. WebView's beta program is a way for app developers to get WebView several weeks before they reach users, for extra lead time to report compatibility bugs to our team. Starting with today's release (M83), WebView Beta includes a launcher icon for WebView DevTools. Just look for the blue and gray WebView gear icon to get started debugging WebView in your app.

Inspecting a crash in WebView DevTools.

Inspecting a crash in WebView DevTools.

No software is bug-free and loading web content can be challenging, so it's no surprise WebView crashes are a pain point for apps. Worse yet, these crashes are difficult to debug because WebView's Java and C++ stack traces are obfuscated (to minimize APK size for Android users). To help make these crashes more actionable, we're exposing first-class access to WebView's built-in crash reporter. Just open WebView DevTools, tap on "crashes," and you'll see a list of recent WebView-caused crashes from apps on your device. You can use this tool to see if the crash report has been uploaded to our servers, force-upload it if necessary, and subsequently file a bug. This ensures our team has all the information we need to swiftly resolve these crashes and ensure a smoother user experience in your app.

IUsing flags to highlight WebView usage in Android apps.

Using flags to highlight WebView usage in Android apps.

However, not all bugs cause crashes. A handful of past WebView releases have broken Android apps due to behavior changes caused by new features. While our team's policy is to roll back features which break compatibility, the chromium team launches several features for WebView in each release, and we often need time to identify the offending feature. WebView DevTools can help here too. Inspired by Google Chrome's chrome://flags tool, which enables compatibility testing with web platform features, we're offering app developers similar controls for experimental features. To get started, open WebView DevTools, tap on "flags," enable or disable any available features, then kill and restart the WebView-based app you're testing. Using WebView DevTools will help us work together to pin down the culprit so we can roll it back. We've also included flags for features slated for upcoming releases, so you can test compatibility even earlier by enabling these features on your test device.

We hope you find WebView DevTools helpful for reporting crashes and testing against new WebView features. Install WebView Beta today to get started with WebView DevTools, and check out the user guide for more tips and tricks.

Kpt: Packaging up your Kubernetes configuration with git and YAML since 2014

Kubernetes configuration manifests have become an industry standard for deploying both custom and off-the-shelf applications (as well as for infrastructure). Manifests are combined into bundles to create higher-level deployable systems as well as reusable blueprints (such as a product offering, off the shelf software, or customizable starting point for a new application).

However, most teams lack the expertise or desire to create bespoke bundles of configuration from scratch and instead: 1) either fork them from another bundle, or 2) use some packaging solution which generates manifests from code.

Teams quickly discover they need to customize, validate, audit and re-publish their forked/ generated bundles for their environment. Most packaging solutions to date are tightly coupled to some format written as code (e.g. templates, DSLs, etc). This introduces a number of challenges when trying to extend, build on top of, or integrate them with other systems. For example, how does one update a forked template from upstream, or how does one apply custom validation?

Packaging is the foundation of building reusable components, but it also incurs a productivity tax on the users of those components.

Today we’d like to introduce kpt, an OSS tool for Kubernetes packaging, which uses a standard format to bundle, publish, customize, update, and apply configuration manifests.

Kpt is built around an “as data” architecture bundling Kubernetes resource configuration, a format for both humans and machines. The ability for tools to read and write the package contents using standardized data structures enables powerful new capabilities:
  • Any existing directory in a Git repo with configuration files can be used as a kpt package.
  • Packages can be arbitrarily customized and later pull in updates from upstream by merging them.
  • Tools and automation can perform high-level operations by transforming and validating package data on behalf of users or systems.
  • Organizations can develop their own tools and automation which operate against the package data.
  • Existing tools and automation that work with resource configuration “just work” with kpt.
  • Existing solutions that generate configuration (e.g. from templates or DSLs) can emit kpt packages which enable the above capabilities for them.

Example workflow with kpt

Now that we’ve established the benefits of using kpt for managing your packages of Kubernetes config, lets walk through how an enterprise might leverage kpt to package, share and use their best practices for Kubernetes across the organization.


First, a team within the organization may build and contribute to a repository of best practices (pictured in blue) for managing a certain type of application, for example a microservice (called “app”). As the best practices are developed within an organization, downstream teams will want to consume and modify configuration blueprints based on them. These blueprints provide a blessed starting point which adheres to organization policies and conventions.

The downstream team will get their own copy of a package by downloading it to their local filesystem (pictured in red) using kpt pkg get. This clones the git subdirectory, recording upstream metadata so that it can be updated later.

They may decide to update the number of replicas to fit their scaling requirements or may need to alter part of the image field to be the image name for their app. They can directly modify the configuration using a text editor (as would be done before). Alternatively, the package may define setters, allowing fields to be set programmatically using kpt cfg set. Setters streamline workflows by providing user and automation friendly commands to perform common operations.

Once the modifications have been made to the local filesystem, the team will commit and push their package to an app repository owned by them. From there, a CI/CD pipeline will kick off and the deployment process will begin. As a final customization before the package is deployed to the cluster, the CI/CD pipeline will inject the digest of the image it just built into the image field (using kpt cfg set). When the image digest has been set, the CI/CD pipeline can send the manifests to the cluster using kpt live apply. Kpt live operates like kubectl apply, providing additional functionality to prune resources deleted from the configuration and block on rollout completion (reporting status of the rollout back to the user).

Now that we’ve walked through how you might use kpt in your organization, we’d love it if you’d try it out, read the docs, or contribute.

One more thing

There’s still a lot to the story we didn’t cover here. Expect to hear more from us about:
  • Using kpt with GitOps
  • Building custom logic with functions
  • Writing effective blueprints with kpt and kustomize
By Phillip Wittrock, Software Engineer and Vic Iglesias, Cloud Solutions Architect

Understanding Scheduling Behavior with SchedViz

Linux kernel scheduling behavior can be a key factor in application responsiveness and system utilization. Today, we’re announcing SchedViz, a new tool for visualizing Linux kernel scheduling behavior. We’ve used it inside Google to discover many opportunities for better scheduling choices and to root-cause many latency issues.

Thread Scheduling

Modern OSs execute multiple processes concurrently, by running each for a brief burst, then switching to the next: a feature called multiprogramming. Modern processors include multiple cores, each of which can run its own thread, known as multiprocessing. When these two features are combined, a new engineering challenge emerges: when should a thread run? How long should it run, and on what processor? This thread scheduling strategy is a complex problem, and can have a significant effect on performance. In particular, threads that don't get scheduled to run can suffer starvation, which can adversely affect user-visible latencies.

In an ideal system, a simple strategy of assigning chunks of CPU-time to threads in a round-robin manner would maximize fairness by ensuring all threads are equally starved. But, of course, real systems are far from ideal, and this view of fairness may not be an appropriate performance goal. Here are a few factors that make scheduling tricky:
  • Not all threads are equally important. Each thread has a priority that specifies its importance relative to other threads. Thread priorities must be selected carefully, and the scheduler must honor those selections.
  • Not all cores are equal. The structure of the memory hierarchy can make it costly to shift a thread from one core to another, especially if that shift moves it to a new NUMA node. Users can explicitly pin threads to a CPU or a set of CPUs, or can exclude threads from specific CPUs, using features like sched_setaffinity or cgroups. But such restrictions also make scheduling even tougher.
  • Not all threads want to run all the time. Threads may sleep waiting for some event, yielding their core to other execution. When the event occurs, pending threads should be scheduled quickly.
SchedViz permits you to observe real scheduling behavior. Comparing this with the expected or desired behavior can point to specific problems and possible solutions.

Tracepoints and Kernel Tracing

The Linux kernel is instrumented with hooks called tracepoints; when certain actions occur, any code hooked to the relevant tracepoint is called with arguments that describe the action. The kernel also provides a debug feature that can trace this data and stream it to a buffer for later analysis.

Hundreds of different tracepoints exist, arranged into families of related function. The sched family includes tracepoints that can reconstruct thread scheduling behavior—when threads switched in, blocked on some event, or migrated between cores. These sched tracepoints provide fine-grained and comprehensive detail about thread scheduling behavior over a short period of traced execution.

SchedViz: Visualize Thread Scheduling Over Time

SchedViz provides an easy way to gather kernel scheduling traces from hosts, and visualize those traces over time. Tracing is simple:
$ sudo ./trace.sh -capture_seconds 5 -out ~/traces
Then, importing the resulting collection into SchedViz takes just one click.


Once imported, a collection will always be available for later viewing, until you delete it.

The SchedViz UI displays collections in several ways. A zoomable and pannable heatmap shows system cores on the y-axis, and the trace duration on the x-axis. Each core in the system has a swim-lane, and each swim-lane shows CPU utilization (when that CPU is being kept busy) and wait-queue depth (how many threads are waiting to run on that CPU.) The UI also includes a thread list that displays which threads were active in the heatmap, along with how long they ran, waited to run, and blocked on some event, and how many times they woke up or migrated between cores. Individual threads can be selected to show their behavior over time, or expanded to see their details.

Using SchedViz to Identify Antagonisms: Not all threads are equally important

Antagonism describes the situation in which a victim thread is ready to run on some CPU, while another antagonist thread runs on that same CPU. Long antagonisms, or high cumulative duration of antagonisms, can degrade user experience or system efficiency by making a critical process unavailable at critical times.

Antagonist analysis is useful when threads are meant to have exclusive access to some core but don’t get it. In SchedViz, such antagonisms are listed in each thread’s summary, as well as being immediately visible as breaks in the victim thread's running bar. Zooming in reveals exactly what work is interfering.

Several antagonisms affect a thread that wants its CPU exclusively.
Root-causing an antagonism via zooming in.

Round-robin queueing, in which two or more threads, each wanting to run most or all of the time, occupy a single CPU for a period of time, also yields antagonisms. In this case, the scheduler attempts to avert starvation by giving multiple threads short time-slices to run in a round-robin manner. This reduces the throughput of affected threads while introducing often-significant, repeating, latencies. It is a sign that some portion of the system is overloaded.

In SchedViz, round-robin scheduling appears as a sequence of fixed-size intervals in which the running thread, and the set of waiting threads, changes with each interval. The SchedViz UI makes it easy to better understand what caused this phenomenon.

An overloaded CPU with two threads engaged in round-robin queueing. Running intervals are shown as ovals at top; waiting intervals as rectangles at bottom.
Zooming out and viewing more CPUs reveals that round-robin queueing started when a thread migrated into the overtaxed CPU.

Using SchedViz to Identify NUMA Issues: Not all cores are equal

Larger servers often have several NUMA nodes; a CPU can access a subset of memory (the DRAM local to its NUMA node) more quickly than other memory (other nodes' DRAMs). This non-uniformity is a practical consequence of growing core count, but it brings challenges.

On the one hand, a thread migrated away from the DRAM that holds most of its state will suffer, since it will then have to pay an extra tax for each DRAM access. SchedViz can help identify cases like this, making it clear when a thread has had to migrate across NUMA boundaries.

On the other hand, it is important to ensure that all NUMA nodes in a system are well-balanced, lest part of the machine is overloaded while another part of the machine sits idle.

A thread (in yellow) risks higher-latency memory accesses as it migrates across NUMA nodes.
A system risks both under-utilization and increased latency due to NUMA imbalance.

Beyond Scheduling

Many issues can be identified and explored using only sched tracepoints. But, there are many tracepoints, reflecting a wide variety of phenomena. Many of these tracepoints go well with scheduling data. For example, irq events can reveal when thread running time is spent handling interrupts; sys events can help reveal when execution moves into the kernel, and what it’s doing there; and workqueue events can show when kernel work is underway, and what work is being done. SchedViz presently offers limited support for visualizing these non-sched tracepoint families, but improving that support is an active area of development for us.

Sunsetting the creation of target spend field for Maximize Clicks strategies in Google Ads API

On July 31st, 2019 we will begin to sunset the target spend field for Maximize Clicks bidding strategies in the API. This will affect all versions of both the AdWords API and Google Ads API. The following behaviors will be blocked:
  • Populating the target spend field on existing standard and portfolio strategies.
  • Attaching portfolio strategies that have the deprecated field set to campaigns.
Later this year, our systems will start ignoring the target spend field and instead use your daily budget to manage spend. In order to prepare for this change, you should start using your budgets to specify how much you’d like to spend for Maximize Clicks bidding strategies and migrate your campaigns off this field today.

Read on to see how this will affect your API usage.
Affected Target Spend Fields
Google Ads API campaign.target_spend.target_spend_micros
bidding_strategy.target_spend.target_spend_micros
AdWords API Campaign.BiddingStrategyConfiguration.TargetSpendBiddingScheme.spendTarget
SharedBiddingStrategy.TargetSpendBiddingScheme.spendTarget


Change Description
Any mutate operations that set a target spend field for the first time will return an error. You will be able to update a target spend field that currently contain a value, but you cannot set previously empty fields to a new value. Additionally, any operation attaching a bidding strategy to a campaign, where that bidding strategy has a value set for a target spend field, will throw an error. To manage Target Spend on any new campaigns, we recommend using a campaign budget. In each of these disallowed cases an error will be thrown.

Performing any of the disallowed actions above will generate one of the following errors:
  • OPERATION_NOT_PERMITTED_FOR_CONTEXT
  • UNSUPPORTED_FIELD_IS_SET
If you have any questions about this change or any other API feature, please contact us via the forum.

Announcing Google Ads API Doctor

We have heard from users that correctly configuring a client library and provisioning OAuth2 credentials can be challenging, so today we are introducing Google Ads API Doctor, a new tool that will analyze your client library environment. The program will:
  • Verify that your OAuith2 credentials are correctly configured and ready to make API calls.
  • Guide you through fixing any OAuth2 problems it detects and verify the corrected configuration.
The initial version of this tool will help you analyze and fix issues related to OAuth2 configuration, including the following common issues:
  • Invalid refresh token: The program will identify this and guide you through the process to obtain a valid token, back up your configuration file, and write the new value to your active configuration file.
  • Permission denied: There are several OAuth errors that sound similar, such as user permission denied and permission denied. The program identifies that in the first case it is caused by an invalid refresh token and in the second it’s because the Google Ads API is disabled in the Google API Console.
If you want to send the output to support, you can run your scenario with the PII flag to hide your Personally Identifiable Information (PII) and copy the screen output. To gather even more information, you can use the verbose flag to see the low-level JSON that is returned.

We are releasing this project as open source per Google’s open source initiative, and we encourage contributions. See contributing to Google open source to learn more about how to contribute to this project. As always, share your feedback on the Google Ads API forum.

Introducing the Google Ads Query Builder tool

Today we are excited to announce that the Google Ads Query Builder tool is now available on the Google Ads API Developer Site.

The Google Ads API has a robust reporting system that utilizes our new Google Ads Query Language. The language’s syntax allows you to select from all the resources that are available for reporting, and also filter or sort the result set on the server before they are returned to your application.

This tool provides a friendly web interface for you to explore our API’s reporting capabilities, and generate queries that you can copy and paste right into your applications. You can visit the site and try out the tool today!

Example usage of the Google Ads Query Builder: A screenshot showing a sample usage of the Google Ads Query Builder UI, including both filtering and ordering. Happy reporting!

Keeping up to Date with the the Support Library

Posted by Agustin Fonts, Product Manager, Android Support Library

It's important to keep current when you're dealing with technology. That’s why we're constantly working to improve the quality of our software, particularly libraries that are linked into your apps, such as the Support Library.  The Support Library is a suite of libraries that provides backward compatibility along with additional features across many Android releases.


We have just released version 25.2 of the Support Library.  If you're making use of the android.support.v7.media.MediaRouter class in revision 25.1.1 or 25.1.0, we strongly recommend that you update due to a known issue.  If you haven't updated recently, you've missed out on some great bug fixes such as these:


25.2:
  • Corrected a severe mediarouter issue in which using an A2DP Bluetooth device and media routing APIs could cause the device to become unresponsive, requiring a reboot
  • Showing a slide presentation with screen mirroring no longer causes the device to disconnect from Wi-Fi
  • Media button now properly handles media apps that did not register themselves with setMediaButtonReceiver()
  • TextInputLayout correctly overlays hint and text if text is set by XML (AOSP issue 230171)
  • Corrected a memory leak in MediaControllerCompat (AOSP issue 231441)
  • RecyclerView no longer crashes when recycling view holders (AOSP issue 225762)

Reporting (and fixing) a Bug


The Support Library is developed by the Android Framework and Developer Relations teams, and, just like the Android platform, you can file bugs using the AOSP issue tracker, or submit fixes to our Git repository. Your feedback is critical in helping us to make the Support Library the most productive environment to use for developing Android applications.