Posted by Nick Felker, Developer Relations Engineer
Interactive Canvas DevTool Extension
Using Interactive Canvas DevTools
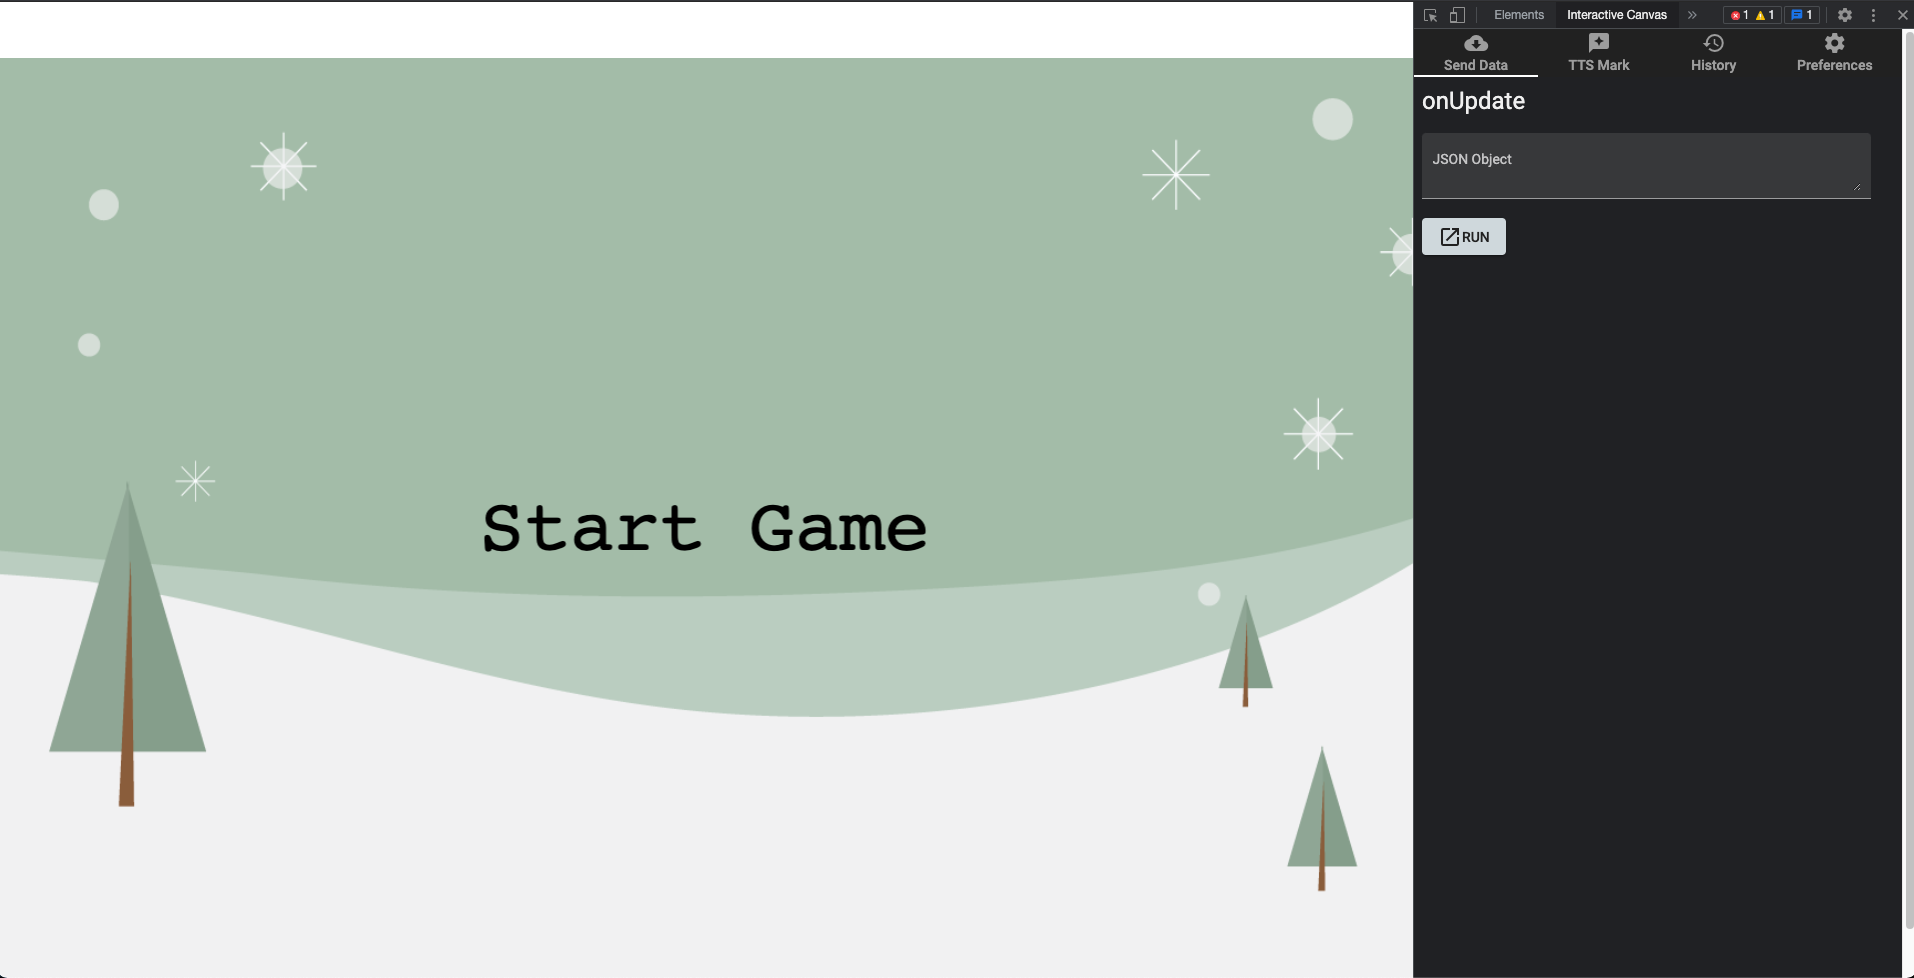
After installing the Interactive Canvas DevTools from the Chrome Web Store, you’ll see a new Interactive Canvas tab when you Open Chrome DevTools.
When you load your web app in your browser, from a publicly hosted URL, localhost, or a remote device on your network, this tab lets you directly interface with the Interactive Canvas callbacks registered on the page to quickly and iteratively test your experience. Suggestion chips are created after every execution to let you replay the same command later.
To get started even faster, you can go to the Preferences tab and click the Import /SDK button. This will open a directory picker. You can select your project’s SDK folder. The extension will identify JSON payloads and TTS marks in your project and surface them as suggestion chips automatically.

JSON historical object changes
When the fields of the JSON object changed, you can view the changes in a colored diff.
Methods that send data to your webhook are instead rerouted to the History tab. This tab hosts a list of every text query and canvas state change in reverse chronological order. This allows you to view how changes in your web app would affect your conversational state. Each time the canvas state changes, you can see a visual representation of which fields changed.
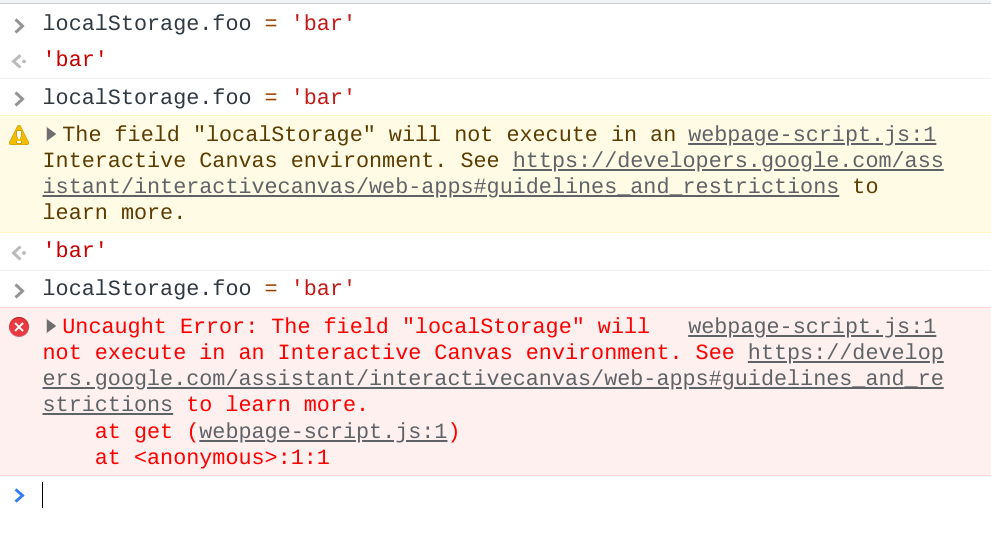
Different levels of notice when using an operation unsupported in Interactive Canvas
Different levels of notice when using an operation unsupported in Interactive Canvas.
There are a number of other features that enhance the developer experience. For example, for browser methods that are not supported in Interactive Canvas, you can optionally log a warning or throw an error when you try to use them. This will make it easier to identify compatibility issues sooner and enforce these policies while debugging.

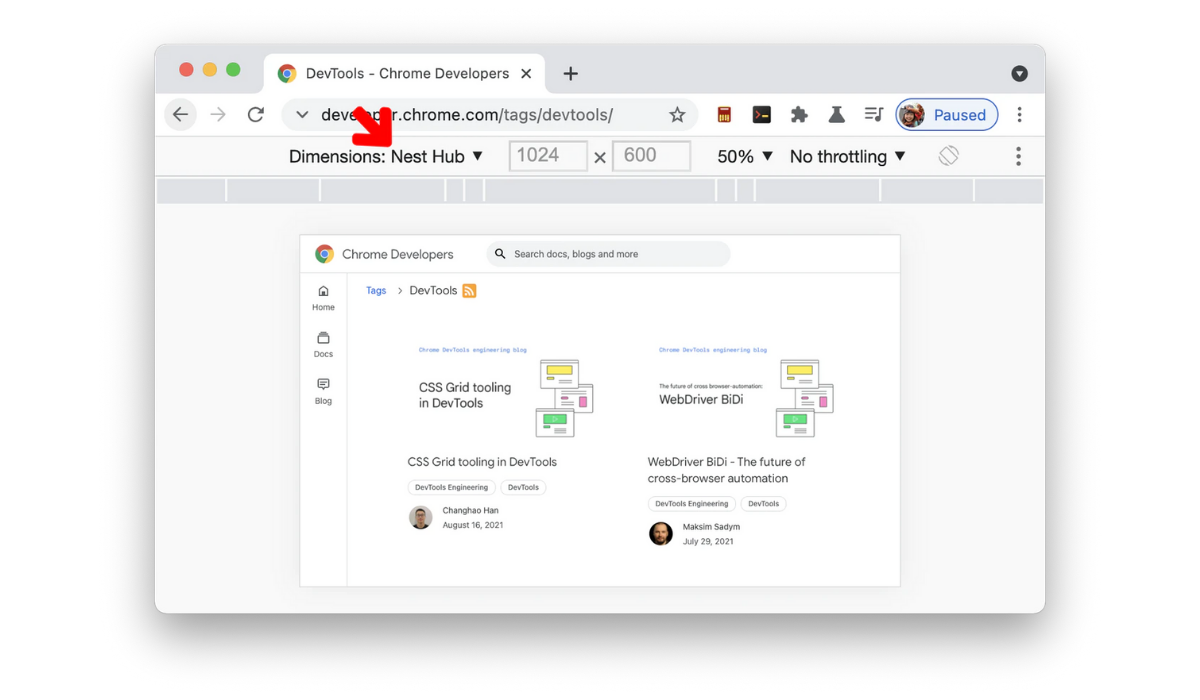
Nest Hub devices in the Device list
You are able to set the window to match the Nest Hub screen.
You can also add a header element onto your page that will help you optimize your layout for a smart display. Combined with the Nest Hub and Nest Hub Max as new device presets in Chrome DevTools, you are able to set your development environment to be an accurate representation of how your Action will look and behave on a physical device.
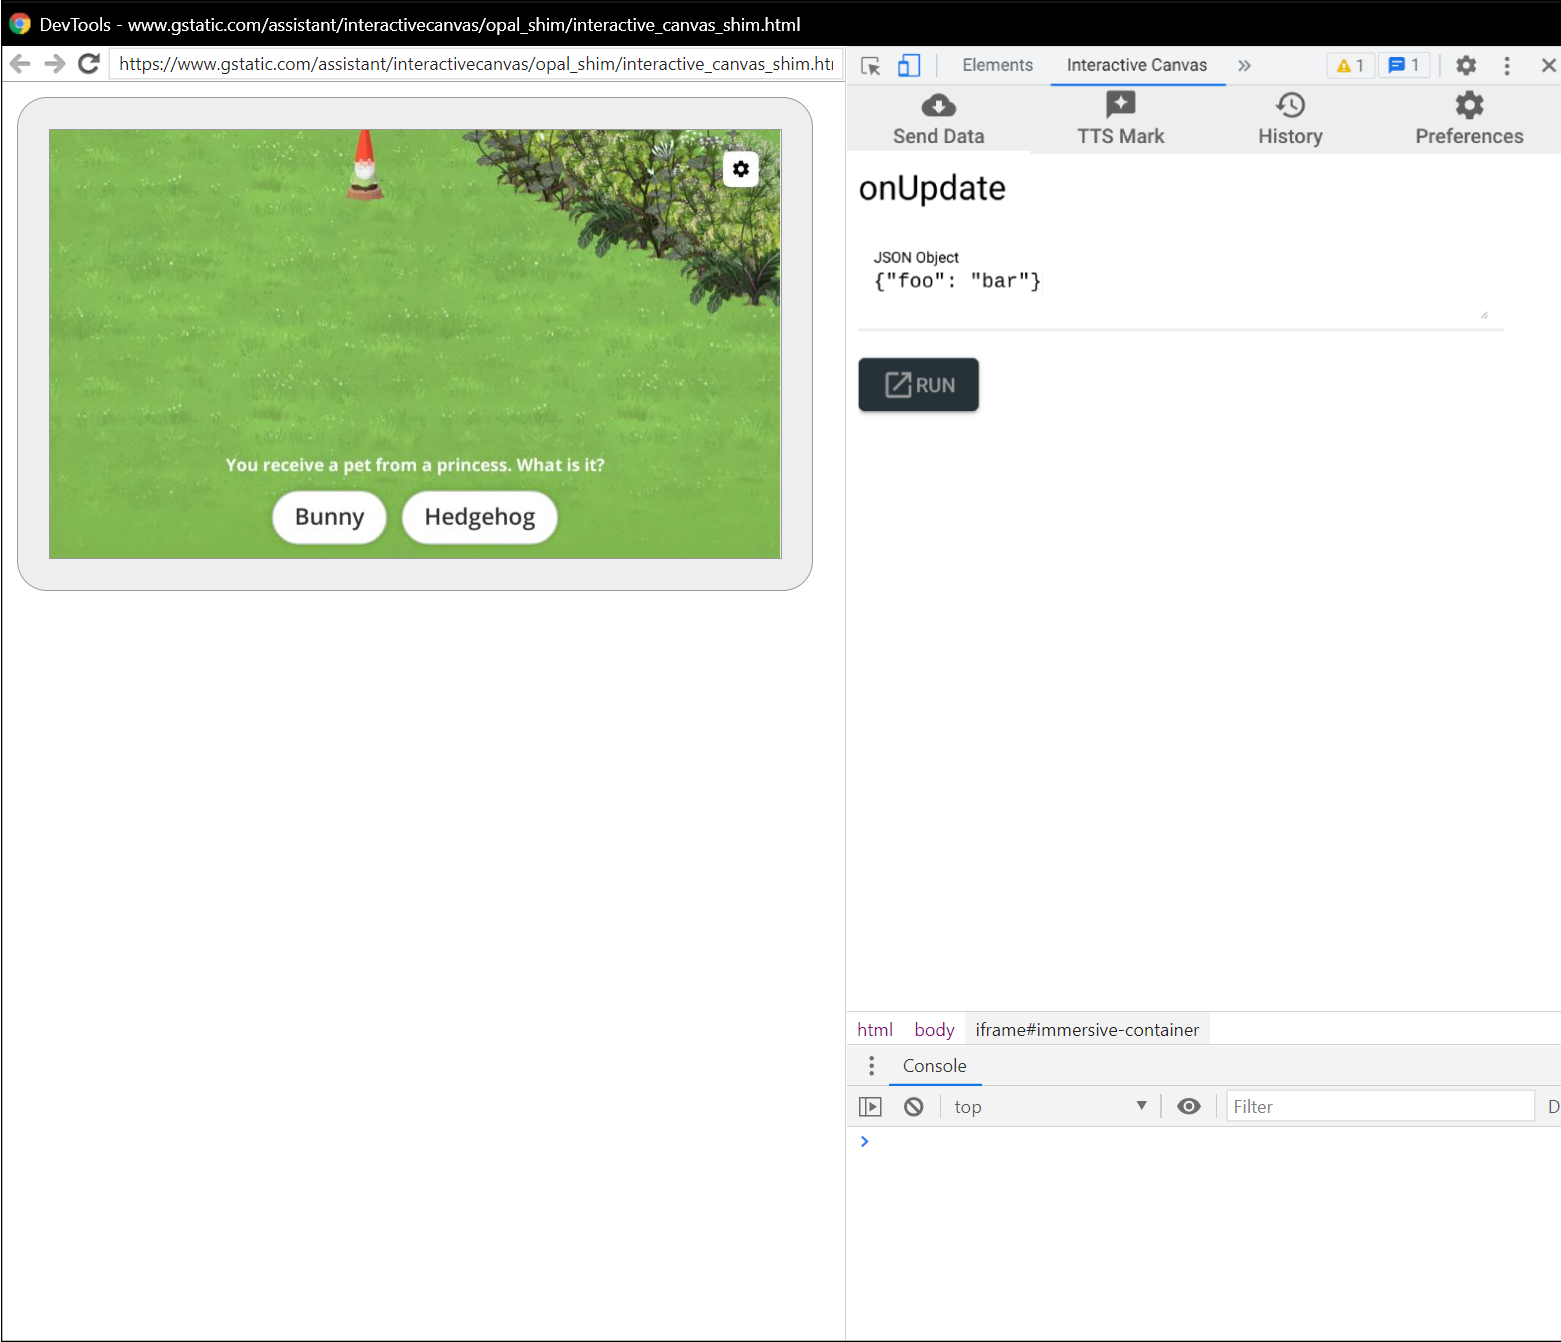
Interactive Canvas tab on a remote device
You can also send data to your remote device.
This extension also works if you have a physical device. If it is on the same network, you can connect to your smart display and open up the Interactive Canvas tab on that remote device. From there, you are able to send commands using the same interface.
You can install the extension now through the Chrome Web Store. We’re also happy to announce that the DevTools are Open Source! The source code for this extension has been published on GitHub, where you can find instructions on how to set up the project locally, and how to submit pull requests.
Thanks for reading! To share your thoughts or questions, join us on Reddit at /r/GoogleAssistantDev.
Follow @ActionsOnGoogle on Twitter for more of our team's updates, and tweet using #AoGDevs to share what you’re working on. Can’t wait to see what you build!
Source: Google Developers Blog
Developer tools to debug WebView in Beta
 Posted by
 Since 2014, Android WebView has paved the way as an updateable system component, delivering stability and performance improvements, modern web platform features, and security patches to Android apps and users. However, updates can be a double edged sword: as much as we strive for stability and backward compatibility, new crashes and breaking changes occasionally slip through. To solve these issues faster, today we're announcing WebView DevTools, a new set of on-device debugging tools to diagnose WebView-caused crashes and misbehaving web platform features.
For your convenience, WebView DevTools comes included as part of WebView itself. The easiest way to launch WebView Devtools is to try out WebView Beta. WebView's beta program is a way for app developers to get WebView several weeks before they reach users, for extra lead time to report compatibility bugs to our team. Starting with today's release (M83), WebView Beta includes a launcher icon for WebView DevTools. Just look for the blue and gray WebView gear icon to get started debugging WebView in your app.
Inspecting a crash in WebView DevTools.
No software is bug-free and loading web content can be challenging, so it's no surprise WebView crashes are a pain point for apps. Worse yet, these crashes are difficult to debug because WebView's Java and C++ stack traces are obfuscated (to minimize APK size for Android users). To help make these crashes more actionable, we're exposing first-class access to WebView's built-in crash reporter. Just open WebView DevTools, tap on "crashes," and you'll see a list of recent WebView-caused crashes from apps on your device. You can use this tool to see if the crash report has been uploaded to our servers, force-upload it if necessary, and subsequently file a bug. This ensures our team has all the information we need to swiftly resolve these crashes and ensure a smoother user experience in your app.
Using flags to highlight WebView usage in Android apps.
However, not all bugs cause crashes. A handful of past WebView releases have broken Android apps due to behavior changes caused by new features. While our team's policy is to roll back features which break compatibility, the chromium team launches several features for WebView in each release, and we often need time to identify the offending feature. WebView DevTools can help here too. Inspired by Google Chrome's chrome://flags tool, which enables compatibility testing with web platform features, we're offering app developers similar controls for experimental features. To get started, open WebView DevTools, tap on "flags," enable or disable any available features, then kill and restart the WebView-based app you're testing. Using WebView DevTools will help us work together to pin down the culprit so we can roll it back. We've also included flags for features slated for upcoming releases, so you can test compatibility even earlier by enabling these features on your test device.
We hope you find WebView DevTools helpful for reporting crashes and testing against new WebView features. Install WebView Beta today to get started with WebView DevTools, and check out the user guide for more tips and tricks.
