Tag Archives: debugging

Google Ads API Video Roundup

The Google Ads Developers Channel is your video source for release notes, best practices, new feature integrations, code walkthroughs, and video tutorials. Check out some of the recently released and popular videos and playlists below, and remember to subscribe to our channel to stay up to date with the latest video content.

Google Ads API Best Practices - Error Handling and Debugging
In this episode of the Google Ads API Best Practices Series, we discuss how to handle errors that may occur when interacting with the Google Ads API, along with tools that may help you debug your applications, such as logging and the REST interface.
Meet the Team with David Wihl
In this video, David Wihl shares a bit about his role as a Developer Relations Engineer at Google and discusses his work in supporting the Performance Max campaign API integration.

[Live Demo] Building a Google Ads API Web App
Getting started with the Google Ads API? In this 8-episode series, we take a deep dive into developing web apps with the Google Ads API, with a focus on the OAuth flow, by building a multi-tenant app entirely from scratch.

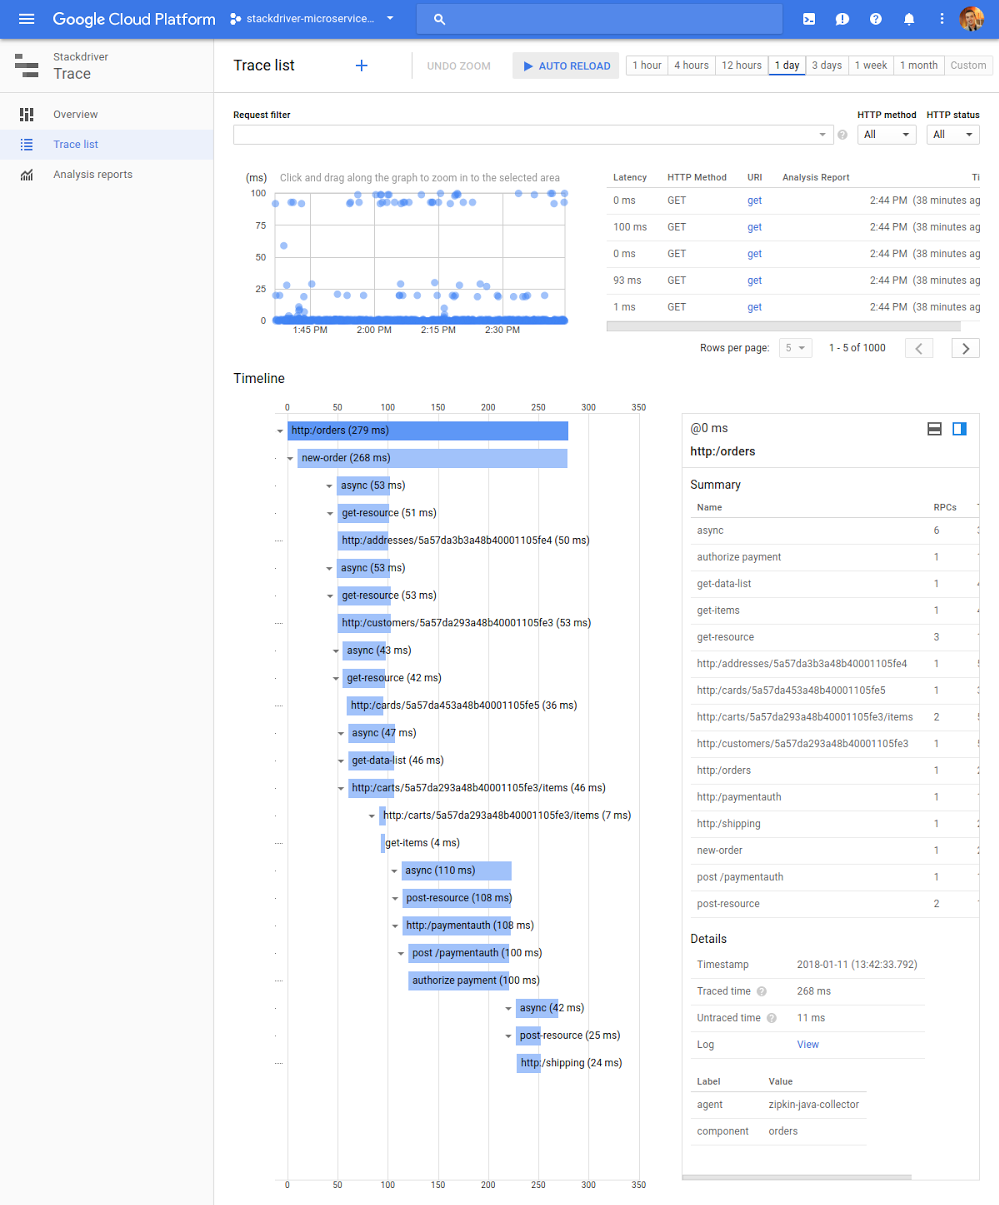
Logging & Monitoring
This miniseries covers the basics of adding logging and monitoring to your Google Ads API integration and then goes into more advanced topics, with a special focus on Cloud tooling. Google Ads Query Language (GAQL)
In this series, we cover everything you need to know about the Google Ads Query Language to make reporting requests against the Google Ads API. We begin with the basics and build in subsequent episodes to cover various nuances of GAQL. We even dive into the various tools available to help you structure your queries. This playlist will equip you with the information you need to know to become a GAQL power user. For additional topics, including Authentication and Authorization and Working with REST, check out the Google Ads API Developer Series.

As always, feel free to reach out to us with any questions via the Google Ads API forum or at [email protected].

Developer tools to debug WebView in Beta

Posted by Nate Fischer, Software Engineer, WebView team

Since 2014, Android WebView has paved the way as an updateable system component, delivering stability and performance improvements, modern web platform features, and security patches to Android apps and users. However, updates can be a double edged sword: as much as we strive for stability and backward compatibility, new crashes and breaking changes occasionally slip through. To solve these issues faster, today we're announcing WebView DevTools, a new set of on-device debugging tools to diagnose WebView-caused crashes and misbehaving web platform features.

For your convenience, WebView DevTools comes included as part of WebView itself. The easiest way to launch WebView Devtools is to try out WebView Beta. WebView's beta program is a way for app developers to get WebView several weeks before they reach users, for extra lead time to report compatibility bugs to our team. Starting with today's release (M83), WebView Beta includes a launcher icon for WebView DevTools. Just look for the blue and gray WebView gear icon to get started debugging WebView in your app.

Inspecting a crash in WebView DevTools.

Inspecting a crash in WebView DevTools.

No software is bug-free and loading web content can be challenging, so it's no surprise WebView crashes are a pain point for apps. Worse yet, these crashes are difficult to debug because WebView's Java and C++ stack traces are obfuscated (to minimize APK size for Android users). To help make these crashes more actionable, we're exposing first-class access to WebView's built-in crash reporter. Just open WebView DevTools, tap on "crashes," and you'll see a list of recent WebView-caused crashes from apps on your device. You can use this tool to see if the crash report has been uploaded to our servers, force-upload it if necessary, and subsequently file a bug. This ensures our team has all the information we need to swiftly resolve these crashes and ensure a smoother user experience in your app.

IUsing flags to highlight WebView usage in Android apps.

Using flags to highlight WebView usage in Android apps.

However, not all bugs cause crashes. A handful of past WebView releases have broken Android apps due to behavior changes caused by new features. While our team's policy is to roll back features which break compatibility, the chromium team launches several features for WebView in each release, and we often need time to identify the offending feature. WebView DevTools can help here too. Inspired by Google Chrome's chrome://flags tool, which enables compatibility testing with web platform features, we're offering app developers similar controls for experimental features. To get started, open WebView DevTools, tap on "flags," enable or disable any available features, then kill and restart the WebView-based app you're testing. Using WebView DevTools will help us work together to pin down the culprit so we can roll it back. We've also included flags for features slated for upcoming releases, so you can test compatibility even earlier by enabling these features on your test device.

We hope you find WebView DevTools helpful for reporting crashes and testing against new WebView features. Install WebView Beta today to get started with WebView DevTools, and check out the user guide for more tips and tricks.

OpenCensus: A Stats Collection and Distributed Tracing Framework

Today we’re pleased to announce the release of OpenCensus, a vendor-neutral open source library for metric collection and tracing. OpenCensus is built to add minimal overhead and be deployed fleet wide, especially for microservice-based architectures.

The Need for Instrumentation & Observability 

As a startup, often the focus is to get an initial version of the product out the door, rapidly prototype and iterate with customers. Most startups start out with monolithic applications as a simple model-view-controller (MVC) web application. As the customer base, code, and number of engineers increase, they migrate from monolithic architecture to a microservices architecture. A microservices architecture has its advantages, but often makes debugging more challenging as traditional debugging and monitoring tools don’t always work in these environments or are designed for monolithic use cases. When operating multiple microservices with strict service level objectives (SLOs), you need insights into the root cause of reliability and performance problems.

Not having proper instrumentation and observability can result in lost engineering hours, violated SLOs and frustrated customers. Instead, diagnostic data should be collected from across the stack. This data can be used for incident management to identify and debug potential bottlenecks or for system tuning and performance improvement.

OpenCensus

At Google scale, an instrumentation layer with minimal overhead is a requirement. As Google grew, we realized the importance of having a highly efficient tracing and stats instrumentation library that could be deployed fleet wide.

OpenCensus is the open source version of Google’s Census library, written based on years of optimization experience. It aims to make the collection and submission of app metrics and traces easier for developers. It is a vendor neutral, single distribution of libraries that automatically collects traces and metrics from your app, displays them locally, and sends them to analysis tools. OpenCensus currently supports Prometheus, SignalFX, Stackdriver and Zipkin.

Developers can use this powerful, out-of-the box library to instrument microservices and send data to any supported backend. For an Application Performance Management (APM) vendor, OpenCensus provides free instrumentation coverage with minimal work, and affords customers a simple setup experience.

Below are Stackdriver Trace and Monitor screenshots showing traces generated from a demo app, which calls Google’s Cloud Bigtable API and uses OpenCensus.


We’d love to hear your feedback on OpenCensus. Try using it in your app, tell us about your success story, and help by contributing to our existing language-specific libraries, or by creating one for an not-yet-supported language. You can also help us integrate OpenCensus with new APM tools!

We hope you find this as useful as we have. Visit opencensus.io for more information.

By Pritam Shah, Census team

XRay: a function call tracing system

At Google we spend a lot of time debugging and tuning the performance of our production systems. Some standard practices when doing this involves using profilers, debuggers, and analysis of logs and execution traces. Doing this at scale, in production, is difficult. One of the ways for getting high fidelity data from production systems is to build applications with instrumentation, and then reconstruct the instrumentation data into a form humans can consume (summary statistics, reports, etc.). Instrumentation comes at a cost though, sometimes too high to make it feasible to deploy in production.

Getting this balance right is hard. This is why we've developed XRay, a function call tracing system that has very little overhead when not enabled, but can be dynamically turned on and only impose moderate costs. XRay works as a combination of compiler-inserted instrumentation points which functionally do nothing (called "nop sleds") and a library that can be enabled and disabled at runtime which replaces the nop sleds with the appropriate instrumentation instructions.

We've been using XRay to debug internal systems, from core infrastructure services like Bigtable to ad serving systems. XRay's detailed function tracing has enabled several teams in Google to debug issues that would be really hard to solve without XRay.

We think XRay is an important piece of technology, not only at Google, but for developers around the world. It's because of this that we're working on making XRay opensource. To kick-start that process, we're releasing a white paper describing the technical details of XRay. In the following weeks, we will be engaging the LLVM community, where we are committed to making XRay available for wide use and distribution.

We hope that by open-sourcing XRay we can contribute to the advancement of debugging real-world applications. We're looking forward to working with the LLVM community and other projects to make the data XRay generates useful for debugging a wide variety of applications.

By Dean Michael Berris, Google Engineering