Posted by Philip Quinn and Wenxin Feng, Research Scientists, Android UX Touch input has traditionally focussed on two-dimensional finger pointing. Beyond tapping and swiping gestures, long pressing has been the main alternative path for interaction. However, a long press is sensed with a time-based threshold where a user’s finger must remain stationary for 400–500 ms. By its nature, a time-based threshold has negative effects for usability and discoverability as the lack of immediate feedback disconnects the user’s action from the system’s response. Fortunately, fingers are dynamic input devices that can express more than just location: when a user touches a surface, their finger can also express some level of force, which can be used as an alternative to a time-based threshold.
While a variety of force-based interactions have been pursued, sensing touch force requires dedicated hardware sensors that are expensive to design and integrate. Further, research indicates that touch force is difficult for people to control, and so most practical force-based interactions focus on discrete levels of force (e.g., a
soft vs.
firm touch) — which do not require the full capabilities of a hardware force sensor.
For a
recent update to the Pixel 4, we developed a method for sensing force gestures that allowed us to deliver a more expressive touch interaction experience By studying how the human finger interacts with touch sensors, we designed the experience to complement and support the long-press interactions that apps already have, but with a more natural gesture. In this post we describe the core principles of touch sensing and finger interaction, how we designed a machine learning algorithm to recognise press gestures from touch sensor data, and how we integrated it into the user experience for Pixel devices.
Touch Sensor Technology and Finger BiomechanicsA capacitive touch sensor is constructed from two conductive electrodes (a
drive electrode and a
sense electrode) that are separated by a non-conductive
dielectric (e.g., glass). The two electrodes form a tiny capacitor (a
cell) that can hold some charge. When a finger (or another conductive object) approaches this cell, it ‘steals’ some of the charge, which can be measured as a drop in capacitance. Importantly, the finger doesn’t have to come into contact with the electrodes (which are protected under another layer of glass) as the amount of charge stolen is inversely proportional to the distance between the finger and the electrodes.
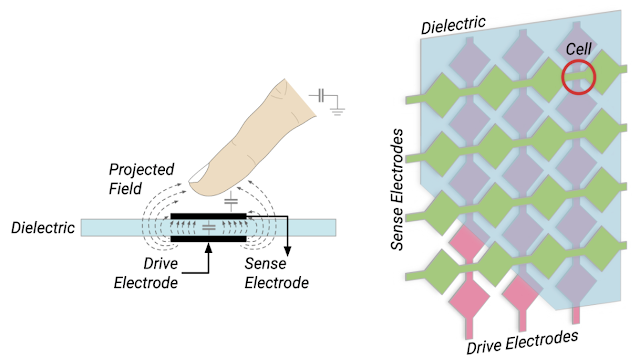 |
| Left: A finger interacts with a touch sensor cell by ‘stealing’ charge from the projected field around two electrodes. Right: A capacitive touch sensor is constructed from rows and columns of electrodes, separated by a dielectric. The electrodes overlap at cells, where capacitance is measured. |
The cells are arranged as a matrix over the display of a device, but with a much lower density than the display pixels. For instance, the Pixel 4 has a 2280 × 1080 pixel display, but a 32 × 15 cell touch sensor. When scanned at a high resolution (at least 120 Hz), readings from these cells form a video of the finger’s interaction.
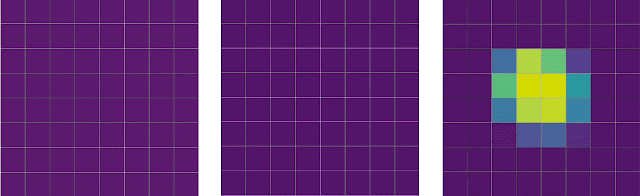 |
| Slowed touch sensor recordings of a user tapping (left), pressing (middle), and scrolling (right). |
Capacitive touch sensors don’t respond to changes in force
per se, but are tuned to be highly sensitive to changes in distance within a couple of millimeters above the display. That is, a finger contact on the display glass should saturate the sensor near its centre, but will retain a high dynamic range around the perimeter of the finger’s contact (where the finger curls up).
When a user’s finger presses against a surface, its soft tissue deforms and spreads out. The nature of this spread depends on the size and shape of the user’s finger, and its angle to the screen. At a high level, we can observe a couple of key features in this spread (shown in the figures): it is asymmetric around the initial contact point, and the overall centre of mass shifts along the axis of the finger. This is also a dynamic change that occurs over some period of time, which differentiates it from contacts that have a long duration or a large area.
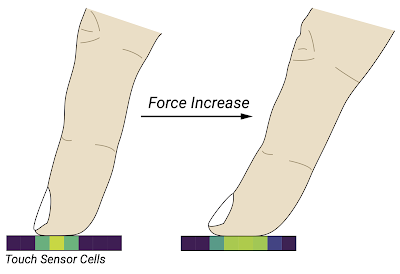 |
| Touch sensor signals are saturated around the centre of the finger’s contact, but fall off at the edges. This allows us to sense small deformations in the finger’s contact shape caused by changes in the finger’s force. |
However, the differences between users (and fingers) makes it difficult to encode these observations with heuristic rules. We therefore designed a machine learning solution that would allow us to learn these features and their variances directly from user interaction samples.
Machine Learning for Touch InteractionWe approached the analysis of these touch signals as a gesture classification problem. That is, rather than trying to predict an abstract parameter, such as force or contact spread, we wanted to sense a
press gesture — as if engaging a button or a switch. This allowed us to connect the classification to a well-defined user experience, and allowed users to perform the gesture during training at a comfortable force and posture.
Any classification model we designed had to operate within users’ high expectations for touch experiences. In particular, touch interaction is extremely latency-sensitive and demands real-time feedback. Users expect applications to be responsive to their finger movements as they make them, and application developers expect the system to deliver timely information about the gestures a user is performing. This means that classification of a press gesture needs to occur in real-time, and be able to trigger an interaction at the moment the finger’s force reaches its apex.
We therefore designed a neural network that combined
convolutional (CNN) and
recurrent (RNN) components. The CNN could attend to the spatial features we observed in the signal, while the RNN could attend to their temporal development. The RNN also helps provide a consistent runtime experience: each frame is processed by the network as it is received from the touch sensor, and the RNN state vectors are preserved between frames (rather than processing them in batches). The network was intentionally kept simple to minimise on-device inference costs when running concurrently with other applications (taking approximately 50 µs of processing per frame and less than 1 MB of memory using
TensorFlow Lite).
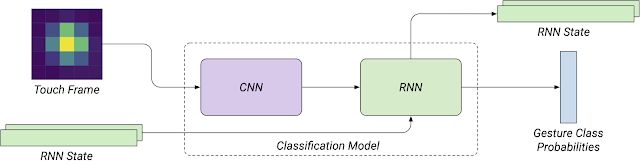 |
| An overview of the classification model’s architecture. |
The model was trained on a dataset of press gestures and other common touch interactions (tapping, scrolling, dragging, and long-pressing without force). As the model would be evaluated after each frame, we designed a loss function that temporally shaped the label probability distribution of each sample, and applied a time-increasing weight to errors. This ensured that the output probabilities were temporally smooth and converged towards the correct gesture classification.
User Experience IntegrationOur UX research found that it was hard for users to discover force-based interactions, and that users frequently confused a force press with a long press because of the difficulty in coordinating the amount of force they were applying with the duration of their contact. Rather than creating a new interaction modality based on force, we therefore focussed on improving the user experience of long press interactions by accelerating them with force in a unified
press gesture. A press gesture has the same outcome as a long press gesture, whose time threshold remains effective, but provides a stronger connection between the outcome and the user’s action when force is used.
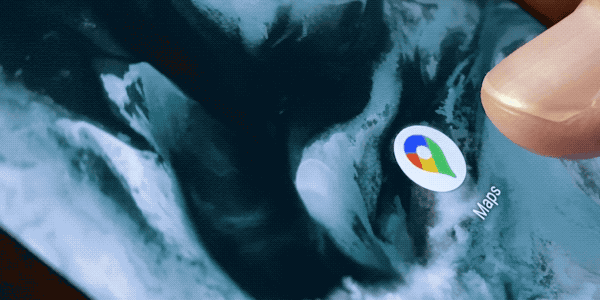 |
| A user long pressing (left) and firmly pressing (right) on a launcher icon. |
This also means that users can take advantage of this gesture without developers needing to update their apps. Applications that use Android’s
GestureDetector or
View APIs will automatically get these press signals through their existing long-press handlers. Developers that implement custom long-press detection logic can receive these press signals through the
MotionEvent classification API introduced in Android Q.
Through this integration of machine-learning algorithms and careful interaction design, we were able to deliver a more expressive touch experience for Pixel users. We plan to continue researching and developing these capabilities to refine the touch experience on Pixel, and explore new forms of touch interaction.
AcknowledgementsThis project is a collaborative effort between the Android UX, Pixel software, and Android framework teams.