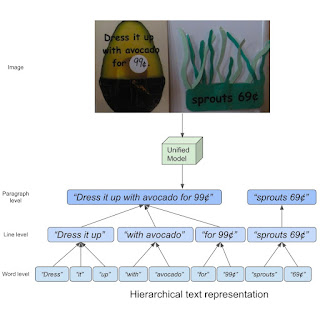
Visual language is the form of communication that relies on pictorial symbols outside of text to convey information. It is ubiquitous in our digital life in the form of iconography, infographics, tables, plots, and charts, extending to the real world in street signs, comic books, food labels, etc. For that reason, having computers better understand this type of media can help with scientific communication and discovery, accessibility, and data transparency.
While computer vision models have made tremendous progress using learning-based solutions since the advent of ImageNet, the focus has been on natural images, where all sorts of tasks, such as classification, visual question answering (VQA), captioning, detection and segmentation, have been defined, studied and in some cases advanced to reach human performance. However, visual language has not garnered a similar level of attention, possibly because of the lack of large-scale training sets in this space. But over the last few years, new academic datasets have been created with the goal of evaluating question answering systems on visual language images, like PlotQA, InfographicsVQA, and ChartQA.
 |
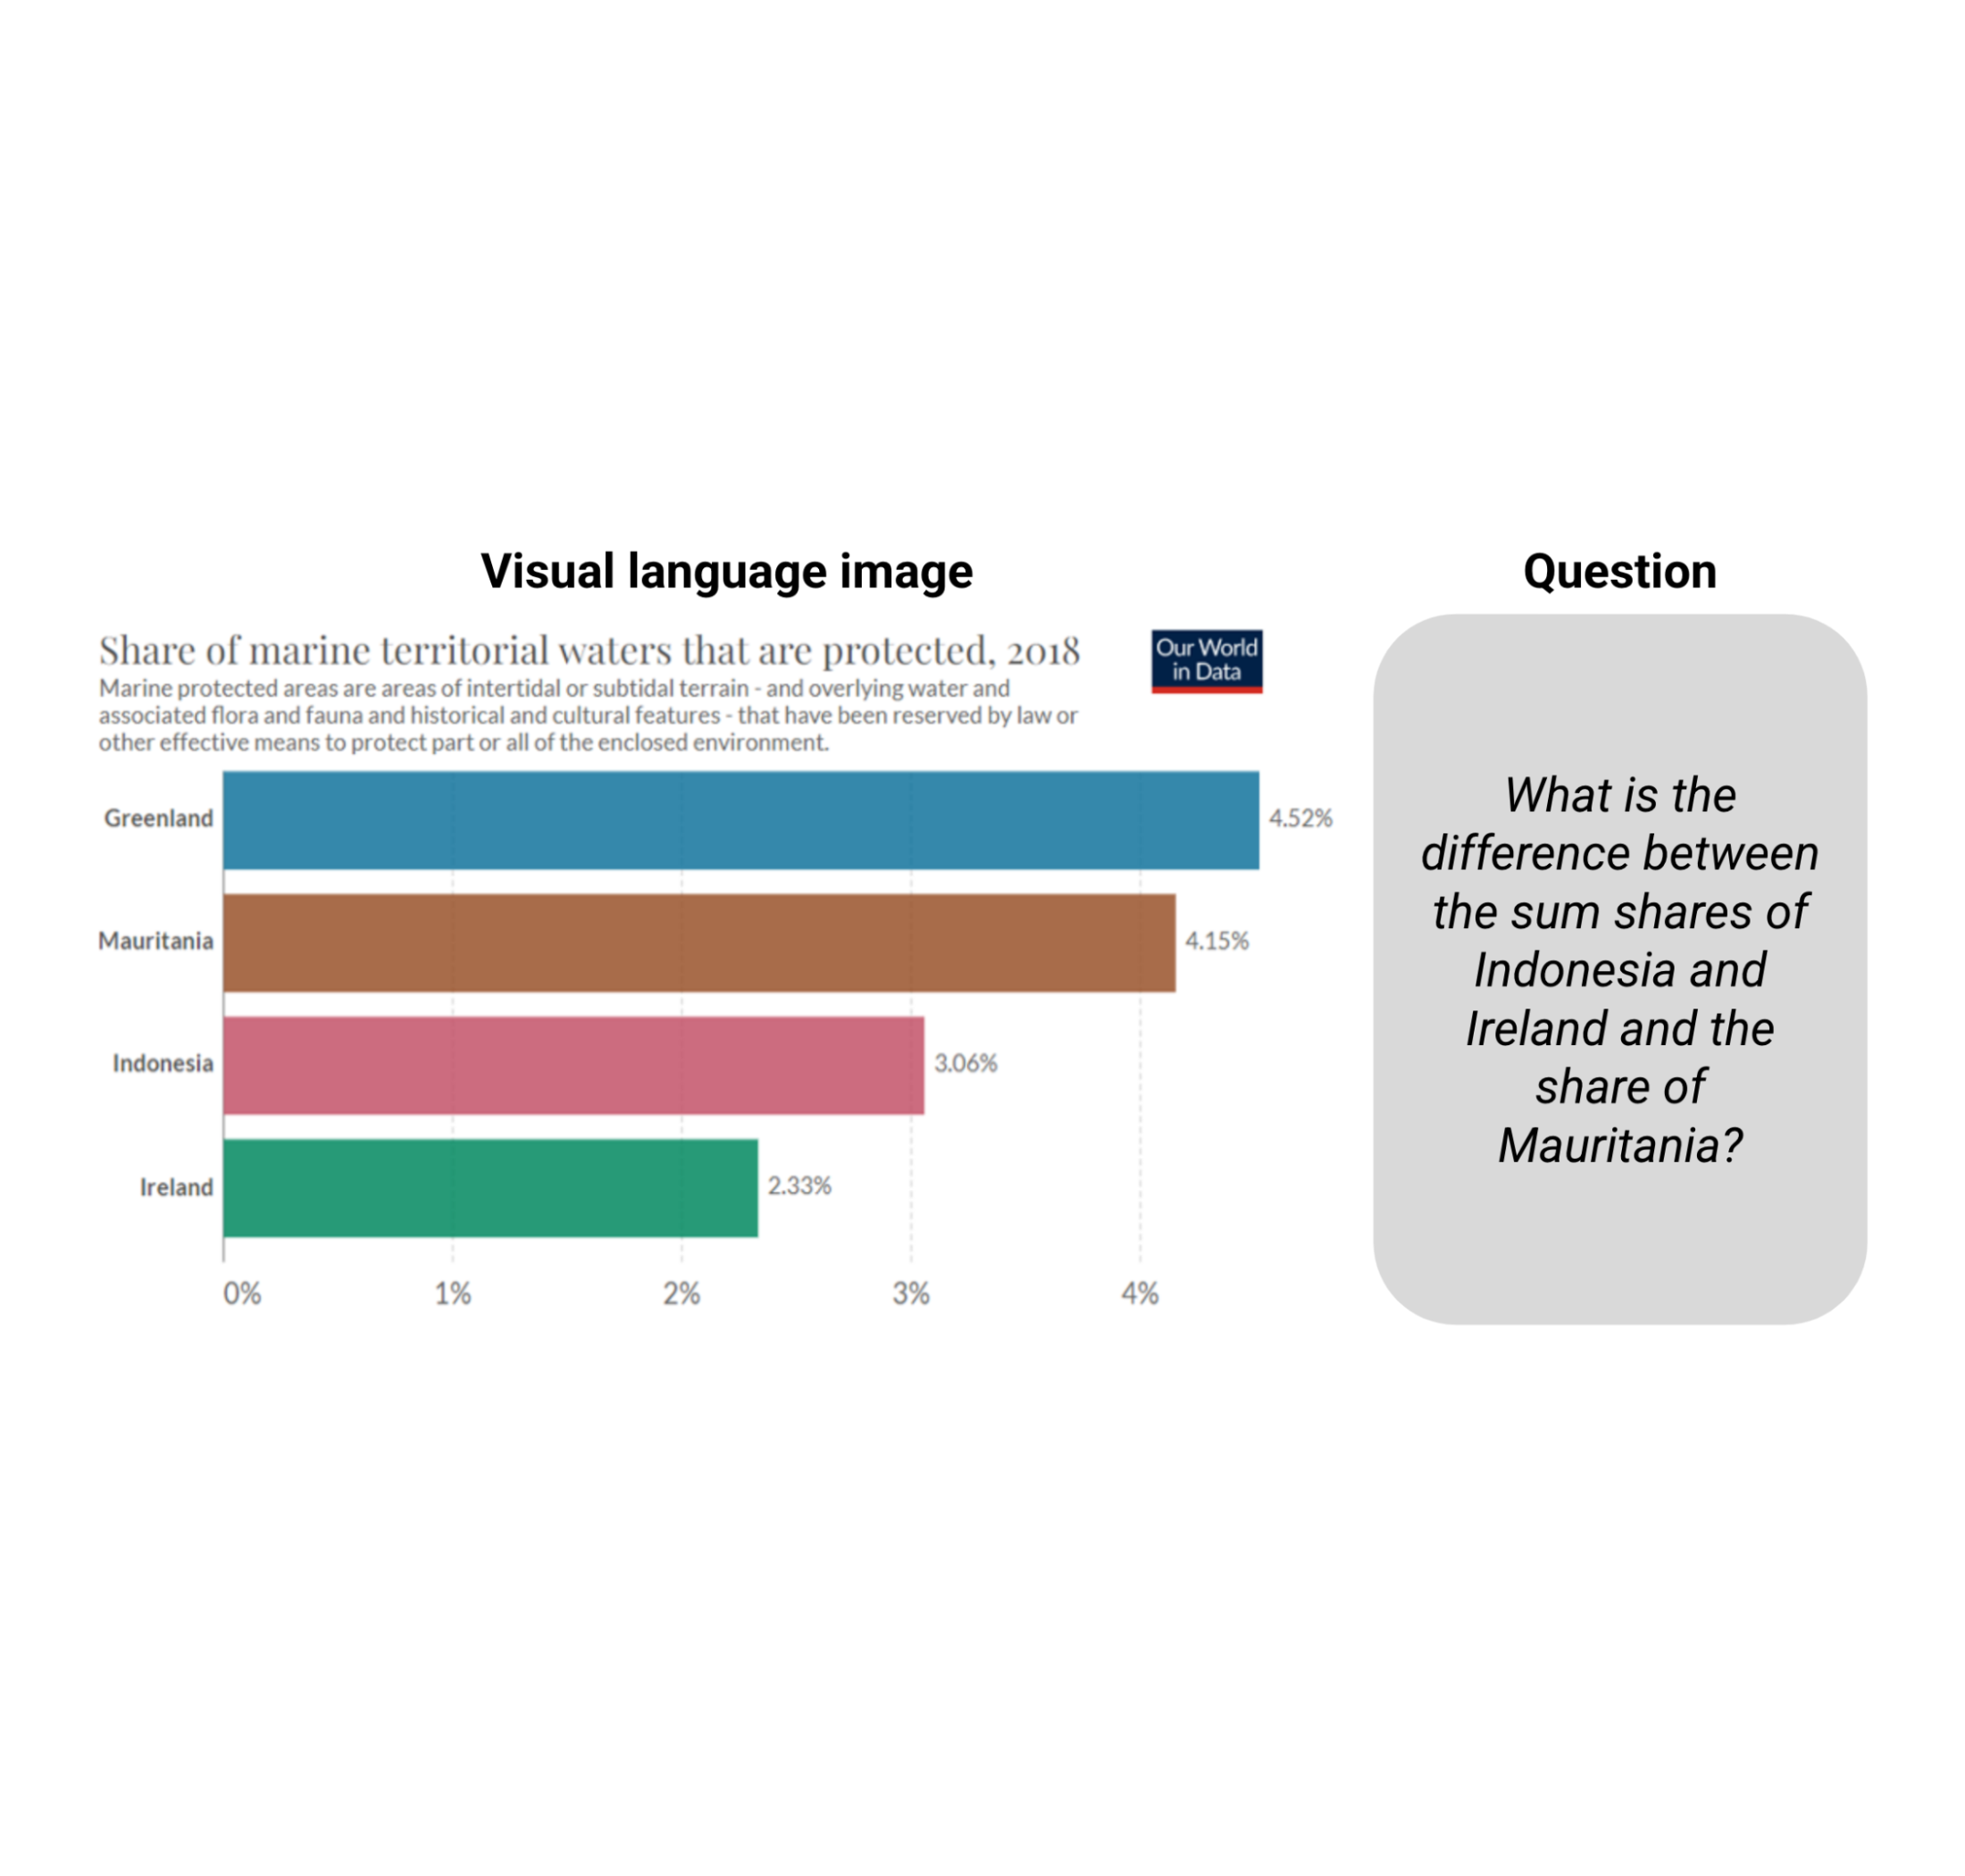
| Example from ChartQA. Answering the question requires reading the information and computing the sum and the difference. |
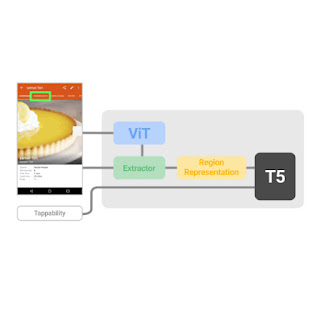
Existing models built for these tasks relied on integrating optical character recognition (OCR) information and their coordinates into larger pipelines but the process is error prone, slow, and generalizes poorly. The prevalence of these methods was because existing end-to-end computer vision models based on convolutional neural networks (CNNs) or transformers pre-trained on natural images could not be easily adapted to visual language. But existing models are ill-prepared for the challenges in answering questions on charts, including reading the relative height of bars or the angle of slices in pie charts, understanding axis scales, correctly mapping pictograms with their legend values with colors, sizes and textures, and finally performing numerical operations with the extracted numbers.
In light of these challenges, we propose “MatCha: Enhancing Visual Language Pretraining with Math Reasoning and Chart Derendering”. MatCha, which stands for math and charts, is a pixels-to-text foundation model (a pre-trained model with built-in inductive biases that can be fine-tuned for multiple applications) trained on two complementary tasks: (a) chart de-rendering and (b) math reasoning. In chart de-rendering, given a plot or chart, the image-to-text model is required to generate its underlying data table or the code used to render it. For math reasoning pre-training, we pick textual numerical reasoning datasets and render the input into images, which the image-to-text model needs to decode for answers. We also propose “DePlot: One-shot visual language reasoning by plot-to-table translation”, a model built on top of MatCha for one-shot reasoning on charts via translation to tables. With these methods we surpass the previous state of the art in ChartQA by more than 20% and match the best summarization systems that have 1000 times more parameters. Both papers will be presented at ACL2023.
Chart de-rendering
Plots and charts are usually generated by an underlying data table and a piece of code. The code defines the overall layout of the figure (e.g., type, direction, color/shape scheme) and the underlying data table establishes the actual numbers and their groupings. Both the data and code are sent to a compiler/rendering engine to create the final image. To understand a chart, one needs to discover the visual patterns in the image and effectively parse and group them to extract the key information. Reversing the plot rendering process demands all such capabilities and can thus serve as an ideal pre-training task.
 |
| A chart created from a table in the Airbus A380 Wikipedia page using random plotting options. The pre-training task for MatCha consists of recovering the source table or the source code from the image. |
In practice, it is challenging to simultaneously obtain charts, their underlying data tables, and their rendering code. To collect sufficient pre-training data, we independently accumulate [chart, code] and [chart, table] pairs. For [chart, code], we crawl all GitHub IPython notebooks with appropriate licenses and extract blocks with figures. A figure and the code block right before it are saved as a [chart, code] pair. For [chart, table] pairs, we explored two sources. For the first source, synthetic data, we manually write code to convert web-crawled Wikipedia tables from the TaPas codebase to charts. We sampled from and combined several plotting options depending on the column types. In addition, we also add [chart, table] pairs generated in PlotQA to diversify the pre-training corpus. The second source is web-crawled [chart, table] pairs. We directly use the [chart, table] pairs crawled in the ChartQA training set, containing around 20k pairs in total from four websites: Statista, Pew, Our World in Data, and OECD.
Math reasoning
We incorporate numerical reasoning knowledge into MatCha by learning math reasoning skills from textual math datasets. We use two existing textual math reasoning datasets, MATH and DROP for pre-training. MATH is synthetically created, containing two million training examples per module (type) of questions. DROP is a reading-comprehension–style QA dataset where the input is a paragraph context and a question.
To solve questions in DROP, the model needs to read the paragraph, extract relevant numbers and perform numerical computation. We found both datasets to be complementary. MATH contains a large number of questions across different categories, which helps us identify math operations needed to explicitly inject into the model. DROP’s reading-comprehension format resembles the typical QA format wherein models simultaneously perform information extraction and reasoning. In practice, we render inputs of both datasets into images. The model is trained to decode the answer.
 |
| To improve the math reasoning skills of MatCha we incorporate examples from MATH and DROP into the pre-training objective, by rendering the input text as images. |
End-to-end results
We use a Pix2Struct model backbone, which is an image-to-text transformer tailored for website understanding, and pre-train it with the two tasks described above. We demonstrate the strengths of MatCha by fine-tuning it on several visual language tasks — tasks involving charts and plots for question answering and summarization where no access to the underlying table is possible. MatCha surpasses previous models’ performance by a large margin and also outperforms the previous state of the art, which assumes access to underlying tables.
In the figure below, we first evaluate two baseline models that incorporate information from an OCR pipeline, which until recently was the standard approach for working with charts. The first is based on T5, the second on VisionTaPas. We also compare against PaLI-17B, which is a large (~1000 times larger than the other models) image plus text-to-text transformer trained on a diverse set of tasks but with limited capabilities for reading text and other forms of visual language. Finally, we report the Pix2Struct and MatCha model results.
 |
| Experimental results on two chart QA benchmarks ChartQA & PlotQA (using relaxed accuracy) and a chart summarization benchmark chart-to-text (using BLEU4). Matcha surpasses the state of the art by a large margin on QA, compared to larger models, and matches these larger models on summarization. |
For QA datasets, we use the official relaxed accuracy metric that allows for small relative errors in numerical outputs. For chart-to-text summarization, we report BLEU scores. MatCha achieves noticeably improved results compared to baselines for question answering, and comparable results to PaLI in summarization, where large size and extensive long text/captioning generation pre-training are advantageous for this kind of long-form text generation.
Derendering plus large language model chains
While extremely performant for their number of parameters, particularly on extractive tasks, we observed that fine-tuned MatCha models could still struggle with end-to-end complex reasoning (e.g., mathematical operations involving large numbers or multiple steps). Thus, we also propose a two-step method to tackle this: 1) a model reads a chart, then outputs the underlying table, 2) a large language model (LLM) reads this output and then tries to answer the question solely based on the textual input.
For the first model, we fine-tuned MatCha solely on the chart-to-table task, increasing the output sequence length to guarantee it could recover all or most of the information in the chart. DePlot is the resulting model. In the second stage, any LLM (such as FlanPaLM or Codex) can be used for the task, and we can rely on the standard methods to increase performance on LLMs, for example chain-of-thought and self-consistency. We also experimented with program-of-thoughts where the model produces executable Python code to offload complex computations.
 |
| An illustration of the DePlot+LLM method. This is a real example using FlanPaLM and Codex. The blue boxes are input to the LLM and the red boxes contain the answer generated by the LLMs. We highlight some of the key reasoning steps in each answer. |
As shown in the example above, the DePlot model in combination with LLMs outperforms fine-tuned models by a significant margin, especially so in the human-sourced portion of ChartQA, where the questions are more natural but demand more difficult reasoning. Furthermore, DePlot+LLM can do so without access to any training data.
We have released the new models and code at our GitHub repo, where you can try it out yourself in colab. Checkout the papers for MatCha and DePlot for more details on the experimental results. We hope that our results can benefit the research community and make the information in charts and plots more accessible to everyone.
Acknowledgements
This work was carried out by Fangyu Liu, Julian Martin Eisenschlos, Francesco Piccinno, Syrine Krichene, Chenxi Pang, Kenton Lee, Mandar Joshi, Wenhu Chen and Yasemin Altun from our Language Team as part of Fangyu's internship project. Nigel Collier from Cambridge also was a collaborator. We would like to thank Joshua Howland, Alex Polozov, Shrestha Basu Mallick, Massimo Nicosia and William Cohen for their valuable comments and suggestions.