Tag Archives: Vision Research

Scaling vision transformers to 22 billion parameters

Large Language Models (LLMs) like PaLM or GPT-3 showed that scaling transformers to hundreds of billions of parameters improves performance and unlocks emergent abilities. The biggest dense models for image understanding, however, have reached only 4 billion parameters, despite research indicating that promising multimodal models like PaLI continue to benefit from scaling vision models alongside their language counterparts. Motivated by this, and the results from scaling LLMs, we decided to undertake the next step in the journey of scaling the Vision Transformer.

In “Scaling Vision Transformers to 22 Billion Parameters”, we introduce the biggest dense vision model, ViT-22B. It is 5.5x larger than the previous largest vision backbone, ViT-e, which has 4 billion parameters. To enable this scaling, ViT-22B incorporates ideas from scaling text models like PaLM, with improvements to both training stability (using QK normalization) and training efficiency (with a novel approach called asynchronous parallel linear operations). As a result of its modified architecture, efficient sharding recipe, and bespoke implementation, it was able to be trained on Cloud TPUs with a high hardware utilization1. ViT-22B advances the state of the art on many vision tasks using frozen representations, or with full fine-tuning. Further, the model has also been successfully used in PaLM-e, which showed that a large model combining ViT-22B with a language model can significantly advance the state of the art in robotics tasks.


Architecture

Our work builds on many advances from LLMs, such as PaLM and GPT-3. Compared to the standard Vision Transformer architecture, we use parallel layers, an approach in which attention and MLP blocks are executed in parallel, instead of sequentially as in the standard Transformer. This approach was used in PaLM and reduced training time by 15%.

Secondly, ViT-22B omits biases in the QKV projections, part of the self-attention mechanism, and in the LayerNorms, which increases utilization by 3%. The diagram below shows the modified transformer architecture used in ViT-22B:

ViT-22B transformer encoder architecture uses parallel feed-forward layers, omits biases in QKV and LayerNorm layers and normalizes Query and Key projections.

Models at this scale necessitate “sharding” — distributing the model parameters in different compute devices. Alongside this, we also shard the activations (the intermediate representations of an input). Even something as simple as a matrix multiplication necessitates extra care, as both the input and the matrix itself are distributed across devices. We develop an approach called asynchronous parallel linear operations, whereby communications of activations and weights between devices occur at the same time as computations in the matrix multiply unit (the part of the TPU holding the vast majority of the computational capacity). This asynchronous approach minimizes the time waiting on incoming communication, thus increasing device efficiency. The animation below shows an example computation and communication pattern for a matrix multiplication.

Asynchronized parallel linear operation. The goal is to compute the matrix multiplication y = Ax, but both the matrix A and activation x are distributed across different devices. Here we illustrate how it can be done with overlapping communication and computation across devices. The matrix A is column-sharded across the devices, each holding a contiguous slice, each block represented as Aij. More details are in the paper.

At first, the new model scale resulted in severe training instabilities. The normalization approach of Gilmer et al. (2023, upcoming) resolved these issues, enabling smooth and stable model training; this is illustrated below with example training progressions.

The effect of normalizing the queries and keys (QK normalization) in the self-attention layer on the training dynamics. Without QK normalization (red) gradients become unstable and the training loss diverges.

Results

Here we highlight some results of ViT-22B. Note that in the paper we also explore several other problem domains, like video classification, depth estimation, and semantic segmentation.

To illustrate the richness of the learned representation, we train a text model to produce representations that align text and image representations (using LiT-tuning). Below we show several results for out-of-distribution images generated by Parti and Imagen:

Examples of image+text understanding for ViT-22B paired with a text model. The graph shows normalized probability distribution for each description of an image.

Human object recognition alignment

To find out how aligned ViT-22B classification decisions are with human classification decisions, we evaluated ViT-22B fine-tuned with different resolutions on out-of-distribution (OOD) datasets for which human comparison data is available via the model-vs-human toolbox. This toolbox measures three key metrics: How well do models cope with distortions (accuracy)? How different are human and model accuracies (accuracy difference)? Finally, how similar are human and model error patterns (error consistency)? While not all fine-tuning resolutions perform equally well, ViT-22B variants are state of the art for all three metrics. Furthermore, the ViT-22B models also have the highest ever recorded shape bias in vision models. This means that they mostly use object shape, rather than object texture, to inform classification decisions — a strategy known from human perception (which has a shape bias of 96%). Standard models (e.g., ResNet-50, which has aa ~20–30% shape bias) often classify images like the cat with elephant texture below according to the texture (elephant); models with a high shape bias tend to focus on the shape instead (cat). While there are still many important differences between human and model perception, ViT-22B shows increased similarities to human visual object recognition.

Cat or elephant? Car or clock? Bird or bicycle? Example images with the shape of one object and the texture of a different object, used to measure shape/texture bias.
Shape bias evaluation (higher = more shape-biased). Many vision models have a low shape / high texture bias, whereas ViT-22B fine-tuned on ImageNet (red, green, blue trained on 4B images as indicated by brackets after model names, unless trained on ImageNet only) have the highest shape bias recorded in a ML model to date, bringing them closer to a human-like shape bias.

Out-of-distribution performance

Measuring performance on OOD datasets helps assess generalization. In this experiment we construct label-maps (mappings of labels between datasets) from JFT to ImageNet and also from ImageNet to different out-of-distribution datasets like ObjectNet (results after pre-training on this data shown in the left curve below). Then the models are fully fine-tuned on ImageNet.

We observe that scaling Vision Transformers increases OOD performance: even though ImageNet accuracy saturates, we see a significant increase on ObjectNet from ViT-e to ViT-22B (shown by the three orange dots in the upper right below).

Even though ImageNet accuracy saturates, we see a significant increase in performance on ObjectNet from ViT-e/14 to ViT-22B.

Linear probe

Linear probe is a technique where a single linear layer is trained on top of a frozen model. Compared to full fine-tuning, this is much cheaper to train and easier to set up. We observed that the linear probe of ViT-22B performance approaches that of state-of-the-art full fine-tuning of smaller models using high-resolution images (training with higher resolution is generally much more expensive, but for many tasks it yields better results). Here are results of a linear probe trained on the ImageNet dataset and evaluated on the ImageNet validation dataset and other OOD ImageNet datasets.

Linear probe results trained on ImageNet, evaluated on Imagenet-ReaL, ImageNet-v2, ObjectNet, ImageNet-R and ImageNet-A datasets. High-resolution fine-tuned ViT-e/14 provided as a reference.

Distillation

The knowledge of the bigger model can be transferred to a smaller model using the distillation method. This is helpful as big models are slower and more expensive to use. We found that ViT-22B knowledge can be transferred to smaller models like ViT-B/16 and ViT-L/16, achieving a new state of the art on ImageNet for those model sizes.


Model Approach (dataset) ImageNet1k Accuracy
ViT-B/16       Transformers for Image Recognition at Scale (JFT)       84.2
Scaling Vision Transformers (JFT) 86.6
DeiT III: Revenge of the ViT (INet21k) 86.7
Distilled from ViT-22B (JFT) 88.6
   
ViT-L/16 Transformers for Image Recognition at Scale (JFT) 87.1
Scaling Vision Transformers (JFT) 88.5
DeiT III: Revenge of the ViT (INet21k) 87.7
Distilled from ViT-22B (JFT) 89.6


Fairness and bias

ML models can be susceptible to unintended unfair biases, such as picking up spurious correlations (measured using demographic parity) or having performance gaps across subgroups. We show that scaling up the size helps in mitigating such issues.

First, scale offers a more favorable tradeoff frontier — performance improves with scale even when the model is post-processed after training to control its level of demographic parity below a prescribed, tolerable level. Importantly, this holds not only when performance is measured in terms of accuracy, but also other metrics, such as calibration, which is a statistical measure of the truthfulness of the model's estimated probabilities. Second, classification of all subgroups tends to improve with scale as demonstrated below. Third, ViT-22B reduces the performance gap across subgroups.


Top: Accuracy for each subgroup in CelebA before debiasing. Bottom: The y-axis shows the absolute difference in performance across the two specific subgroups highlighted in this example: females and males. ViT-22B has a small gap in performance compared to smaller ViT architectures.

Conclusions

We have presented ViT-22B, currently the largest vision transformer model at 22 billion parameters. With small but critical changes to the original architecture, we achieved excellent hardware utilization and training stability, yielding a model that advances the state of the art on several benchmarks. Great performance can be achieved using the frozen model to produce embeddings and then training thin layers on top. Our evaluations further show that ViT-22B shows increased similarities to human visual perception when it comes to shape and texture bias, and offers benefits in fairness and robustness, when compared to existing models.


Acknowledgements

This is a joint work of Mostafa Dehghani, Josip Djolonga, Basil Mustafa, Piotr Padlewski, Jonathan Heek, Justin Gilmer, Andreas Steiner, Mathilde Caron, Robert Geirhos, Ibrahim Alabdulmohsin, Rodolphe Jenatton, Lucas Beyer, Michael Tschannen, Anurag Arnab, Xiao Wang, Carlos Riquelme, Matthias Minderer, Joan Puigcerver, Utku Evci, Manoj Kumar, Sjoerd van Steenkiste, Gamaleldin Fathy, Elsayed Aravindh Mahendran, Fisher Yu, Avital Oliver, Fantine Huot, Jasmijn Bastings, Mark Patrick Collier, Alexey Gritsenko, Vighnesh Birodkar, Cristina Vasconcelos, Yi Tay, Thomas Mensink, Alexander Kolesnikov, Filip Pavetić, Dustin Tran, Thomas Kipf, Mario Lučić, Xiaohua Zhai, Daniel Keysers Jeremiah Harmsen, and Neil Houlsby

We would like to thank Jasper Uijlings, Jeremy Cohen, Arushi Goel, Radu Soricut, Xingyi Zhou, Lluis Castrejon, Adam Paszke, Joelle Barral, Federico Lebron, Blake Hechtman, and Peter Hawkins. Their expertise and unwavering support played a crucial role in the completion of this paper. We also acknowledge the collaboration and dedication of the talented researchers and engineers at Google Research.


1Note: ViT-22B has 54.9% model FLOPs utilization (MFU) while PaLM reported 46.2% MFU and we measured 44.0% MFU for ViT-e on the same hardware. 

Source: Google AI Blog


Introducing StylEx: A New Approach for Visual Explanation of Classifiers

Neural networks can perform certain tasks remarkably well, but understanding how they reach their decisions — e.g., identifying which signals in an image cause a model to determine it to be of one class and not another — is often a mystery. Explaining a neural model’s decision process may have high social impact in certain areas, such as analysis of medical images and autonomous driving, where human oversight is critical. These insights can also be helpful in guiding health care providers, revealing model biases, providing support for downstream decision makers, and even aiding scientific discovery.

Previous approaches for visual explanations of classifiers, such as attention maps (e.g., Grad-CAM), highlight which regions in an image affect the classification, but they do not explain what attributes within those regions determine the classification outcome: For example, is it their color? Their shape? Another family of methods provides an explanation by smoothly transforming the image between one class and another (e.g., GANalyze). However, these methods tend to change all attributes at once, thus making it difficult to isolate the individual affecting attributes.

In “Explaining in Style: Training a GAN to explain a classifier in StyleSpace”, presented at ICCV 2021, we propose a new approach for a visual explanation of classifiers. Our approach, StylEx, automatically discovers and visualizes disentangled attributes that affect a classifier. It allows exploring the effect of individual attributes by manipulating those attributes separately (changing one attribute does not affect others). StylEx is applicable to a wide range of domains, including animals, leaves, faces, and retinal images. Our results show that StylEx finds attributes that align well with semantic ones, generate meaningful image-specific explanations, and are interpretable by people as measured in user studies.

Explaining a Cat vs. Dog Classifier: StylEx provides the top-K discovered disentangled attributes which explain the classification. Moving each knob manipulates only the corresponding attribute in the image, keeping other attributes of the subject fixed.

For instance, to understand a cat vs. dog classifier on a given image, StylEx can automatically detect disentangled attributes and visualize how manipulating each attribute can affect the classifier probability. The user can then view these attributes and make semantic interpretations for what they represent. For example, in the figure above, one can draw conclusions such as “dogs are more likely to have their mouth open than cats” (attribute #4 in the GIF above), “cats’ pupils are more slit-like” (attribute #5), “cats’ ears do not tend to be folded” (attribute #1), and so on.

The video below provides a short explanation of the method:

How StylEx Works: Training StyleGAN to Explain a Classifier
Given a classifier and an input image, we want to find and visualize the individual attributes that affect its classification. For that, we utilize the StyleGAN2 architecture, which is known to generate high quality images. Our method consists of two phases:

Phase 1: Training StylEx

A recent work showed that StyleGAN2 contains a disentangled latent space called “StyleSpace”, which contains individual semantically meaningful attributes of the images in the training dataset. However, because StyleGAN training is not dependent on the classifier, it may not represent those attributes that are important for the decision of the specific classifier we want to explain. Therefore, we train a StyleGAN-like generator to satisfy the classifier, thus encouraging its StyleSpace to accommodate classifier-specific attributes.

This is achieved by training the StyleGAN generator with two additional components. The first is an encoder, trained together with the GAN with a reconstruction-loss, which forces the generated output image to be visually similar to the input. This allows us to apply the generator on any given input image. However, visual similarity of the image is not enough, as it may not necessarily capture subtle visual details important for a particular classifier (such as medical pathologies). To ensure this, we add a classification-loss to the StyleGAN training, which forces the classifier probability of the generated image to be the same as the classifier probability of the input image. This guarantees that subtle visual details important for the classifier (such as medical pathologies) will be included in the generated image.

Training StyleEx: We jointly train the generator and the encoder. A reconstruction-loss is applied between the generated image and the original image to preserve visual similarity. A classification-loss is applied between the classifier output of the generated image and the classifier output of the original image to ensure the generator captures subtle visual details important for the classification.

Phase 2: Extracting Disentangled Attributes

Once trained, we search the StyleSpace of the trained Generator for attributes that significantly affect the classifier. To do so, we manipulate each StyleSpace coordinate and measure its effect on the classification probability. We seek the top attributes that maximize the change in classification probability for the given image. This provides the top-K image-specific attributes. By repeating this process for a large number of images per class, we can further discover the top-K class-specific attributes, which teaches us what the classifier has learned about the specific class. We call our end-to-end system “StylEx”.

A visual illustration of image-specific attribute extraction: once trained, we search for the StyleSpace coordinates that have the highest effect on the classification probability of a given image.

StylEx is Applicable to a Wide Range of Domains and Classifiers
Our method works on a wide variety of domains and classifiers (binary and multi-class). Below are some examples of class-specific explanations. In all the domains tested, the top attributes detected by our method correspond to coherent semantic notions when interpreted by humans, as verified by human evaluation.

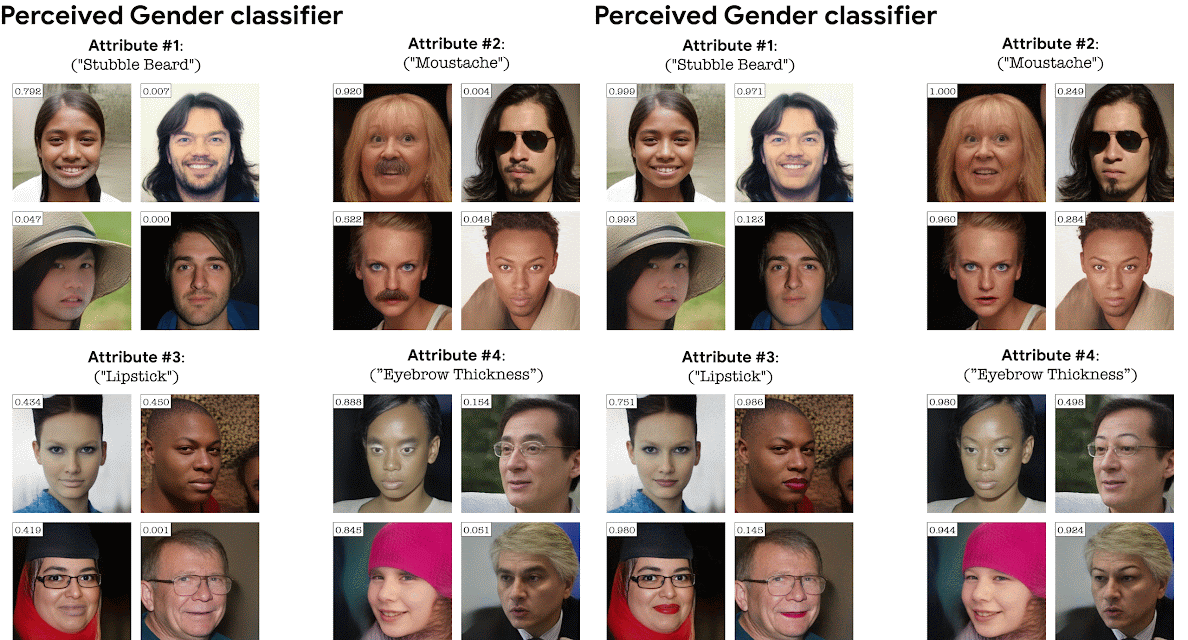
For perceived gender and age classifiers, below are the top four detected attributes per classifier. Our method exemplifies each attribute on multiple images that are automatically selected to best demonstrate that attribute. For each attribute we flicker between the source and attribute-manipulated image. The degree to which manipulating the attribute affects the classifier probability is shown at the top-left corner of each image.

Top-4 automatically detected attributes for a perceived-gender classifier.
Top-4 automatically detected attributes for a perceived-age classifier.

Note that our method explains a classifier, not reality. That is, the method is designed to reveal image attributes that a given classifier has learned to utilize from data; those attributes may not necessarily characterize actual physical differences between class labels (e.g., a younger or older age) in reality. In particular, these detected attributes may reveal biases in the classifier training or dataset, which is another key benefit of our method. It can further be used to improve fairness of neural networks, for example, by augmenting the training dataset with examples that compensate for the biases our method reveals.

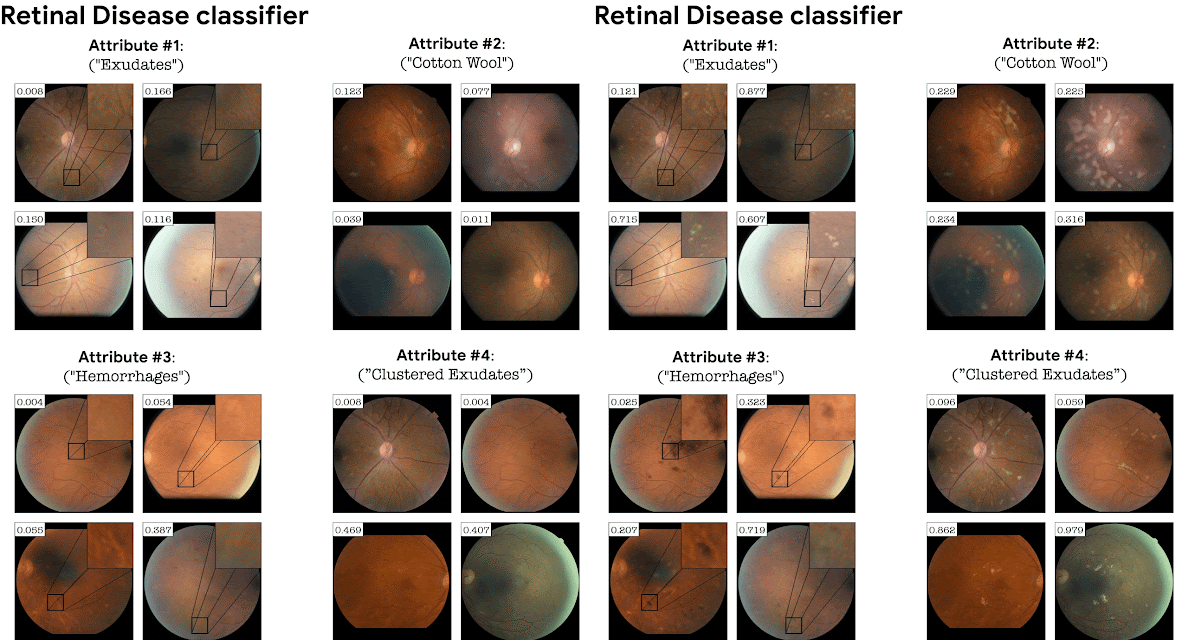
Adding the classifier loss into StyleGAN training turns out to be crucial in domains where the classification depends on fine details. For example, a GAN trained on retinal images without a classifier loss will not necessarily generate fine pathological details corresponding to a particular disease. Adding the classification loss causes the GAN to generate these subtle pathologies as an explanation of the classifier. This is exemplified below for a retinal image classifier (DME disease) and a sick/healthy leaf classifier. StylEx is able to discover attributes that are aligned with disease indicators, for instance “hard exudates”, which is a well known marker for retinal DME, and rot for leaf diseases.

Top-4 automatically detected attributes for a DME classifier of retina images.
Top-4 automatically detected attributes for a classifier of sick/healthy leaf images.

Finally, this method is also applicable to multi-class problems, as demonstrated on a 200-way bird species classifier.

Top-4 automatically detected attributes in a 200-way classifier trained on CUB-2011 for (a) the class “brewer blackbird, and (b) the class yellow bellied flycatcher. Indeed we observe that StylEx detects attributes that correspond to attributes in CUB taxonomy.

Broader Impact and Next Steps
Overall, we have introduced a new technique that enables the generation of meaningful explanations for a given classifier on a given image or class. We believe that our technique is a promising step towards detection and mitigation of previously unknown biases in classifiers and/or datasets, in line with Google’s AI Principles. Additionally, our focus on multiple-attribute based explanation is key to providing new insights about previously opaque classification processes and aiding in the process of scientific discovery. Finally, our GitHub repository includes a Colab and model weights for the GANs used in our paper.

Acknowledgements
The research described in this post was done by Oran Lang, Yossi Gandelsman, Michal Yarom, Yoav Wald (as an intern), Gal Elidan, Avinatan Hassidim, William T. Freeman, Phillip Isola, Amir Globerson, Michal Irani and Inbar Mosseri. We would like to thank Jenny Huang and Marilyn Zhang for leading the writing process for this blogpost, and Reena Jana, Paul Nicholas, and Johnny Soraker for ethics reviews of our research paper and this post.

Source: Google AI Blog