Tag Archives: announcement

Update on Google at GDC 2020

Posted by the Google for Games Team

Last Friday, GDC 2020 organizers made the difficult decision to postpone the conference. We understand this decision, as we have to prioritize the health and safety of our community.

Every year, we look forward to the Game Developers Conference and surrounding events because it gives our teams a chance to connect with game developers, partners, and friends in the industry.

Although we won’t be connecting in-person this year, we’re still excited to share the latest announcements from Google with everyone through our digital experience. We'll be sharing plans for our digital experience in the coming days.

Thank you to all who keep this community thriving and check back soon at g.co/gdc2020 for more details.

Update on the Google Groups Settings API

Posted by Zerzar Bukhari, Product Manager, G Suite

In February 2019, we announced upcoming changes to the Google Groups Settings API. Based on your feedback, we're making improvements to the Groups API to make it easier for you to assess the impact and take action. For the full list of changes, see this help center article.

When will API changes take effect?

The new features will be available starting March 25, 2019. It may take up to 72 hours for the features to rollout to everyone

What's changing?

  • Property 'membersCanPostAsTheGroup' will not be merged into 'whoCanModerateContent'
  • Property 'messageModerationLevel' will continue to support MODERATE_NEW_MEMBERS (it will not be deprecated)
  • New property 'customRoleUsedInMergedSetting'
    • This will indicate if a group uses custom roles in one of the merged settings. If a group uses a custom role, review the permissions in the Groups interface. The Groups API doesn't support custom roles and may report incorrect values for permissions.
  • New properties representing all to-be-merged settings, as well as the new settings, will be added
  • New property 'whoCanDiscoverGroup' to indicate the upcoming behavior for 'showInGroupDirectory'

For complete detail on Groups Settings API behavior changes, please reference this table.

Announcing TensorFlow 1.0

Posted By: Amy McDonald Sandjideh, Technical Program Manager, TensorFlow

In just its first year, TensorFlow has helped researchers, engineers, artists, students, and many others make progress with everything from language translation to early detection of skin cancer and preventing blindness in diabetics. We're excited to see people using TensorFlow in over 6000 open-source repositories online.


Today, as part of the first annual TensorFlow Developer Summit, hosted in Mountain View and livestreamed around the world, we're announcing TensorFlow 1.0:


It's faster: TensorFlow 1.0 is incredibly fast! XLA lays the groundwork for even more performance improvements in the future, and tensorflow.org now includes tips & tricksfor tuning your models to achieve maximum speed. We'll soon publish updated implementations of several popular models to show how to take full advantage of TensorFlow 1.0 - including a 7.3x speedup on 8 GPUs for Inception v3 and 58x speedup for distributed Inception v3 training on 64 GPUs!


It's more flexible: TensorFlow 1.0 introduces a high-level API for TensorFlow, with tf.layers, tf.metrics, and tf.losses modules. We've also announced the inclusion of a new tf.keras module that provides full compatibility with Keras, another popular high-level neural networks library.


It's more production-ready than ever: TensorFlow 1.0 promises Python API stability (details here), making it easier to pick up new features without worrying about breaking your existing code.

Other highlights from TensorFlow 1.0:

  • Python APIs have been changed to resemble NumPy more closely. For this and other backwards-incompatible changes made to support API stability going forward, please use our handy migration guide and conversion script.
  • Experimental APIs for Javaand Go
  • Higher-level API modules tf.layers, tf.metrics, and tf.losses - brought over from tf.contrib.learnafter incorporating skflowand TF Slim
  • Experimental release of XLA, a domain-specific compiler for TensorFlow graphs, that targets CPUs and GPUs. XLA is rapidly evolving - expect to see more progress in upcoming releases.
  • Introduction of the TensorFlow Debugger (tfdbg), a command-line interface and API for debugging live TensorFlow programs.
  • New Android demos for object detection and localization, and camera-based image stylization.
  • Installation improvements: Python 3 docker images have been added, and TensorFlow's pip packages are now PyPI compliant. This means TensorFlow can now be installed with a simple invocation of pip install tensorflow.

We're thrilled to see the pace of development in the TensorFlow community around the world. To hear more about TensorFlow 1.0 and how it's being used, you can watch the TensorFlow Developer Summit talks on YouTube, covering recent updates from higher-level APIs to TensorFlow on mobile to our new XLA compiler, as well as the exciting ways that TensorFlow is being used:


Click herefor a link to the livestream and video playlist (individual talks will be posted online later in the day).


The TensorFlow ecosystem continues to grow with new techniques like Foldfor dynamic batching and tools like the Embedding Projector along with updates to our existing tools like TensorFlow Serving. We're incredibly grateful to the community of contributors, educators, and researchers who have made advances in deep learning available to everyone. We look forward to working with you on forums like GitHub issues, Stack Overflow, @TensorFlow, the [email protected]group, and at future events.


Live from the Firebase Dev Summit in Berlin: Firebase, six months after I/O

Posted by Francis Ma, Firebase Product Manager

Originally posted to the Firebase blog

Our goal with Firebase is to help developers build better apps and grow them into successful businesses. Six months ago at Google I/O, we took our well-loved backend-as-a-service (BaaS) and expanded it to 15 features to make it Google’s unified app development platform, available across iOS, Android, and the web.

We launched many new features at Google I/O, but our work didn’t stop there. Since then, we’ve learned a lot from you (750,000+ projects created on Firebase to date!) about how you’re using our platform and how we can improve it. Thanks to your feedback, today we’re launching a number of enhancements to Crash Reporting, Analytics, support for game developers and more. For more information on our announcements, tune in to the livestream video from Firebase Dev Summit in Berlin. They’re also listed here:

Improve App Quality to Deliver Better User Experiences

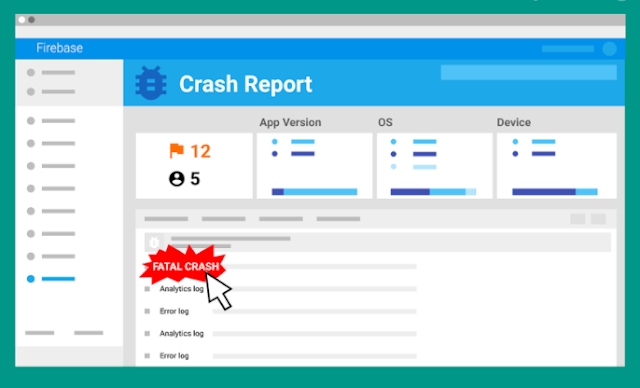
Firebase Crash Reporting comes out of Beta and adds a new feature that helps you diagnose and reproduce app crashes.

Often the hardest part about fixing an issue is reproducing it, so we’ve added rich context to each crash to make the process simple. Firebase Crash Reporting now shows Firebase Analytics event data in the logs for each crash. This gives you clarity into the state of your app leading up to an error. Things like which screens of your app were visited are automatically logged with no instrumentation code required. Crash logs will also display any custom events and parameters you explicitly log using Firebase Analytics. Firebase Crash Reporting works for both iOS and Android apps.

Glide, a popular live video messaging app, relies on Firebase Crash Reporting to ensure user quality and release agility. “No matter how much effort you put into testing, it will never be as thorough as millions of active users in different locations, experiencing a variety of network conditions and real life situations. Firebase allows us to rapidly gain trust in our new version during phased release, as well as accelerate the process of identifying core issues and providing quick solutions.” - Roi Ginat, Founder, Glide.

Firebase Test Lab for Android supports more devices and introduces a free tier.

We want to help you deliver high-quality experiences, so testing your app before it goes into the wild is incredibly important. Firebase Test Lab allows you to easily test your app on many physical and virtual devices in the cloud, without writing a single line of test code. Beginning today, developers on the Spark service tier (which is free!) can run five tests per day on physical devices and ten tests per day on virtual devices—with no credit card setup required. We’ve also heard that you want more device options, so we’ve added 11 new popular Android device models to Test Lab, available today.

Illustration of Firebase Crash Reporting

Make Faster Data Driven Decisions with Firebase Analytics

Firebase Analytics now offers live reporting, a new integration with Google “Data Studio”, and real-time exporting to BigQuery.

We know that your data is most actionable when you can see and process it as quickly as possible. Therefore, we’re announcing a number of features to help you maximize the potential of your analytics events:

  1. Real-time uploading of conversion events
  2. Real-time exporting to BigQuery
  3. DebugView for validation of your analytics instrumentation
  4. StreamView, which will offer a live, dynamic view of your analytics data as we receive it

To further enhance your targeting options, we’ve improved the connection between Firebase Analytics and other Firebase features, such as Dynamic Links and Remote Config. For example, you can now use Dynamic Links on your Facebook business page, and we can identify Facebook as a source in Firebase Analytics reporting. As well, you can now target Remote Config changes by User Properties, in addition to Audiences.

Build Better Games using Firebase

Firebase now has a Unity plugin!

Game developers are building great apps, and we want Firebase to work for you, too. We’ve built an entirely new plugin for Unity that supports Analytics, the Realtime Database, Authentication, Dynamic Links, Remote Config, Notifications and more. We've also expanded our C++ SDK with Realtime Database support.

Integrate Firebase Even Easier with Open-Sourced UI Library

FirebaseUI is updated to v1.0.

FirebaseUI is a library that provides common UI elements when building apps, and it’s a quick way to integrate with Firebase. FirebaseUI 1.0 includes a drop-in UI flow for Firebase Authentication, with common identity providers such as Google, Facebook, and Twitter. FirebaseUI 1.0 also added features such as client-side joins and intersections for the Realtime Database, plus integrations with Glide and SDWebImage that make downloading and displaying images from Firebase Storage a cinch. Follow our progress or contribute to our Android, iOS, and Web components on Github.

Learn More via Udacity and Join the Firebase Community

We want to provide the best tool for developers, but it’s also important that we give resources and training to help you get more out of the platform. As such, we’ve created a new Udacity course: Firebase in a Weekend! It’s an instructor-led video course to help all developers get up and running with Firebase on iOS and Android, in two days.

Finally, to help wrap your head around all our announcements, we’ve created a new demo app. This is an easy way to see how Analytics, Crash Reporting, Test Lab, Notifications, and Remote Config work in a live environment, without having to write a line of code.

Helping developers build better apps and successful businesses is at the core of Firebase. We work hard on it every day. We love hearing your feedback and ideas for new features and improvements—and we hope you can see from the length of this post that we take them to heart! Follow us on Twitter, join our Slack channel, participate in our Google Group, and let us know what you think. We’re excited to see what you’ll build next!

Compute Engine now with 3 TB of high-speed Local SSD and 64 TB of Persistent Disk per VM

To help your business grow, we are significantly increasing size limits of all Google Compute Engine block storage products, including Local SSD and both types of Persistent Disk.

Now up to 64TB of Persistent Disk may be attached per VM for most machine types, including both Standard and SSD-backed Persistent Disk. The volume size limit has increased to 64 TB also, eliminating the need to stripe disks for larger volumes.

Persistent Disk provides fantastic price-performance and offers excellent usability for workloads that rely on durable block storage. Persistent Disk SSD delivers 30 IOPS per 1 GB provisioned, up to 15,000 IOPS per instance. Persistent Disk Standard is great value at $0.04 per GB-mo and provides 0.75 read IOPS per GB and 1.5 write IOPS per GB. Performance limits are set at an instance level, and can be achieved with just a single Persistent Disk.

We have also increased the amount of Local SSD that can be attached to a single virtual machine to 3 TB. Available in Beta today, you can attach twice as many partitions of Local SSD to Google Compute Engine instances. Up to eight 375 GB partitions or 3 TB of high IOPS SSD can now be attached to any machine with at least one virtual CPU.

We talked with Aaron Raddon, Founder and CTO at Lytics who tested our larger Local SSDs. He found they improved Cassandra performance by 50% and provide provisioning flexibility that can lead to additional savings.
The new, larger SSD has the same incredible IOPS performance we announced in January, topping out at 680,000 random 4K read IOPS and 360,000 random 4K write IOPS. With Local SSD you can achieve multiple millions of operations per second for key-value stores and a million writes per second using as few as 50 servers on NoSQL databases.

Local SSD retains the competitive pricing of $0.218 per GB/month while continuing to support extraordinary IOPS performance. As always, data stored in Local SSD is encrypted and our live migration technology means no downtime during maintenance. Local SSD also retains the flexibility of attaching to any instance type.

Siddharth Choudhuri, Principal Engineer at Levyx stated that doubling capacity on local SSDs with the same high IOPS is a game changer for businesses seeking low-latency and high throughput on large datasets. It enables them to index billions of objects on a single, denser node in real-time on Google Cloud Platform when paired with Levyx’s Helium data store.

To get started, head over to the Compute Engine console or read about Persistent Disk and Local SSD in the product documentation.

- Posted by John Barrus, Senior Product Manager, Google Cloud Platform

Cloud Audit Logs to help you with audit and compliance needs

Not having a full view of administrative actions in your Google Cloud Platform projects can make it challenging and slow going to troubleshoot when an important application breaks or stops working. It can also make it difficult to monitor access to sensitive data and resources managed by your project. That’s why we created Google Cloud Audit Logs, and today they’re available in beta for App Engine and BigQuery. Cloud Audit Logs help you with your audit and compliance needs by enabling you to track the actions of administrators in your Google Cloud Platform projects. They consist of two log streams: Admin Activity and Data Access.

Admin Activity audit logs contain an entry for every administrative action or API call that modifies the configuration or metadata for the related application, service or resource, for example, adding a user to a project, deploying a new version in App Engine or creating a BigQuery dataset. You can inspect these actions across your projects on the Activity page in the Google Cloud Platform Console.

activity stream.png

Data Access audit logs contain an entry for every one of the following events:
  • API calls that read the configuration or metadata of an application, service or resource
  • API calls that create, modify or read user-provided data managed by a service (e.g. inserting data into a dataset or launching a query in BigQuery)

Currently, only BigQuery generates a Data Access log as it manages user-provided data, but ultimately all Cloud Platform services will provide a Data Access log.

There are many additional uses of Audit Logs beyond audit and compliance needs. In particular, the BigQuery team has put together a collection of examples that show how you can use Audit Logs to better understand your utilization and spending on BigQuery. We’ll be sharing more examples in future posts.


Accessing the Logs
Both of these logs are available in Google Cloud Logging, which means that you’ll be able to view the individual log entries in the Logs Viewer as well as take advantage of the many logs management capabilities available, including exporting the logs to Google Cloud Storage for long-term retention, streaming to BigQuery for real-time analysis and publishing to Google Cloud Pub/Sub to enable processing via Google Cloud Dataflow. The specific content and format of the logs can be found in the Cloud Logging documentation for Audit Logs.

Audit Logs are available to you at no additional charge. Applicable charges for using other Google Cloud Platform services (such as BigQuery and Cloud Storage) as well as streaming logs to BigQuery will still apply. As we find more ways to provide greater insight into administrative actions in GCP projects, we’d love to hear your feedback. Share it here: [email protected].

Posted by Joe Corkery, Product Manager, Google Cloud Platform


Improved Compute Engine Quota experience

As part of our constant improvements to the Google Cloud Platform console we’ve recently updated our Google Compute Engine quotas page. Now you can easily see quota consumption levels and sort to find your most-used resources. This gives you a head start on determining and procuring any additional capacity you need so you hit fewer speed bumps on your road to growth and success.
We’ve also improved the process of requesting more quota, which can be initiated directly from the quotas page by clicking on the “Request increase” button. We’ve added additional checks to the request form that help speed up our response processing time; now most requests are completed in minutes. With these changes, we’re making it even easier to do more with Cloud Platform.

You can access your console at https://console.cloud.google.com and learn more about how GCP can help you build better applications faster on the https://cloud.google.com web page.

Posted by Roy Peterkofsky, Product Manager

Faster builds for Java developers with Maven Central mirror

The Maven Central Repository is a key host of Java dependencies and is used by many popular build systems and dependency managers, such as Apache Maven, Gradle, Ivy, Grape and Bazel. Jason van Zyl, founder of Apache Maven, is hosting a complete mirror of the Maven Central Repository on Google Cloud Storage, meaning faster builds on Google Cloud Platform.

When you build a Maven project, Maven will check your pom.xml file for dependencies. If the dependency isn’t available locally, it needs to be pulled from an online repository. With a simple change to your settings.xml configuration file, a build system running on Cloud Platform – for example, Jenkins on Google Compute Engine or Google Cloud Shell – can now fetch your project’s dependencies from Cloud Storage, increasing the speed of your builds.

To use the Cloud Storage Maven Central mirror, add this in the settings.xml configuration file:


Access the Maven Central Repository via API 

Google provides API libraries to access Cloud Storage in Java, Python, Node.js and Ruby. The libraries can be used to access the Maven repository bucket. For example, the following snippet lists all the entities at the top of “maven-central” storage bucket:


If you want to learn more about Maven Central and its mirror on Cloud Platform, check out the post by Jason van Zyl, founder of Apache Maven.

**Java is a registered trademark of Oracle Corporation and/or its affiliates.

Posted by Ludovic Champenois, Google Software Engineer

Q&A with Neal Mohan: A Sneak Peek at the DoubleClick Live Stream

DoubleClick’s annual digital advertising summit is just around the corner, streaming live on YouTube on Wednesday, June 4th. (Sign up here to watch.) We caught up with Neal Mohan, Google’s Vice President of Display and Video Advertising Products, to hear what’s on his mind as we get ready for the event.

Q: What topics should we expect to hear about this year? 
A: I don’t think it will come as a surprise that our team has been very focused on how to make digital work for brands and premium publishers. You can expect to hear a lot more about that. Also, since this event marks Google’s annual conversation on the future of digital advertising, we’ll discuss how digital is redefining consumer behavior, content development, and the ways that advertisers and publishers reach their customers.

Q: Will the live stream include any special guests? 
A: I’ll be joined by Nikesh Arora, our Chief Business Officer at Google, and Jeffrey Katzenberg, the CEO and Co-Founder of DreamWorks Animation. I’m looking forward to hearing Jeffrey talk about how technology has changed content creation.

Q: What consumer trends are impacting the way brands and publishers think about digital? 
A: When we started this DoubleClick event 14 years ago, going online was a deliberate act that required going to a computer and “logging-in”. The days of going online are coming to an end. Today’s digital experience is one that is always-on and always with us. As a result, digital has become far more personal, and one of the most personal forms of communication - video - is playing a more central role in our online lives. All these factors have major implications for brands and publishers, which we’ll discuss at the event.

Q: So...any scoops you can give us?
A: As I mentioned, video has been very much on my mind lately. Getting video right is something that is essential to our brand, agency, and publisher partners...expect to hear more about what we have planned to help make that happen.

We hope you can join us on Wednesday, June 4th at 9:30 am PDT / 12:30 pm EDT. Register to watch the live stream or to receive the recording. -The DoubleClick Team