Tag Archives: Logging

Google Ads API Video Roundup

The Google Ads Developers Channel is your video source for release notes, best practices, new feature integrations, code walkthroughs, and video tutorials. Check out some of the recently released and popular videos and playlists below, and remember to subscribe to our channel to stay up to date with the latest video content.

Google Ads API Best Practices - Error Handling and Debugging
In this episode of the Google Ads API Best Practices Series, we discuss how to handle errors that may occur when interacting with the Google Ads API, along with tools that may help you debug your applications, such as logging and the REST interface.
Meet the Team with David Wihl
In this video, David Wihl shares a bit about his role as a Developer Relations Engineer at Google and discusses his work in supporting the Performance Max campaign API integration.

[Live Demo] Building a Google Ads API Web App
Getting started with the Google Ads API? In this 8-episode series, we take a deep dive into developing web apps with the Google Ads API, with a focus on the OAuth flow, by building a multi-tenant app entirely from scratch.

Logging & Monitoring
This miniseries covers the basics of adding logging and monitoring to your Google Ads API integration and then goes into more advanced topics, with a special focus on Cloud tooling. Google Ads Query Language (GAQL)
In this series, we cover everything you need to know about the Google Ads Query Language to make reporting requests against the Google Ads API. We begin with the basics and build in subsequent episodes to cover various nuances of GAQL. We even dive into the various tools available to help you structure your queries. This playlist will equip you with the information you need to know to become a GAQL power user. For additional topics, including Authentication and Authorization and Working with REST, check out the Google Ads API Developer Series.

As always, feel free to reach out to us with any questions via the Google Ads API forum or at [email protected].
Announcing Enhanced Smart Home Analytics

Posted by Toni Klopfenstein, Developer Advocate

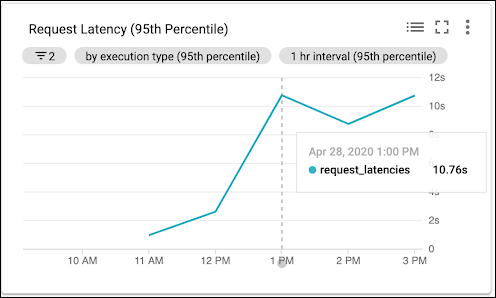
When creating scalable applications, consistent and reliable monitoring of resources is a valuable tool for any developer. Today we are releasing enhanced analytics and logging for Smart Home Actions. This feature enables you to more quickly identify and respond to errors or quality issues that may arise.

Request Latency Dashboard

You can now access the smart home dashboard with pre-populated metrics charts for your Actions on the Analytics tab in the Actions Console, or through Cloud Monitoring. These metrics help you quantify the health and usage of your Action, and gain insight into how users engage with your Action. You can view:

  • Execution types and device traits used
  • Daily users and request counts
  • User query response latency
  • Success rate for Smart Home engagements
  • Comparison of cloud and local fulfilment interactions

Successful Requests Dashboard

Cloud Logging provides detailed logs based on the events observed in Cloud Monitoring.

We've added additional features to the error logs to help you quickly debug why intents fail, which particular device commands malfunction, or if your local fulfilment falls back to cloud fulfilment.

New details added to the event logs include:

  • Cloud vs. local fulfilment
  • EXECUTE vs. QUERY intents
  • Locale of request
  • Device Type

You can additionally export these logs through Cloud Pub/Sub, and build log-based metrics and alerts for your development teams to gain insights into common issues.

For more guidance on accessing your Smart Home Action analytics and logs, check out the developer guide or watch the video.

We want to hear from you! Continue sharing your feedback with us through the issue tracker, and engage with other smart home developers in the /r/GoogleAssistantDev community. Follow @ActionsOnGoogle on Twitter for more of our team's updates, and tweet using #AoGDevs to share what you’re working on. We can’t wait to see what you build!

Cloud Audit Logs to help you with audit and compliance needs

Not having a full view of administrative actions in your Google Cloud Platform projects can make it challenging and slow going to troubleshoot when an important application breaks or stops working. It can also make it difficult to monitor access to sensitive data and resources managed by your project. That’s why we created Google Cloud Audit Logs, and today they’re available in beta for App Engine and BigQuery. Cloud Audit Logs help you with your audit and compliance needs by enabling you to track the actions of administrators in your Google Cloud Platform projects. They consist of two log streams: Admin Activity and Data Access.

Admin Activity audit logs contain an entry for every administrative action or API call that modifies the configuration or metadata for the related application, service or resource, for example, adding a user to a project, deploying a new version in App Engine or creating a BigQuery dataset. You can inspect these actions across your projects on the Activity page in the Google Cloud Platform Console.

activity stream.png

Data Access audit logs contain an entry for every one of the following events:
  • API calls that read the configuration or metadata of an application, service or resource
  • API calls that create, modify or read user-provided data managed by a service (e.g. inserting data into a dataset or launching a query in BigQuery)

Currently, only BigQuery generates a Data Access log as it manages user-provided data, but ultimately all Cloud Platform services will provide a Data Access log.

There are many additional uses of Audit Logs beyond audit and compliance needs. In particular, the BigQuery team has put together a collection of examples that show how you can use Audit Logs to better understand your utilization and spending on BigQuery. We’ll be sharing more examples in future posts.


Accessing the Logs
Both of these logs are available in Google Cloud Logging, which means that you’ll be able to view the individual log entries in the Logs Viewer as well as take advantage of the many logs management capabilities available, including exporting the logs to Google Cloud Storage for long-term retention, streaming to BigQuery for real-time analysis and publishing to Google Cloud Pub/Sub to enable processing via Google Cloud Dataflow. The specific content and format of the logs can be found in the Cloud Logging documentation for Audit Logs.

Audit Logs are available to you at no additional charge. Applicable charges for using other Google Cloud Platform services (such as BigQuery and Cloud Storage) as well as streaming logs to BigQuery will still apply. As we find more ways to provide greater insight into administrative actions in GCP projects, we’d love to hear your feedback. Share it here: [email protected].

Posted by Joe Corkery, Product Manager, Google Cloud Platform