Tag Archives: solutions

How to effectively A/B test power consumption for your Android app’s features

Posted by Mayank Jain - Product Manager, and Yasser Dbeis - Software Engineer; Android Studio

Android developers have been telling us they're looking for tools to help optimize power consumption for different devices on Android.

The new Power Profiler in Android Studio helps Android developers by showing power consumption happening on devices as the app is being used. Understanding power consumption across Android devices can help Android developers identify and fix power consumption issues in their apps. They can run A/B tests to compare the power consumption of different algorithms, features or even different versions of their app.

The new Power Profiler in Android Studio

Apps which are optimized for lower power consumption lead to an improved battery and thermal performance of the device, which means an improved user experience on Android.

This power consumption data is made available through the On Device Power Monitor (ODPM) on Pixel 6+ devices, segmented by each sub-system called “Power Rails”. See Profileable power rails for a list of supported sub-systems.

The Power Profiler can help app developers detect problems in several areas:

    • Detecting unoptimized code that is using more power than necessary.
    • Finding background tasks that are causing unnecessary CPU usage.
    • Identifying wakelocks that are keeping the device awake when they are not needed.

Once a power consumption issue has been identified, the Power Profiler can be used when testing different hypotheses to understand why the app could be consuming excessive power. For example, if the issue is caused by background tasks, the developer can try to stop the tasks from running unnecessarily or for longer periods. And if the issue is caused by wakelocks, the developer can try to release the wakelocks when the resource is not in use or use them more judiciously. Then compare the power consumption before/after the change using the Power Profiler.

In this blog post, we showcase a technique which uses A/B testing to understand how your app’s power consumption characteristics might change with different versions of the same feature - and how you can effectively measure them.

A real-life example of how the Power Profiler can be used to improve the battery life of an app.

Let’s assume you have an app through which users can purchase their favorite movies.

Sample app to demonstrate A/B testing for measure power consumption
Sample app to demonstrate A/B testing for measure power consumption 
Video (c) copyright Blender Foundation | www.bigbuckbunny.org

As your app becomes popular and is used by more users, you realize that a high quality 4K video takes very long to load every time the app is started. Because of its large size, you want to understand its impact on power consumption on the device.

Originally, this video was in 4K quality in the best of intentions, so as to showcase the best possible movie highlights to your customers.

This makes you think…

    • Do you really need a 4K video banner on the home screen?
    • Does it make sense to load a 4K video over the network every time your app is run?
    • How will the power consumption characteristics of your app change if you replace the 4K video with something of lower quality (while still preserving the vivid look & feel of the video)?

This is a perfect scenario to perform an A/B test for power consumption

With an A/B test, you can test two slightly different variations of the video banner feature and choose the one with the better power consumption characteristics.

Scenario A : Run the app with 4K video banner on screen & measure power consumption

Scenario B : Run the app with lower resolution video banner on screen & measure power consumption

A/B Test setup

Let's take a moment and set up our Android Studio profiler to run this A/B test. We need to start the app and attach the CPU profiler to it and trigger a system trace (where the Power Profiler will be shown).

Step 1

Create a custom “Run configuration” by clicking the 3 dot menu > Edit

Custom run configuration

Step 2

Then select the “Profiling” tab and ensure that “Start this recording on startup” and CPU Activity > System Trace is selected. Then click “Apply”.

Edit configuration settings

Now simply run the “Profile app startup profiling with low overhead” whenever you want to run this app from start and attach the CPU profiler to it.

Note on precision

The following example scenarios use the entire app startup for estimating the power consumption for this blog’s purpose. However you can use more advanced techniques to have even higher precision in getting power readings. Some techniques to try are:

    • Isolate and measure power consumption for video playback only after a tap event on the video player
    • Use the trace markers API to mark the start and stop time for power measurement timeline - and then only measure power consumption within that marked window

Scenario A

In this scenario, we run the app with 4K video playing and measure power consumption for the first 30 seconds. We can optionally also run the scenario A multiple times and average out the readings. Once the System trace is shown in Android Studio, select the 0-30 second time range from the timeline selection panel and record as a screenshot for comparing against scenario B

Power consumption in scenario A - playing a 4k video

As you can see, the average power consumed by WLAN, CPU cores & Memory combined is about 1,352 mW (milliwatts)

Now let's compare and contrast how this power consumption changes in Scenario B

Scenario B

In this scenario, we run the app with low quality video playing and measure power consumption for the first 30 seconds. As before, we can also optionally run scenario B multiple times and average out the power consumption readings. Again, once the System trace is shown in Android Studio, select the 0-30 second time range from the timeline selection panel.

Power consumption in scenario B - playing a lower quality video

The total power consumed by WLAN, CPU Little, CPU Big and CPU Mid & Memory is about 741 mW (milliwatts)

Conclusion

All else being equal, Scenario B (with lower quality video) consumed 741 mW power as compared to Scenario A (with 4K video) which required 1,352 mW power.

Scenario B (lower quality video) took 45% less power than Scenario A (4K) - while the lower quality video provides little to no visual difference in perceived quality of the app’s screen.

As a result of this A/B test for power consumption, you conclude that replacing the 4K video with a lower quality video on our app’s home screen not only reduces power consumption by 45%, also reduces the required network bandwidth and can potentially also improve the thermal performance of the devices.

If your app’s business logic still requires the 4K video to be shown on the app’s screen, you can explore strategies like:

    • Caching the 4K video across subsequent runs of the app.
    • Loading video on a user tap.
    • Loading an image initially and only load the video after the screen has fully rendered (delayed loading).

The overall power consumption numbers presented in the above A/B test scenario might seem small, but it shows the techniques that app developers can use to effectively A/B test power consumption for their app’s features using the Power Profiler in Android Studio.

Next Steps

The new Power Profiler is available in Android Studio Hedgehog onwards. To know more, please head over to the official documentation.

Large Language Models On-Device with MediaPipe and TensorFlow Lite

Posted by Mark Sherwood – Senior Product Manager and Juhyun Lee – Staff Software Engineer

TensorFlow Lite has been a powerful tool for on-device machine learning since its release in 2017, and MediaPipe further extended that power in 2019 by supporting complete ML pipelines. While these tools initially focused on smaller on-device models, today marks a dramatic shift with the experimental MediaPipe LLM Inference API.

This new release enables Large Language Models (LLMs) to run fully on-device across platforms. This new capability is particularly transformative considering the memory and compute demands of LLMs, which are over a hundred times larger than traditional on-device models. Optimizations across the on-device stack make this possible, including new ops, quantization, caching, and weight sharing.

The experimental cross-platform MediaPipe LLM Inference API, designed to streamline on-device LLM integration for web developers, supports Web, Android, and iOS with initial support for four openly available LLMs: Gemma, Phi 2, Falcon, and Stable LM. It gives researchers and developers the flexibility to prototype and test popular openly available LLM models on-device.

On Android, the MediaPipe LLM Inference API is intended for experimental and research use only. Production applications with LLMs can use the Gemini API or Gemini Nano on-device through Android AICore. AICore is the new system-level capability introduced in Android 14 to provide Gemini-powered solutions for high-end devices, including integrations with the latest ML accelerators, use-case optimized LoRA adapters, and safety filters. To start using Gemini Nano on-device with your app, apply to the Early Access Preview.


LLM Inference API

Starting today, you can test out the MediaPipe LLM Inference API via our web demo or by building our sample demo apps. You can experiment and integrate it into your projects via our Web, Android, or iOS SDKs.

Using the LLM Inference API allows you to bring LLMs on-device in just a few steps. These steps apply across web, iOS, and Android, though the SDK and native API will be platform specific. The following code samples show the web SDK.

1. Pick model weights compatible with one of our supported model architectures 


2. Convert the model weights into a TensorFlow Lite Flatbuffer using the MediaPipe Python Package

from mediapipe.tasks.python.genai import converter 

config = converter.ConversionConfig(...)
converter.convert_checkpoint(config)
 

3. Include the LLM Inference SDK in your application

import { FilesetResolver, LlmInference } from
"https://cdn.jsdelivr.net/npm/@mediapipe/tasks-genai”
 

4. Host the TensorFlow Lite Flatbuffer along with your application.


5. Use the LLM Inference API to take a text prompt and get a text response from your model.

const fileset  = await
FilesetResolver.forGenAiTasks("https://cdn.jsdelivr.net/npm/@mediapipe/tasks-genai/wasm");
const llmInference = await LlmInference.createFromModelPath(fileset, "model.bin");
const responseText = await llmInference.generateResponse("Hello, nice to meet you");
document.getElementById('output').textContent = responseText;


Please see our documentation and code examples for a detailed walk through of each of these steps.

Here are real time gifs of Gemma 2B running via the MediaPipe LLM Inference API.

moving image of Gemma 2B running on-device in browser via the MediaPipe LLM Inference API
Gemma 2B running on-device in browser via the MediaPipe LLM Inference API
moving image of Gemma 2B running on-device on iOS (left) and Android (right) via the MediaPipe LLM Inference API
Gemma 2B running on-device on iOS (left) and Android (right) via the MediaPipe LLM Inference API

Models

Our initial release supports the following four model architectures. Any model weights compatible with these architectures will work with the LLM Inference API. Use the base model weights, use a community fine-tuned version of the weights, or fine tune weights using your own data.

 Model

 Parameter Size

 Falcon 1B

 1.3 Billion

 Gemma 2B

 2.5 Billion

 Phi 2

 2.7 Billion

 Stable LM 3B

 2.8 Billion


Model Performance

Through significant optimizations, some of which are detailed below, the MediaPipe LLM Inference API is able to deliver state-of-the-art latency on-device, focusing on CPU and GPU to support multiple platforms. For sustained performance in a production setting on select premium phones, Android AICore can take advantage of hardware-specific neural accelerators.

When measuring latency for an LLM, there are a few terms and measurements to consider. Time to First Token and Decode Speed will be the two most meaningful as these measure how quickly you get the start of your response and how quickly the response generates once it starts.

 Term

 Significance

 Measurement

 Token

LLMs use tokens rather than words as inputs and outputs. Each model used with the LLM Inference API has a tokenizer built in which converts between words and tokens.

100 English words ≈ 130 tokens. However the conversion is dependent on the specific LLM and the language.

 Max Tokens

The maximum total tokens for the LLM prompt + response.

Configured in the LLM Inference API at runtime.

 Time to First Token

Time between calling the LLM Inference API and receiving the first token of the response.

Max Tokens / Prefill Speed

 Prefill Speed

How quickly a prompt is processed by an LLM.

Model and device specific. Benchmark numbers below.

 Decode Speed

How quickly a response is generated by an LLM.

Model and device specific. Benchmark numbers below.


The Prefill Speed and Decode Speed are dependent on model, hardware, and max tokens. They can also change depending on the current load of the device.

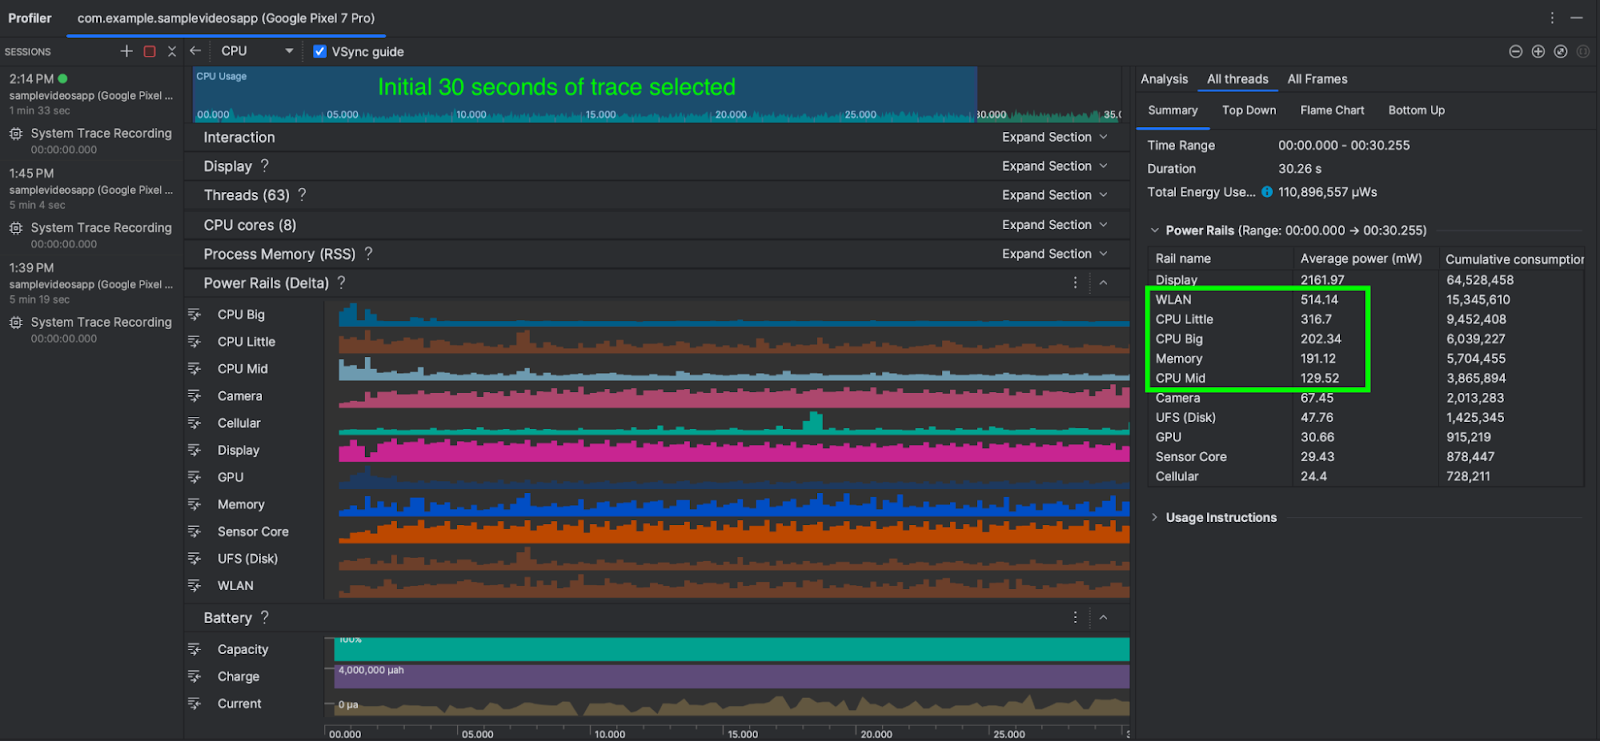
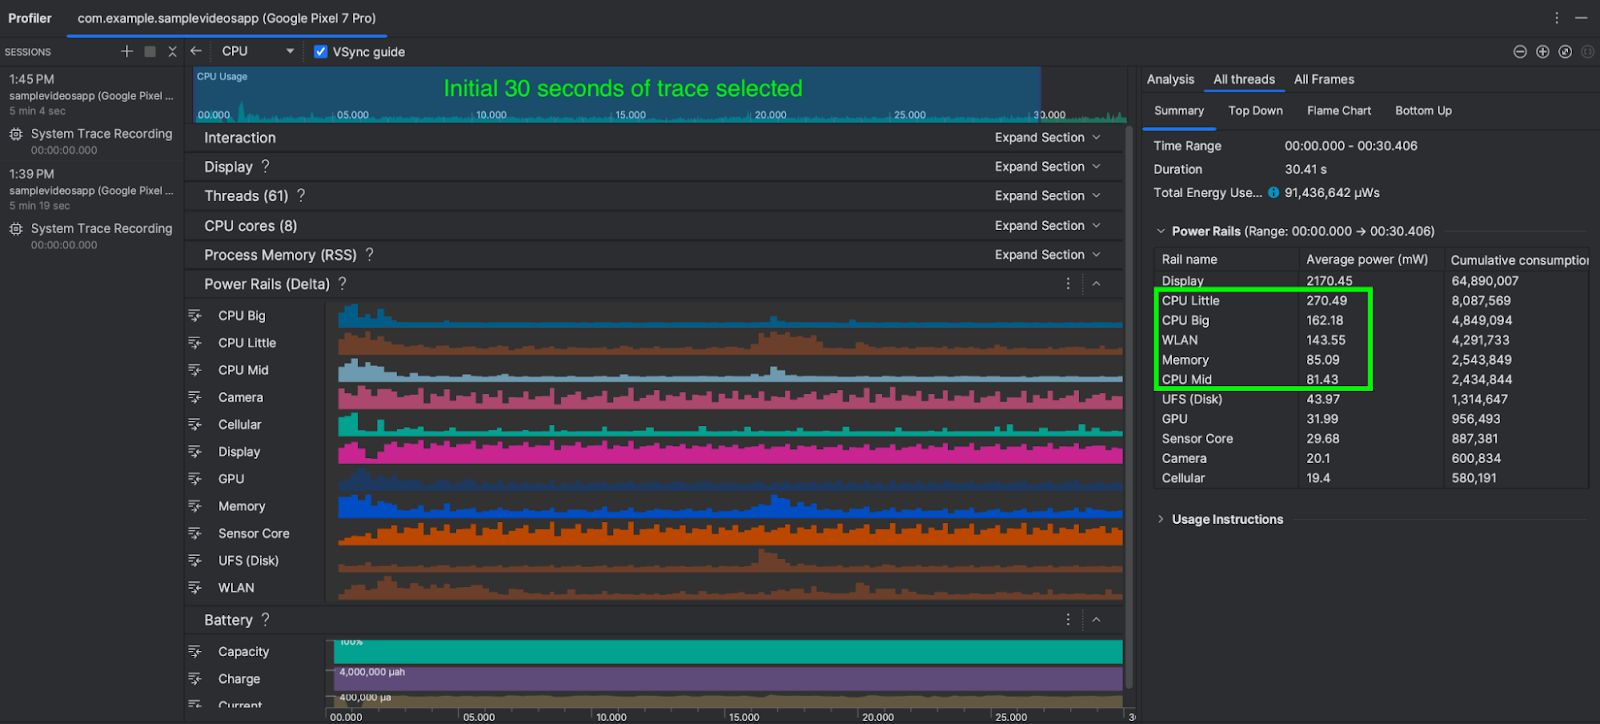
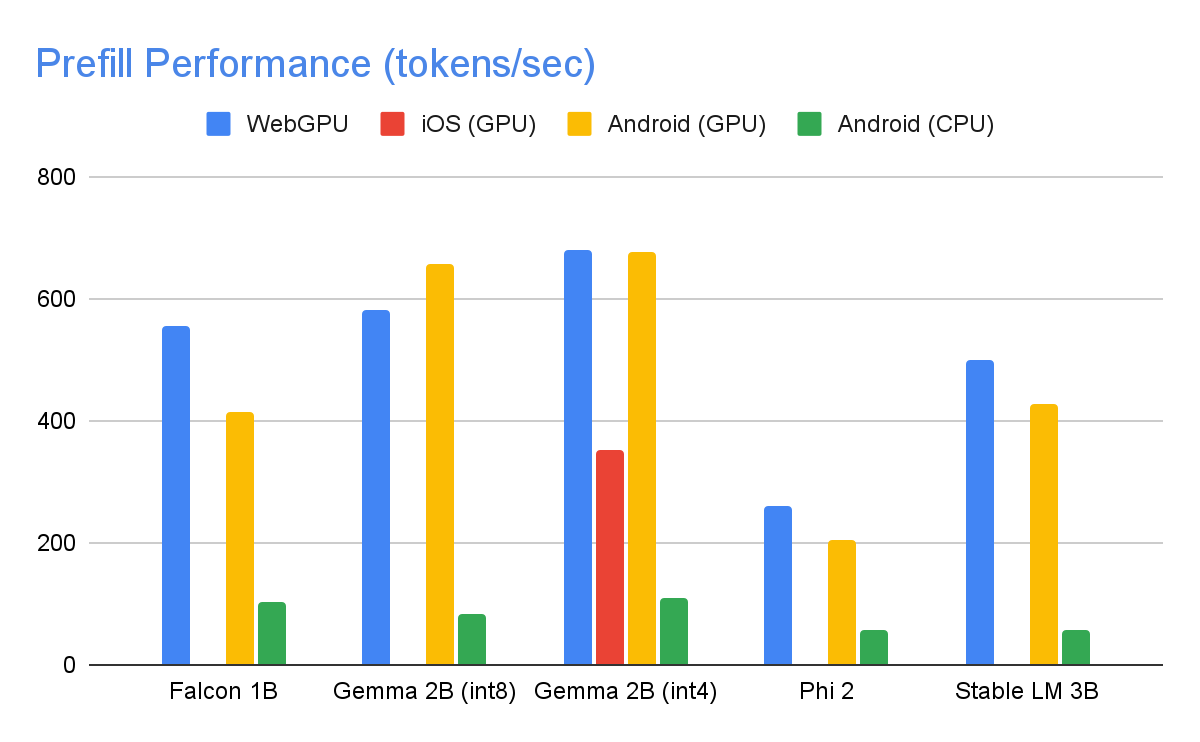
The following speeds were taken on high end devices using a max tokens of 1280 tokens, an input prompt of 1024 tokens, and int8 weight quantization. The exception being Gemma 2B (int4), found here on Kaggle, which uses a mixed 4/8-bit weight quantization.


Benchmarks

Graph showing prefill performance in tokens per second across WebGPU, iOS (GPU), Android (GPU), and Android (CPU)
Graph showing decode performance in tokens per second across WebGPU, iOS (GPU), Android (GPU), and Android (CPU)
On the GPU, Falcon 1B and Phi 2 use fp32 activations, while Gemma and StableLM 3B use fp16 activations as the latter models showed greater robustness to precision loss according to our quality eval studies. The lowest bit activation data type that maintained model quality was chosen for each. Note that Gemma 2B (int4) was the only model we could run on iOS due to its memory constraints, and we are working on enabling other models on iOS as well.

Performance Optimizations

To achieve the performance numbers above, countless optimizations were made across MediaPipe, TensorFlow Lite, XNNPack (our CPU neural network operator library), and our GPU-accelerated runtime. The following are a select few that resulted in meaningful performance improvements.

Weights Sharing: The LLM inference process comprises 2 phases: a prefill phase and a decode phase. Traditionally, this setup would require 2 separate inference contexts, each independently managing resources for its corresponding ML model. Given the memory demands of LLMs, we've added a feature that allows sharing the weights and the KV cache across inference contexts. Although sharing weights might seem straightforward, it has significant performance implications when sharing between compute-bound and memory-bound operations. In typical ML inference scenarios, where weights are not shared with other operators, they are meticulously configured for each fully connected operator separately to ensure optimal performance. Sharing weights with another operator implies a loss of per-operator optimization and this mandates the authoring of new kernel implementations that can run efficiently even on sub-optimal weights.

Optimized Fully Connected Ops: XNNPack’s FULLY_CONNECTED operation has undergone two significant optimizations for LLM inference. First, dynamic range quantization seamlessly merges the computational and memory benefits of full integer quantization with the precision advantages of floating-point inference. The utilization of int8/int4 weights not only enhances memory throughput but also achieves remarkable performance, especially with the efficient, in-register decoding of 4-bit weights requiring only one additional instruction. Second, we actively leverage the I8MM instructions in ARM v9 CPUs which enable the multiplication of a 2x8 int8 matrix by an 8x2 int8 matrix in a single instruction, resulting in twice the speed of the NEON dot product-based implementation.

Balancing Compute and Memory: Upon profiling the LLM inference, we identified distinct limitations for both phases: the prefill phase faces restrictions imposed by the compute capacity, while the decode phase is constrained by memory bandwidth. Consequently, each phase employs different strategies for dequantization of the shared int8/int4 weights. In the prefill phase, each convolution operator first dequantizes the weights into floating-point values before the primary computation, ensuring optimal performance for computationally intensive convolutions. Conversely, the decode phase minimizes memory bandwidth by adding the dequantization computation to the main mathematical convolution operations.

Flowchart showing compute-intensive prefill phase and memory-intensive decode phase, highlighting difference in performance bottlenecks
During the compute-intensive prefill phase, the int4 weights are dequantized a priori for optimal CONV_2D computation. In the memory-intensive decode phase, dequantization is performed on the fly, along with CONV_2D computation, to minimize the memory bandwidth usage.

Custom Operators: For GPU-accelerated LLM inference on-device, we rely extensively on custom operations to mitigate the inefficiency caused by numerous small shaders. These custom ops allow for special operator fusions and various LLM parameters such as token ID, sequence patch size, sampling parameters, to be packed into a specialized custom tensor used mostly within these specialized operations.

Pseudo-Dynamism: In the attention block, we encounter dynamic operations that increase over time as the context grows. Since our GPU runtime lacks support for dynamic ops/tensors, we opt for fixed operations with a predefined maximum cache size. To reduce the computational complexity, we introduce a parameter enabling the skipping of certain value calculations or the processing of reduced data.

Optimized KV Cache Layout: Since the entries in the KV cache ultimately serve as weights for convolutions, employed in lieu of matrix multiplications, we store these in a specialized layout tailored for convolution weights. This strategic adjustment eliminates the necessity for extra conversions or reliance on unoptimized layouts, and therefore contributes to a more efficient and streamlined process.


What’s Next

We are thrilled with the optimizations and the performance in today’s experimental release of the MediaPipe LLM Inference API. This is just the start. Over 2024, we will expand to more platforms and models, offer broader conversion tools, complimentary on-device components, high level tasks, and more.

You can check out the official sample on GitHub demonstrating everything you’ve just learned about and read through our official documentation for even more details. Keep an eye on the Google for Developers YouTube channel for updates and tutorials.


Acknowledgements

We’d like to thank all team members who contributed to this work: T.J. Alumbaugh, Alek Andreev, Frank Ban, Jeanine Banks, Frank Barchard, Pulkit Bhuwalka, Buck Bourdon, Maxime Brénon, Chuo-Ling Chang, Yu-hui Chen, Linkun Chen, Lin Chen, Nikolai Chinaev, Clark Duvall, Rosário Fernandes, Mig Gerard, Matthias Grundmann, Ayush Gupta, Mohammadreza Heydary, Ekaterina Ignasheva, Ram Iyengar, Grant Jensen, Alex Kanaukou, Prianka Liz Kariat, Alan Kelly, Kathleen Kenealy, Ho Ko, Sachin Kotwani, Andrei Kulik, Yi-Chun Kuo, Khanh LeViet, Yang Lu, Lalit Singh Manral, Tyler Mullen, Karthik Raveendran, Raman Sarokin, Sebastian Schmidt, Kris Tonthat, Lu Wang, Tris Warkentin, and the Gemma Team

Programmatically access working locations with the Calendar API

Posted by Chanel Greco, Developer Advocate

Giving Google Workspace users the ability to set their working location and working hours in Google Calendar was an important step in helping our customers’ employees adapt to a hybrid world. Sending a Chat message asking “Will you be in the office tomorrow?” soon became obsolete as anyone could share where and when they would be working within Calendar.

To improve the hybrid working experience, many organizations rely on third-party or company-internal tools to enable tasks like hot desk booking or scheduling days in the office. Until recently, there was no way to programmatically synchronize the working location set in Calendar with such tools.


Image showing working locations visible via Google Calendar in the Robin app
Robin displays the working location from Google Calendar in their application and updates the user's Google Calendar when they book a desk in Robin

Programmatically read and write working locations

We are pleased to announce that the Calendar API has been updated to make working locations available and this added functionality is generally available (feature is only available for eligible Workspace editions). This enables developers to programmatically read and write the working location of Google Workspace users. This can be especially useful in three use cases that have surfaced in discussions with customers which we are going to explore together.

1.     Synchronize with third-party tools

Enhancing the Calendar API enables developers to synchronize user’s working location with third-party tools like Robin and Comeen. For example, some companies provide their employees with desk booking tools so they can book their workplace in advance for the days they will be on-site. HR management tools are also common for employees to request and set “Work from home” days. In both situations the user had to set their working location in two separate tools: their desk booking tool and/or HR management system and Google Calendar.

Thanks to the working location being accessible through the Calendar API this duplicate work is no longer necessary since a user’s working location can be programmatically set. And if a user's calendar is the single source of truth? In that case, the API can be used to read the working location from the user’s calendar and write it to any permissioned third-party tool.


Image showing Google Workspace Add-on synchronizing users' working locations in the Comeen app.
Comeen’s Google Workspace Add-on synchronizes the user’s’ working locations whenever the user updates their working location, either in Google Calendar or in Comeen's add-on

2.     Display working location on other surfaces

The API enables the surfacing of the user's working location in other tools, creating interesting opportunities. For instance, some of our customers have asked for ways to better coordinate in-office days. Imagine you are planning to be at the office tomorrow. Who else from your team will be there? Who from a neighboring team might be on-site for a coffee chat?

With the Calendar API, a user's working location can be displayed in tools like directories, or a hybrid-work scheduling tool. The goal is to make a user’s working location available in the systems that are relevant to our customers.

3.     Analyze patterns

The third use case that surfaced from discussions with our customers is analyzing working location patterns. With many of our customers having a hybrid work approach it’s vital to have a good understanding of the working patterns. For example, which days do locations reach maximal legal capacity? Or, when does the on-campus restaurant have to prepare more meals for employees working on-site?

The API answers these and other questions so that facility management can adapt their resources to the needs of their employees.


How to get started

Now that you have an idea of the possibilities the updated Calendar API creates, we want to guide you on how you can get started using it.

  • Check out the developer documentation for reading and writing a user's working locations.
  • Watch the announcement video on the Google Workspace Developers YouTube channel.
  • Check the original post about the launch of the working location feature for a list of all Google Workspace plans that have access to the feature.

New GitHub repo: Using Firebase to add cloud-based features to games built on Unity


A while back, a group of us Google Cloud Platform Developer Programs Engineers teamed up with gaming fans in Firebase Engineering to work on an interesting project. We all love games, gamers, and game developers, and we wanted to support those developers with solutions that accomplish common tasks so they can focus more on what they do best: making great games.

The result was Firebase Unity Solutions. It’s an open-source github repository with sample projects and scripts. These projects utilize Firebase tools and services to help you add cloud-based features to your games being built on Unity.

Each feature will include all the required scripts, a demo scene, any custom editors to help you better understand and use the provided assets, and a tutorial to use as a step-by-step guide for incorporating the feature into your game.

The only requirements are a Unity project with the .NET 2.0 API level enabled, and a project created with the Firebase Console.

Introducing Firebase Leaderboard


Our debut project is the Firebase_Leaderboard, a set of scripts that utilize Firebase Realtime Database to create and manage a cross-platform high score leaderboard. With the LeaderboardController MonoBehaviour, you can retrieve any number of unique users’ top scores from any time frame. Want the top 5 scores from the last 24 hours? Done. How about the top 100 from last week? You got it.

Once a connection to Firebase is established, scores are retrieved automatically, including any new scores that come in while the controller is enabled.

If any of those parameters are modified (the number of scores to retrieve, or the start or end date), the scores are automatically refreshed. The content is always up-to-date!

private void Start() {
    this.leaderboard = FindObjectOfType();
    leaderboard.FirebaseInitialized += OnInitialized;
    leaderboard.TopScoresUpdated += UpdateScoreDisplay;
    leaderboard.UserScoreUpdated += UpdateUserScoreDisplay;
    leaderboard.ScoreAdded += ScoreAdded;

    MessageText.text = "Connecting to Leaderboard...";
}
With the same component, you can add new scores for current users as well, meaning a single script handles both read and write operations on the top score data.

public void AddScore(string userId, int score) {
    leaderboard.AddScore(userId, score);
}
For step-by-step instructions on incorporating this cross-platform leaderboard into your Unity game using Firebase Realtime Database, follow the instructions here. Or check out the Demo Scene to see a version of the leaderboard in action!

We want to hear from you

We have ideas for what features to add to this repository moving forward, but we want to hear from you, too! What game feature would you love to see implemented in Unity using Firebase tools? What cloud-based functionality would you like to be able to drop directly into your game? And how can we improve the Leaderboard, or other solutions as they are added? You can comment below, create feature requests and file bugs on the github repo, or join the discussion in this Google Group.

Let’s make great games together!

Three steps to prepare your users for cloud data migration


When preparing to migrate a legacy system to a cloud-based data analytics solution, as engineers we often focus on the technical benefits: Queries will run faster, more data can be processed and storage no longer has limits. For IT teams, these are significant, positive developments for the business. End users, though, may not immediately see the benefits of this technology (and internal culture) change. For your end users, running macros in their spreadsheet software of choice or expecting a query to return data in a matter of days (and planning their calendar around this) is the absolute norm. These users, more often than not, don’t see the technology stack changes as a benefit. Instead, they become a hindrance. They now need to learn new tools, change their workflows and adapt to the new world of having their data stored more than a few milliseconds away—and that can seem like a lot to ask from their perspective.

It’s important that you remember these users at all stages of a migration to cloud services. I’ve worked with many companies moving to the cloud, and I’ve seen how easy it is to forget the end users during a cloud migration, until you get a deluge of support tickets letting you know that their tried-and-tested methods of analyzing data no longer work. These added tickets increase operational overhead on the support and information technology departments, and decrease the number of hours that can be spent on doing the useful, transformative work—that is, analyzing the wealth of data that you now have available. Instead, you can end up wasting time trying to mold these old, inconvenient processes to fit this new cloud world, because you don’t have the time to transform into a cloud-first approach.

There are a few essential steps you can take to successfully move your enterprise users to this cloud-first approach.

1. Understand the scope

There are a few questions you should ask your team and any other teams inside your organization that will handle any stored or accessed data.
  • Where is the data coming from?
  • How much data do we process?
  • What tools do we use to consume and analyse the data?
  • What happens to the output that we collect?

When you understand these fundamentals during the initial scoping of a potential data migration, you’ll understand the true impact that such a project will have on those users consuming the affected data. It’s rarely as simple as “just point your tool at the new location.” A cloud migration could massively increase expected bandwidth costs if the tools aren’t well-tuned for a cloud-based approach—for example, by downloading the entire data set before analyzing the required subset.

To avoid issues like this, conduct interviews with the teams that consume the data. Seek to understand how they use and manipulate the data they have access to, and how they gain access to that data in the first place. This will all need to be replicated in the new cloud-based approach, and it likely won’t map directly. Consider using IAM unobtrusively to grant teams access to the data they need today. That sets you up to expand this scope easily and painlessly in the future. Understand the tools in use today, and reach out to vendors to clarify any points.. Don’t assume a tool does something if you don’t have documentation and evidence. It might look like the tool just queries the small section of data it requires, but you can’t know what’s going on behind the scenes unless you wrote it yourself!

Once you’ve gathered this information, develop clear guidelines for what new data analytics tooling should be used after a cloud migration, and whether it is intended as a substitute or a complement to the existing tooling. It is important to be opinionated here. Your users will be looking to you for guidance and support with new tooling. Since you’ll have spoken to them extensively beforehand, you’ll understand their use cases and can make informed, practical recommendations for tooling. This also allows you to scope training requirements. You can’t expect users to just pick up new tools and be as productive as they had been right away. Get users trained and comfortable with new tools before the migration happens.

2. Establish champions

Teams or individuals will sometimes stand against technology change. This can be for a variety of reasons, including worries over job security, comfort with existing methods or misunderstanding of the goals of the project. By finding and utilizing champions within each team, you’ll solve a number of problems:
  • Training challenges. Mass training is impersonal and can’t be tailored per team. Champions can deliver custom training that will hit home with their team.
  • Transition difficulties. Individual struggles by team can be hard to track and manage. By giving each team a voice through their champion, users will feel more involved in the project, and their issues are more likely to be addressed, reducing friction in the final stages.
  • Overloaded support teams. Champions become the voice of the project within the team too. This can have the effect of reducing support workload in the days, weeks and months during and after a migration, since the champion can be the first port of call when things aren’t running quite as expected.
Don’t underestimate the power of having people represent the project on their own teams, rather than someone outside to the team proposing change to an established workflow. The former is much more likely to be favorably received.

3. Promote the cloud transformation

It is more than likely that the current methods of data ingestion and analysis, and possibly the methods of data output and storage, will be suboptimal, or worse impossible, under the new cloud model. It is important that teams are suitably prepared for these changes. To make the transition easier, consider taking these approaches to informing users and allowing them room to experiment.

  • Promote and develop the understanding of having the power of the cloud behind the data. It’s an opportunity to ask questions of data that might otherwise have been locked away before, whether behind time constraints, or incompatibility with software, or even a lack of awareness that the data was even available to query. By combining data sets, can you and your teams become more evidential, and get better results that answer deeper, more important questions? Invariably, the answer is yes.
  • In the case that an existing tool will continue to be used, it will be invaluable to provide teams with new data locations and instructions for reconfiguring applications. It is important that this is communicated, whether or not the change will be apparent to the user. Undoubtedly, some custom configuration somewhere will break, but you can reduce the frustration of an interruption by having the right information available.
  • By having teams develop and build new tooling early, rather than during or after migration, you’ll give them the ability to play with, learn and develop the new tools that will be required. This can be on a static subset of data pulled from the existing setup, creating a sandbox where users can analyze and manipulate familiar data with new tools. That way, you’ll help drive driving the adoption of new tools early and build some excitement around them. (Your champions are a good resource for this.)

Throughout the process of moving to cloud, remember the benefits that shouldn’t be understated. No longer do your analyses need to take days. Instead, the answers can be there when you need them. This frees up analysts to create meaningful, useful data, rather than churning out the same reports over and over. It allows consumers of the data to access information more freely, without needing the help of a data analyst, by exposing dashboards and tools. But these high-level messages need to be supplemented with the personal needs of the team—show them the opportunities that exist and get them excited! It’ll help these big technological changes work for the people using the technology every day.

Defining SLOs for services with dependencies – CRE life lessons


In a previous episode of CRE Life Lessons, we discussed how service level objectives (SLOs) are an important tool for defining and measuring the reliability of your service. There’s also a whole chapter in the SRE book about this topic. In this episode, we discuss how to define and manage SLOs for services with dependencies, each of which may (or may not!) have their own SLOs.

Any non-trivial service has dependencies. Some dependencies are direct: service A makes a Remote Procedure Call to service B, so A depends on B. Others are indirect: if B in turn depends on C and D, then A also depends on C and D, in addition to B. Still others are structurally implicit: a service may run in a particular Google Cloud Platform (GCP) zone or region, or depend on DNS or some other form of service discovery.

To make things more complicated, not all dependencies have the same impact. Outages for "hard" dependencies imply that your service is out as well. Outages for "soft" dependencies should have no impact on your service if they were designed appropriately. A common example is best-effort logging/tracing to an external monitoring system. Other dependencies are somewhere in between; for example, a failure in a caching layer might result in degraded latency performance, which may or may not be out of SLO.

Take a moment to think about one of your services. Do you have a list of its dependencies, and what impact they have? Do the dependencies have SLOs that cover your specific needs?

Given all this, how can you as a service owner define SLOs and be confident about meeting them? Consider the following complexities:

  • Some of your dependencies may not even have SLOs, or their SLOs may not capture how you're using them.
  • The effect of a dependency's SLO on your service isn't always straightforward. In addition to the "hard" vs "soft" vs "degraded" impact discussed above, your code may complicate the effect of a dependency's SLOs on your service. For example, you have a 10s timeout on an RPC, but its SLO is based on serving a response within 30s. Or, your code does retries, and its impact on your service depends on the effectiveness of those retries (e.g., if the dependency fails 0.1% of all requests, does your retry have a 0.1% chance of failing or is there something about your request that means it is more than 0.1% likely to fail again?).
  • How to combine SLOs of multiple dependencies depends on the correlation between them. At the extremes, if all of your dependencies are always unavailable at the same time, then theoretically your unavailability is based on the max(), i.e., the dependency with the longest unavailability. If they are unavailable at distinct times, then theoretically your unavailability is the sum() of the unavailability of each dependency. The reality is likely somewhere in between.
  • Services usually do better than their SLOs (and usually much better than their service level agreements), so using them to estimate your downtime is often too conservative.
At this point you may want to throw up your hands and give up on determining an achievable SLO for your service entirely. Don't despair! The way out of this thorny mess is to go back to the basics of how to define a good SLO. Instead of determining your SLO bottom-up ("What can my service achieve based on all of my dependencies?"), go top down: "What SLO do my customers need to be happy?" Use that as your SLO.

Risky business

You may find that you can consistently meet that SLO with the availability you get from your dependencies (minus your own home-grown sources of unavailability). Great! Your users are happy. If not, you have some work to do. Either way, the top-down approach of setting your SLO doesn't mean you should ignore the risks that dependencies pose to it. CRE tech lead Matt Brown gave a great talk at SRECon18 Americas about prioritizing risk (slides), including a risk analysis spreadsheet that you can use to help identify, communicate, and prioritize the top risks to your error budget (the talk expands on a previous CRE Life Lessons blog post).

Some of the main sources of risk to your SLO will of course come from your dependencies. When modeling the risk from a dependency, you can use its published SLO, or choose to use observed/historical performance instead: SLOs tend to be conservative, so using them will likely overestimate the actual risk. In some cases, if a dependency doesn't have a published SLO and you don't have historical data, you'll have to use your best guess. When modeling risk, also keep in mind the difficulties described above about mapping a dependency's SLO onto yours. If you're using the spreadsheet, you can try out different values (for example, the published SLO for a dependency versus the observed performance) and see the effect they have on your projected SLO performance.1

Remember that you're making these estimates as a tool for prioritization; they don't have to be perfectly accurate, and your estimates won't result in any guarantees. However, the process should give you a better understanding of whether you're likely to consistently meet your SLO, and if not, what the biggest sources of risk to your error budget are. It also encourages you to document your assumptions, where they can be discussed and critiqued. From there, you can do a pragmatic cost/benefit analysis to decide which risks to mitigate.

For dependencies, mitigation might mean:
  • Trying to remove it from your critical path
  • Making it more reliable; e.g., running multiple copies and failing over between them
  • Automating manual failover processes
  • Replacing it with a more reliable alternative
  • Sharding it so that the scope of failure is reduced
  • Adding retries
  • Increasing (or decreasing, sometimes it is better to fail fast and retry!) RPC timeouts
  • Adding caching and using stale data instead of live data
  • Adding graceful degradation using partial responses
  • Asking for an SLO that better meets your needs
There may be very little you can do to mitigate unavailability from a critical infrastructure dependency, or it might be prohibitively expensive. Instead, mitigate other sources of error budget burn, freeing up error budget so you can absorb outages from the dependency.

A series of earlier CRE Life Lessons posts (1, 2, 3) discussed consequences and escalations for SLO violations, as a way to balance velocity and risk; an example of a consequence might be to temporarily block new releases when the error budget is spent. If an outage was caused by one of your service's dependencies, should the consequences still apply? After all, it's not your fault, right?!? The answer is "yes"—the SLO is your proxy for your users' happiness, and users don't care whose "fault" it is. If a particular dependency causes frequent violations to your SLO, you need to mitigate the risk from it, or mitigate other risks to free up more error budget. As always, you can be pragmatic about how and when to enforce consequences for SLO violations, but if you're regularly making exceptions, especially for the same cause, that's a sign that you should consider lowering your SLOs, or increasing the time/effort you are putting into improving reliability.

In summary, every non-trivial service has dependencies, probably many of them. When choosing an SLO for your service, don't think about your dependencies and what SLO you can achieve—instead, think about your users, and what level of service they need to be happy. Once you have an SLO, your dependencies represent sources of risk, but they're not the only sources. Analyze all of the sources of risk together to predict whether you'll be able to consistently meet your SLO and prioritize which risks to mitigate.

1 If you're interested, The Calculus of Service Availability has more in-depth discussion about modeling risks from dependencies, and strategies for mitigating them.

Scale big while staying small with serverless on GCP — the Guesswork.co story


[Editor’s note: Mani Doraisamy built two products—Guesswork.co and CommerceDNA—on top of Google Cloud Platform. In this blog post he shares insights into how his application architecture evolved to support the changing needs of his growing customer base while still staying cost-effective.]

Guesswork is a machine learning startup that helps e-commerce companies in emerging markets recommend products for first-time buyers on their site. Large and established e-commerce companies can analyze their users' past purchase history to predict what product they are most likely to buy next and make personalized recommendations. But in developing countries, where e-commerce companies are mostly focused on attracting new users, there’s no history to work from, so most recommendation engines don’t work for them. Here at Guesswork, we can understand users and recommend them relevant products even if we don’t have any prior history about them. To do that, we analyze lots of data points about where a new user is coming from (e.g., did they come from an email campaign for t-shirts, or a fashion blog about shoes?) to find every possible indicator of intent. Thus far, we’ve worked with large e-commerce companies around the world such as Zalora (Southeast Asia), Galeries Lafayette Group (France) and Daraz (South Asia).

Building a scalable system to support this workload is no small feat. In addition to being able to process high data volumes per each customer, we also need to process hundreds of millions of users every month, plus any traffic spikes that happen during peak shopping seasons.

As a bootstrapped startup, we had three key goals while designing the system:

  1. Stay small. As a small team of three developers, we didn’t want to add any additional personnel even if we needed to scale up for a huge volume of users.
  2. Stay profitable. Our revenue is based on the performance of our recommendation engine. Instead of a recurring fee, customers pay us a commission on sales to their users that come from our recommendations. This business model made our application architecture and infrastructure costs a key factor in our ability to turn a profit.
  3. Embrace constraints. In order to increase our development velocity and stay flexible, we decided to trade off control over our development stack and embrace constraints imposed by managed cloud services.

These three goals turned into our motto: "I would rather optimize my code than fundraise." By turning our business goals into a coding problem, we also had so much more fun. I hope you will too, as I recount how we did it.

Choosing a database: The Three Musketeers

The first stack we focused was the database layer. Since we wanted to build on top of managed services, we decided to go with Google Cloud Platform (GCP)—a best-in-class option when it comes to scaling, in our opinion.

But, unlike traditional databases, cloud databases are not general purpose. They are specialized. So we picked three separate databases for transactional, analytical and machine learning workloads. We chose:

  • Cloud Datastore for our transactional database, because it can support high number of writes. In our case, the user events are in the billions and are updated in real time into Cloud Datastore.
  • BigQuery to analyze user behaviour. For example, we understand from BigQuery that users coming from a fashion blog usually buy a specific type of formal shoes.
  • Vision API to analyze product images and categorize products. Since we work with e-commerce companies across different geographies, the product names and descriptions are in different languages, and categorizing products based on images is more efficient than text analysis. We use this data along with user behaviour data from BigQuery and Cloud Datastore to make product recommendations.

First take: the App Engine approach

Once we chose our databases, we moved on to selecting the front-end service to receive user events from e-commerce sites and update Cloud Datastore. We chose App Engine, since it is a managed service and scales well at our volumes. Once App Engine updates the user events in Cloud Datastore, we synchronized that data into BigQuery and our recommendation engine using Cloud Dataflow, another managed service that orchestrates different databases in real time (i.e., streaming mode).

This architecture powered the first version of our product. As our business grew, our customers started asking for new features. One feature request was to send alerts to users when the price of a product changed. So, in the second version, we began listening to price changes in our e-commerce sites and triggered events to send alerts. The product’s price is already recorded as a user event in Cloud Datastore, but to detect change:

  • We compare the price we receive in the user event with the product master and determine if there is a difference.
  • If there is a difference, we propagate it to the analytical and machine learning databases to trigger an alert and reflect that change in the product recommendation.

There are millions of user events every day. Comparing each user event data with product master increased the number of reads on our datastore dramatically. Since each Cloud Datastore read counts toward our GCP monthly bill, it increased our costs to an unsustainable level.

Take two: the Cloud Functions approach

To bring down our costs, we had two options for redesigning our system:

  • Use memcache to load the product master in memory and compare the price/stock for every user event. With this option, we had no guarantee that memcache would be able to hold so many products in memory. So, we might miss a price change and end up with inaccurate product prices.
  • Use Cloud Firestore to record user events and product data. Firestore has an option to trigger Cloud Functions whenever there’s a change in value of an entity. In our case, the price/stock change automatically triggers a cloud function that updates the analytical and machine learning databases.

During our redesign, Firestore and Cloud Functions were in alpha, but we decided to use them as it gave us a clean and simple architecture:

  • With Firestore, we replaced both App Engine and Datastore. Firestore was able to accept user requests directly from a browser without the need for a front-end service like App Engine. It also scaled well like Datastore.
  • We used Cloud Functions not only as a way to trigger price/stock alerts, but as an orchestration tool to synchronize data between Firestore, BigQuery and our recommendation engine.

It turned out to be a good decision, as Cloud Functions scaled extremely well, even in alpha. For example, we went from one to 20 million users on Black Friday. In this new architecture, Cloud Functions replaced Dataflow’s streaming functionality with triggers, while providing a more intuitive language (JavaScript) than Dataflow’s pipeline transformations. Eventually, Cloud Functions became the glue that tied all the components together.

What we gained

Thanks to the flexibility of our serverless microservice-oriented architecture, we were able to replace and upgrade components as the needs of our business evolved without redesigning the whole system. We achieved the key goal of being profitable by using the right set of managed services and keeping our infrastructure costs well below our revenue. And since we didn't have to manage any servers, we were also able to scale our business with a small engineering team and still sleep peacefully at night.

Additionally, we saw some great outcomes that we didn't initially anticipate:

  • We increased our sales commissions by improving recommendation accuracy

    The best thing that happened in this new version was the ability to A/B test new algorithms. For example, we found that users who browse e-commerce sites with an Android phone are more likely to buy products that are on sale. So, we included user’s device as a feature in the recommendation algorithm and tested it with a small sample set. Since, Cloud Functions are loosely coupled (with Cloud Pub/Sub), we could implement a new algorithm and redirect users based on their device and geography. Once the algorithm produced good results, we rolled it out to all users without taking down the system. With this approach, we were able to continuously improve the accuracy of our recommendations, increasing revenue.
  • We reduced costs by optimizing our algorithm

    As counter intuitive it may sound, we also found that paying more money for compute didn't improve accuracy. For example, we analyzed a month of a user’s events vs. the latest session’s events to predict what the user was likely to buy next. We found that the latest session was more accurate even though it had less data points. The simpler and more intuitive the algorithm, the better it performed. Since Cloud Functions are modular by design, we were able to refactor each module and reduce costs without losing accuracy.
  • We reduced our dependence on external IT teams and signed more customers 

    We work with large companies and depending on their IT team, it can take a long time to integrate our solution. Cloud Functions allowed us to implement configurable modules for each of our customers. For example, while working with French e-commerce companies, we had to translate the product details we receive in the user events into English. Since Cloud Functions supports Node.js, we enabled scriptable modules in JavaScript for each customer that allowed us to implement translation on our end, instead of waiting for the customer’s IT team. This reduced our go-live time from months to days, and we were able to sign up new customers who otherwise might not have been able to invest the necessary time and effort up-front.

Since Cloud Functions was alpha at the time, we did face challenges while implementing non-standard functionality such as running headless Chrome. In such cases, we fell back on App Engine flexible environment and Compute Engine. Over time though, the Cloud Functions product team moved most of our desired functionality back into the managed environment, simplifying maintenance and giving us more time to work on functionality.

Let a thousand flowers bloom

If there is one take away from this story, it is this: Running a bootstrapped startup that serves 100 million users with three developers was unheard of just five years ago. With the relentless pursuit of abstraction among cloud platforms, this has become a reality. Serverless computing is at the bleeding edge of this abstraction. Among the serverless computing products, I believe Cloud Functions has a leg up on its competition because it stands on the shoulders of GCP's data products and their near-infinite scale. By combining simplicity with scale, Cloud Functions is the glue that makes GCP greater than the sum of its parts.The day has come when a bootstrapped startup can build a large-scale application like Gmail or Salesforce. You just read one such story— now it’s your turn :)

Building reliable deployments with Spinnaker, Container Engine and Container Builder


Kubernetes has some amazing primitives to help you deploy your applications, which let Kubernetes handle the heavy lifting of rolling out containerized applications. With Container Engine you can have your Kubernetes clusters up in minutes ready for your applications to land on them.

But despite the ease of standing up this fine-tuned deployment engine, there are many things that need to happen before deployments can even start. And once they’ve kicked off, you’ll want to make sure that your deployments have completed safely and in a timely manner.

To fill these gaps, developers often look to tools like Container Builder and Spinnaker to create continuous delivery pipelines.


We recently created a solutions guide that shows you how to build out a continuous delivery pipeline from scratch using Container Builder and Spinnaker. Below is an example continuous delivery pipeline that validates your software, builds it, and then carefully rolls it out to your users:


First, your developers tag your software and push it to a Git repository. When the tagged commit lands in your repository, Container Builder detects the change and begins the process of building and testing your application. Once your tests have passed, an immutable Docker image of your application is tagged and pushed to Container Registry. Spinnaker picks it up from here by detecting that a new Docker image has been pushed to your registry and starting the deployment process.

Spinnaker’s pipeline stages allow you to create complex flows to roll out changes. The example here uses a canary deployment to roll out the software to a small percentage of users, and then runs a functional validation of your application. Once those functional checks are complete in the canary environment, Spinnaker pauses the deployment pipeline and waits for a manual approval before it rolls out the application to the rest of your users. Before approving it, you may want to inspect some key performance indicators, wait for traffic in your application to settle or manually validate the canary environment. Once you’re satisfied with the changes, you can approve the release and Spinnaker completes rolling out your software.

As you can imagine, this exact flow won’t work for everyone. Thankfully Spinnaker and Container Builder give you flexible and granular stages that allow you to automate your release process while mapping it to the needs of your organization.

Get started by checking out the Spinnaker solution. Or visit the documentation to learn more about Spinnaker’s pipeline stages.


Customizing Stackdriver Logs for Container Engine with Fluentd


Many Google Cloud Platform (GCP) users are now migrating production workloads to Container Engine, our managed Kubernetes environment.  Container Engine supports Stackdriver logging on GCP by default, which uses Fluentd under the hood to send your logs to Stackdriver. 


You may also want to fully customize your Container Engine cluster’s Stackdriver logs with additional logging filters. If that describes you, check out this tutorial where you’ll learn how you can configure Fluentd in Container Engine to apply additional logging filters prior to sending your logs to Stackdriver.

Using Stackdriver Logging for dedicated game server instances: new tutorial


Capturing logs from dedicated game server instances in a central location can be useful for troubleshooting, keeping track of instance runtimes and machine load, and capturing historical data that occurs during the lifetime of a game.

But collecting and making sense of these logs can be tricky, especially if you are launching the same game in multiple regions, or have limited resources on which to collect the logs themselves.

One possible solution to these problems is to collect your logs in the cloud. Doing this enables you to mine your data with tools that deliver speed and power not possible from an on-premise logging server. Storage and data management is simple in the cloud and not bound by physical hardware. Additionally, you can access cloud logging resources globally. Studios and BI departments across the globe can access the same logging database regardless of physical location, making collaboration for distributed teams significantly easier.


We recently put together a tutorial that shows you how to integrate Stackdriver Logging, our hosted log management and analysis service for data running on Google Cloud Platform (GCP) and AWS, into your own dedicated game server environment. It also offers some key storage strategies, including how to migrate this data to BigQuery and other Google Cloud tools. Check it out, and let us know what other Google Cloud tools you’d like to learn how to use in your game operations. You can reach me on Twitter at @gcpjoe.