These Googlers stepped it up for Walktober

Yousuf Fauzan’s mother knew she’d be on the phone a lot this October. Every day during the month, she’d talk to her son for hours as he paced around his home in California. “She would get irritated, she would disconnect the call, then I’d call again 15 minutes later.”

Calling his mom — and pretty much everyone he knows — was how Yousuf, a YouTube software engineer, passed the time while getting his steps in for “Walktober,” Google’s annual employee walking competition. “I don’t talk to people on the phone often, but during October, I call anyone and everyone I’ve ever known.” After spending his workday walking during meetings, Yousuf would lap around the inside of his condo from 7:00 p.m. until 4:00 a.m. to hold his top spot on the leaderboard. By the end of the month, he’d accumulated more than two million steps.

Planning lead Tiffany Bartish-Katz says this is the kind of “fierce but friendly” competition that Walktober attracts. Started in 2011 as a local effort in Google’s Cambridge, Massachusetts office, Walktober quickly went global: This year, more than 26,000 employees across 190 offices joined the competition, putting in over five billion steps. “I’m always a little awestruck by the number of people who engage in this very simple, friendly, fun, grassroots project,” Tiffany says. And the planning team works hard to make sure everyone gets in the spirit — from ultra walkers like Yousuf, to those who are adding just a few more thousand steps to their routines.

Some Walktober participants decided to put their step counts towards a good cause. Last year, Greg Kroleski, a Google Cloud Product Manager, walked for 24 hours straight. As he considered doing another 24-hour challenge this year, a coworker suggested tying it to a fundraiser. “A lot of people paid attention last year. I wanted to direct that attention to something good.” Greg dedicated this year’s challenge, and his team’s entire Walktober effort, to raise awareness for myalgic encephalomyelitis/chronic fatigue syndrome (ME/CF), a chronic disease that causes overwhelming fatigue. He and his colleagues ended up raising $14,000. As for the 24-hour challenge? Greg logged over 204,000 steps that day, breaking a Google Walktober record…for a few hours, at least. “Unfortunately, the next day, someone else broke my record.” All the more reason to give it another go next year. “You might see me again,” he says.

Ziad Reslan, a Product Policy Advisor at Google, also channeled his team’s Walktober efforts towards something good. “I wanted to spend the entire last day of Walktober walking as an ode to the journeys of millions of refugees who have no choice but to walk to get to safety,” he says. To raise awareness for LGBTQ+ refugees in the Middle East in particular, Ziad organized a walk from Google’s San Francisco office to its Mountain View headquarters — a familiar 38.8-mile route for California commuters. He received over $25,000 in pledged donations from fellow Googlers, with a handful joining him throughout the day.

When Ziad and his colleagues reached the Mountain View campus that evening, he was overwhelmed: “I teared up remembering the first time I had ever been [to Mountain View] wishing to become a Googler,” he says. “And now here I was, walking to it surrounded by other Googlers for a good cause.”

Power your holiday strategy with helpful insights

This year’s holiday shopping season is shaping up to be one of the biggest yet. In fact, 53% of consumers plan to shop online more this year compared to last year.[1b9db3]To help you prepare, check out the Google Shopping Holiday 100, featuring our predictions for the most popular categories and products in the U.S. this holiday season.

The Holiday 100 is a great way to help you understand what people are shopping for. The Insights page in Google Ads was designed to keep businesses up to date on similar trends and insights, which is especially useful during the holiday season. In the coming weeks, you’ll see four new features roll out on the Insights page globally to help you drive results this holiday season and beyond.

Demand forecasts (beta): Previously, the Insights page focused on historical performance — trends that explained why your ads performed the way they did. Now, you’ll see more forward-looking trends with demand forecasts (beta). By combining machine learning technology with past seasonal search trends, these forecasts predict emerging search interest over the next six months. These insights are personalized to your business, meaning that you’ll see trends based on the categories where you advertise.

For example, let’s say you’re a beauty retailer. You might see a prediction that search interest in "perfumes & fragrances” will start to trend in the middle of November with an increase of 27%. Interest then peaks to 93% on Black Friday and tapers off in the following weeks. To help you understand this forecast, you’ll see trendlines for predicted search interest, actual search interest, and your clicks (the amount of traffic you’ve already received from this trend).

On the right side of the page, you can view trend details to see the specific searches that are predicted to increase — like “clean perfume” or “sandalwood.” These insights help you better prepare your budgeting, marketing and merchandising plans to meet the rise in consumer demand.

A desktop screen showing increasing interest for "perfumes & fragrances" on a line graph
Our clients find strategic value in demand forecasts, especially as we approach Black Friday and Cyber Monday. Some of our clients are even using this data to help inform inventory and product development. Aaron Levy
Head of Paid Search, Tinuiti

Consumer interest insights (beta): Are you interested in learning how people search for your business? Consumer interest insights (beta) aggregate and anonymize the top-performing search query themes that drive performance in your campaigns. You’ll see the number of people who searched for each theme, its growth, and how it performed in your account.

As that beauty retailer, you might see that the top themes in the “perfumes'' category are “affordable” and “floral,” and that your overall impressions for the theme increased by 12%. These themes can be found in the search themes section of the page, and can help you update your marketing and product feed copy to include similar words and phrases.

A desktop screen showing a "consumer spotlight" page for a beauty retailer

Audience insights (beta): With audience insights (beta), you can understand more about the interests and affinities of your customers, including what creative resonates the most with them. As the beauty retailer, for example, you might discover that people interested in beauty products prefer the headline “10 must-buy winter fragrances” — and that the audience took part in 57% of the conversions in your campaign.

A desktop screen showing a page titled "understand who is engaging with your campaign," with different boxes for audience insights

Change history insights and auction insights (beta): Now, you can find both change history insights and auction insights throughout the Insights page. This can help you understand how shifts in auction competition or changes you made in your account impacted performance.

Many businesses are already using the Insights page to drive growth. Etsy saw an increase in searches for “Sweatshirts & Hoodies” on the Insights page and used that information to help inform their website merchandising, content strategy and ad copy. This contributed to a 49% lift in sales for Google Search and Shopping campaigns in that sub-category.

These updates will launch in the coming weeks at both the campaign and account level. In the meantime, visit the Insights page on Google Ads to check out the latest trends for your business.

The News Minute turns fans into members

This picture shows The News Minute team. There are a group of people inside an office room. Some of the group are seated on the floor while others are standing behind them. There are 28 people visible. The room has white walls with posters on and the floor is a red color.

The News Minute team meet up in the office.

A note from Ludovic Blecher, Head of Google News Initiative Innovation: The GNI Innovation Challengeprogram is designed to stimulate forward-thinking ideas for the news industry. The story below by Ragamalika Karthikeyan, Editor Special Projects & Experimentsat The News Minute, is part of an innovator seriessharing inspiring stories and learnings from funded projects.

It was 2018, and the south Indian state of Kerala was reeling from the worst floods in a century. The floods hit on August 15 — India’s Independence Day. The media’s attention was focused on the holiday, and even as the crisis in Kerala became more and more critical, the floods relegated to a small feature on the national news. In a country as large and diverse as India, it’s difficult to represent everything happening on any given day. This is what motivated us to launch The News Minute (TNM) in 2014. From its beginnings, TNM has been a media platform reporting from, and about, South India, often for an out-of-country audience. It has also emerged as a strong feminist voice in Indian media, setting the standards for sensitive and on-the-ground coverage of issues related to children and women.

Turning readers into subscribers

Through support from the Google News Initiative, we at TNM have been able to identify a new, sustainable revenue stream that supplements our existing advertising revenue model. Analyzing data around user behavior helped us realize that our ardent readers were ready to pay us to support our journalism, so we decided to launch a membership program, which quickly gained members - around 50% of our members came on board within the first five months. After that, our numbers have been slowly but steadily increasing. It’s been about a year and a half since we launched the project, and we’ve hit 3,000 subscribers.

Building a platform for subscribers

During the GNI project, we were able to identify what we wanted our membership program to look like. The main components we built were the membership offerings and pricing, the legal and financial infrastructure, the technical infrastructure and the organizational capability.

There were surprises and challenges along the way: we had to adjust membership offerings based on early learnings, and processing payments was something we had to spend some time thinking about. We also wanted to make sure that the membership experience was worthwhile. Thanks to the collective wisdom of both our reader community and GNI, we were able to improve and adjust to create the best product possible.

Poised for growth

When we shift to a model where our audience is paying for our journalism, the focus automatically shifts to more community-driven, in-depth journalism that serves the public good. And this also aligns with our mission at TNM. When members of the public pay directly for independent journalism, it strengthens our ability to remain independent.

This launch taught us two really important things. One, we’re on the right track! Even though we had to make several pivots, we’re well-poised to grow the membership program, not just with the Indian diaspora, but with resident Indians as well. Two, we want to keep offering our readers other ways to support our work.

The GNI project put us on the road to a sustainable revenue model that is incredibly different from our traditional advertising-driven model. We’re looking forward to growing this new effort, and seeing how it can benefit our goal to provide our community with independent journalism.

Dev Channel Update for Chrome OS

The Dev Channel is being updated to 97.0.4692.20 (Platform version: 14324.13.0) for most Chrome OS devices. Systems will be receiving updates over the next several days.

If you find new issues, please let us know by visiting our forum or filing a bug. Interested in switching channels Find out how. You can submit feedback using ‘Report an issue...’ in the Chrome menu (3 vertical dots in the upper right corner of the browser). 

Cole Brown,

Google Chrome OS

Predicting Text Readability from Scrolling Interactions

Illiteracy affects at least 773 million people globally, both young and old. For these individuals, reading information from unfamiliar sources or on unfamiliar topics can be extremely difficult. Unfortunately, these inequalities have been further magnified by the global pandemic as a result of unequal access to education in reading and writing. In fact, UNESCO reports that over 100 million children are falling behind the minimum proficiency level in reading due to COVID-related school closures.

With increasing world-wide access to technology, reading on a device, such as a tablet or phone, has largely taken the place of traditional formats. This provides a unique opportunity to observe reading interactions, e.g., how a reader scrolls through a text, which can inform our understanding of what can make text difficult to read. This understanding is crucial when designing educational applications for low-proficiency readers and language learners, because it can be used to match learners with appropriately leveled texts as well as to support readers in understanding texts beyond their reading level.

In “Predicting Text Readability from Scrolling Interactions”, presented at CoNLL 2021, we show that data from on-device reading interactions can be used to predict how readable a text is. This novel approach provides insights into subjective readability — whether an individual reader has found a text accessible — and demonstrates that existing readability models can be improved by including feedback from scroll-based reading interactions. In order to encourage research in this area and to help enable more personalized tools for language learning and text simplification, we are releasing the dataset of reading interactions generated from our scrolling behavior–based readability assessment of English-language texts.

Understanding Text Difficulty
There are multiple aspects of a text that impact how difficult it is to read, including the vocabulary level, the syntactic structure, and overall coherence. Traditional machine learning approaches to measure readability have exclusively relied on such linguistic features. However, using these features alone does not work well for online content, because such content often contains abbreviations, emojis, broken text, and short passages, which detrimentally impact the performance of readability models.

To address this, we investigated whether aggregate data about the reading interactions of a group can be used to predict how difficult a text is, as well as how reading interactions may differ based on a readers’ understanding. When reading on a device, readers typically interact with text by scrolling in a vertical fashion, which we hypothesize can be used as a coarse proxy for reading comprehension. With this in mind, we recruited 518 paid participants and asked them to read English-language texts of different difficulty levels. We recorded the reading interactions by measuring different features of the participants’ scrolling behavior, such as the speed, acceleration and number of times areas of text were revisited. We then used this information to produce a set of features for a readability classifier.

Predicting Text Difficulty from Scrolling Behavior
We investigated which types of scrolling behaviors were most impacted by text difficulty and tested the significance using linear mixed effect models. In our set up, we have repeated measures, as multiple participants read the same texts and each participant reads more than one text. Using linear mixed-effect models gives us a higher confidence that the differences in interactions we are observing are because of the text difficulty, and not other random effects.

Our results showed that multiple reading behaviors differed significantly based on the text level, for example, the average, maximum and minimum acceleration of scrolling. We found the most significant features to be the total read time and the maximum reading speeds.

We then used these features as inputs to a machine learning algorithm. We designed and trained a support vector machine (i.e., a binary classifier) to predict whether a text is either advanced or elementary based only on scrolling behaviors as individuals interacted with it. The dataset on which the model was trained contains 60 articles, each of which were read by an average of 17 participants. From these interactions we produced aggregate features by taking the mean of the significant measures across participants.


We measured the accuracy of the approach using a metric called f-score, which measures how accurate the model is at classifying a text as either “easy” or “difficult” (where 1.0 reflects perfect classification accuracy). We are able to achieve an f-score of 0.77 on this task, using interaction features alone. This is the first work to show that it is possible to predict the readability of a text using only interaction features.

Improving Readability Models
In order to demonstrate the value of applying readability measures from scrolling behaviors to existing readability models, we integrated scroll-based features into the state-of-the-art automated readability assessment tool, which was released as part of the OneStopEnglish corpus. We found that the addition of interaction features improves the f-score of this model from 0.84 to 0.88. In addition, we were able to significantly outperform this system by using interaction information with simple vocabulary features, such as the number of words in the text, achieving an impressive f-score of 0.96.

In our study, we recorded comprehension scores to evaluate the understanding and readability of text for individuals. Participants were asked three questions per article to assess the reader’s understanding of what they had read. The interaction features of an individual’s scrolling behavior was represented as a high dimensional vector. To explore this data, we visualized the reading interaction features for each participant using t-distributed stochastic neighbor embeddings, which is a statistical method for visualizing high-dimensional data. The results revealed clusters in the comprehension score based on how well individuals understood the text. This shows that there is implicit information in reading interactions about the likelihood that an individual has understood a given text. We refer to this phenomenon as subjective readability. This information can be very useful for educational applications or for simplifying online content.

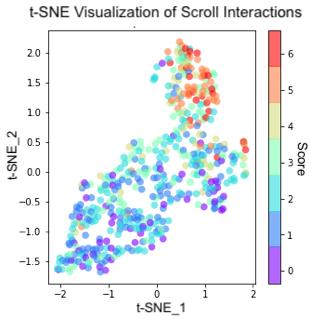
Plot showing t-SNE projection of scroll interactions in 2-dimensions. The color of each data point corresponds to the comprehension score. Clusters of comprehension scores indicate that there are correlations between reading behaviors and comprehension.

Finally, we investigated the extent to which reading interactions vary across audiences. We compared the average scrolling speed across different reader groups, covering reading proficiency and the reader’s first language. We found that the speed distribution varies depending on the proficiency and first language of the audience. This supports the case that first language and proficiency alter the reading behaviors of audiences, which allows us to contextualize the reading behavior of groups and better understand which areas of text may be harder for them to read.

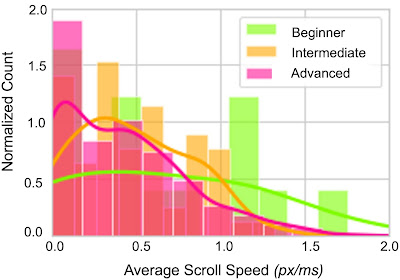
Histogram showing the average speeds of scrolling (in vertical pixels per millisecond) across readers of different proficiency levels (beginner, intermediate and advanced), with lines showing the smoothed trend for each group. A higher average scroll speed indicates faster reading times. For example, a more challenging text that corresponds to slower scroll speeds by advanced readers is associated with higher scroll speeds by beginners because they engage with the text only superficially.

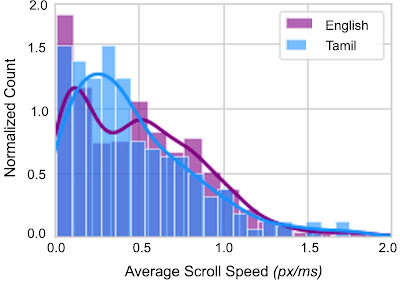
Histogram showing the average speeds of scrolling (in vertical pixels per millisecond) across audiences by first language of the readers, Tamil or English, with lines showing the smoothed trend for each group. A higher average scroll speed indicates faster reading times. Dark blue bars are where the histograms overlap.

Conclusion
This work is the first to show that reading interactions, such as scrolling behavior, can be used to predict the readability of text, which can yield numerous benefits. Such measures are language agnostic, unobtrusive, and robust to noisy text. Implicit user feedback allows insight into readability at an individual level, thereby allowing for a more inclusive and personalisable assessment of text difficulty. Furthermore, being able to judge the subjective readability of text benefits language learning and educational apps. We conducted a 518 participant study to investigate the impact of text readability on reading interactions and are releasing a novel dataset of the associated reading interactions. We confirm that there are statistically significant differences in the way that readers interact with advanced and elementary texts, and that the comprehension scores of individuals correlate with specific measures of scrolling interaction. For more information our conference presentation is available to view.

Acknowledgements
We thank our collaborators Yevgeni Berzak, Tony Mak and Matt Sharifi, as well as Dmitry Lagun and Blaise Aguera y Arcas for their helpful feedback on the paper.

Source: Google AI Blog


Use new immersive backgrounds and styles for Google Meet on the web

Quick launch summary

We’re adding five new immersive backgrounds for Google Meet on the web. The backgrounds feature subtle animation that give your background life or change your lighting. Cafe and condo interiors will have various iterations, such as snowy or rainy weather, which will help dispersed teams better represent their current time zone and climate. 

Various lighting and weather effects will be available


Additionally, we’re giving you more options to customize your video with various light and color filters and more stylised backgrounds.


The new backgrounds and styles are available on Google Meet on the web and can be added before joining a call or during a call using the recently launched effects settings panel.  


Getting started


Rollout pace

  • Rapid Release domains: Gradual rollout to eligible devices (up to 15 days for feature visibility) starting on November 17, 2021
  • Scheduled Release domains: Gradual rollout to eligible devices (up to 15 days for feature visibility) starting on December 2, 2021

Availability

  • Available to all Google Workspace customers, as well as G Suite Basic and Business customers
  • This feature is not available to users with personal Google Accounts


View richer information about colleagues and stakeholders using people chips in Google Sheets

Quick launch summary

You can now add people chips directly into a Google Sheet. These chips allow you to quickly view more information about colleagues or contacts, including their location, job title, and contact information. You can also take actions such as booking a meeting, starting a Chat, sending an email, and more, directly from a smart chip. This feature is already available for Google Docs.


To insert a people chip, type  “@” in any cell to search your directory or by selecting Insert > People chip.


Getting started

  • Admins: There is no admin control for this feature.
  • End users: This feature will be available by default. To insert a smart chip in a cell, press “@” or by selecting Insert > People Chip. Visit the Help Center to learn more about using smart chips in Google Sheets.

Rollout pace


Availability


  • Available to all Google Workspace customers, as well as G Suite Basic and Business customers
  • Available to users with personal Google accounts

Resources


Roadmap