Tag Archives: Google Sheets

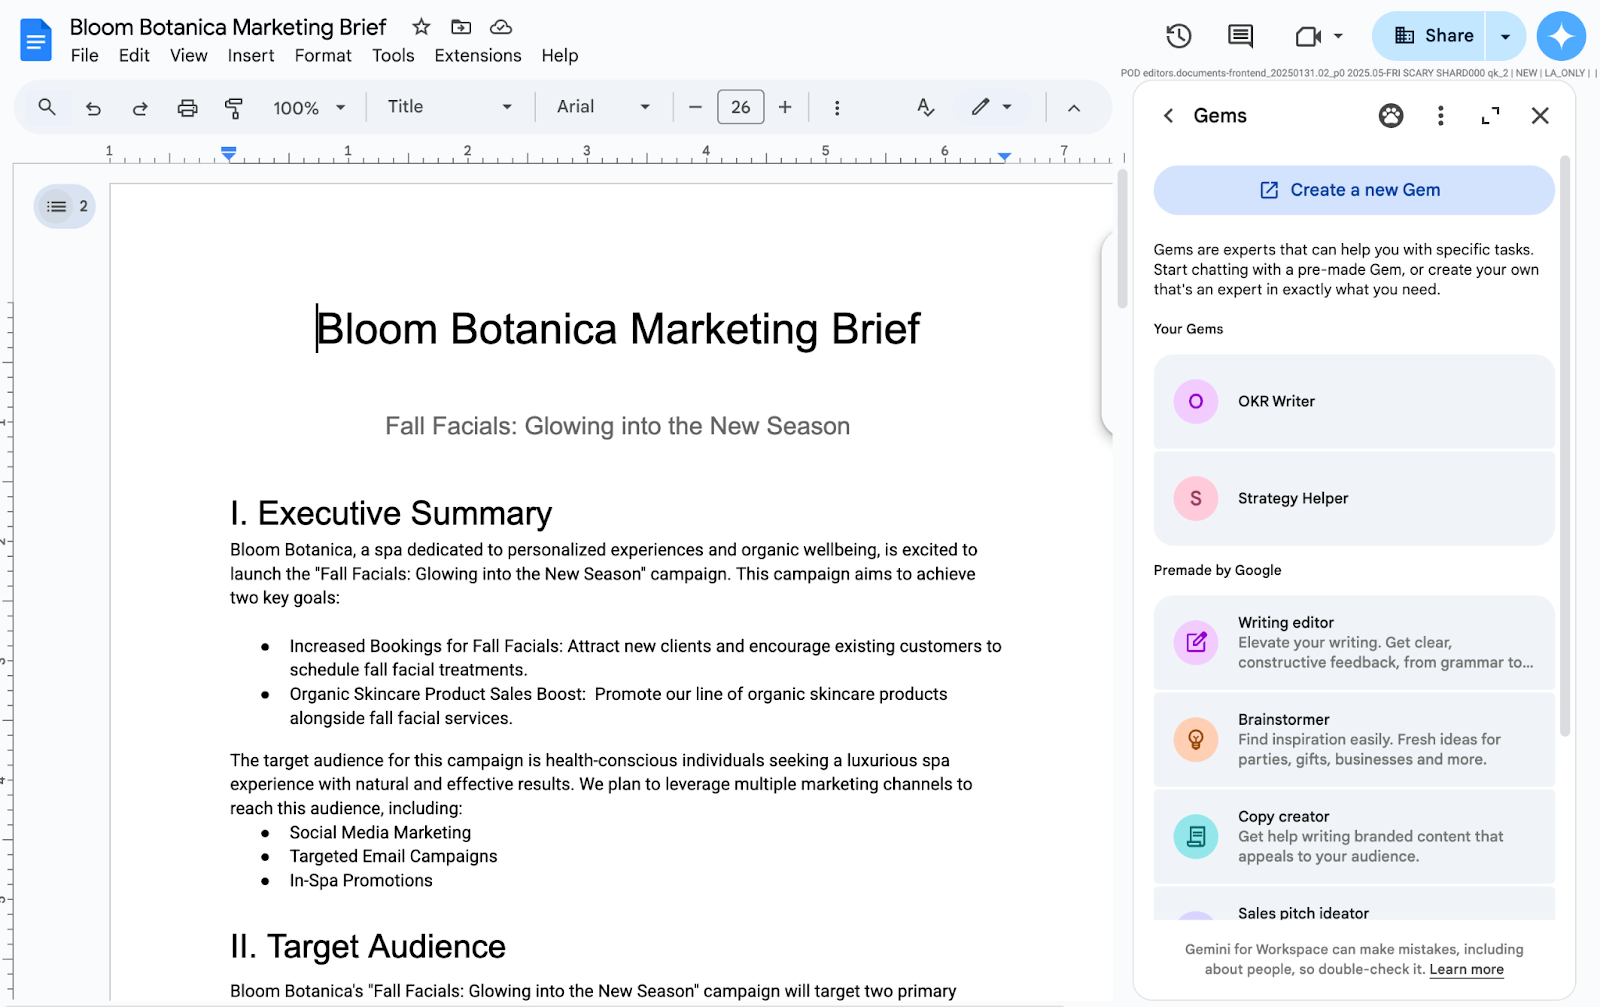
Gems are now available in the side panel of Google Workspace apps

What’s changing

Currently, when you’re using the Gemini app, you can use Gems, custom AI experts that can help you complete specific goals, tasks, and workflows based on your input. You can also take advantage of pre-made Gems as well, like writing editor, coding partner, sales pitch ideator, and more. 

Today, we’re bringing the power of Gems directly into the side panel of Google Docs, Slides, Sheets, Drive, and Gmail.

Gems in the side panel of Google Docs


Who’s impacted

Admins and end users

Why you’d use them

Gems can help you further leverage the power of Gemini in a way that’s customized to your needs more efficiently by minimizing repetitive prompting. You can now take advantage of Gems directly from the side panel of several Google Workspace apps. This includes your custom Gems or pre-made gems. Without needing to switch between applications, you can use Gems in the side panel to:

  • Leverage a copywriting Gem to create posts and content tailored to your target audience, pre-loaded into the Gem.
  • Create a Gem that helps with sales interactions that is grounded on information for a specific company, prospect, or industry. 
  • Leverage an "assistant gem" tailored to your job role to help provide more relevant summaries for you and content for internal communications.
  • Leverage a Gem designed to help pressure test content from a certain persona (e.x C-Suite or CEO) to help you create the most compelling message.

Additional details

If you don't see a Gem that meets your needs, or want to customize a Gem for a specific task, you can create your own at gemini.google.com/gems/create. Both custom and premade Gems will appear in the side panel across all supported Workspace applications, and can leverage many Workspace capabilities including @ mentioning, accessing files and folders in your corpus, and more. Visit the Help Center for more information on working with Gems.

Getting started

  • Admins: There are no admin controls for Gems or Gemini in the side panel of supported Google Workspace apps.

  • End users: Visit the Help Center to learn more about using Gems. You can access the Gemini in the side panel by clicking on “Ask Gemini” (spark button) in the top right corner of Docs, Sheets, Slides, and Drive on the web. Visit the Help Center to learn more about collaborating with Gemini in Google Drive, as well as Google Docs, Google Sheets, and Google Slides, and Gmail.

Rollout pace


Availability

  • Available for Google Workspace customers who can access Gemini in the side panel of Workspace apps and Gems in the Gemini app.
Resources


Generate data with Gemini in Google Sheets

What’s changing

Currently, you can utilize Gemini in Google Sheets to generate charts and valuable insights, and today we’re excited to bring AI directly into the cells of your spreadsheet with the power of AI function. 

From a cell, you can now input a specific prompt describing what you would like to do and an optional data range, and Gemini can do the following: 
  • Use relevant information from your spreadsheet to generate text that is tailored to your specific data. 
  • Summarize information by analyzing the content of your spreadsheet and highlighting the most important parts, so you can quickly understand your data. 
  • Categorize your data into meaningful groups, so you can easily detect patterns, such as user sentiment. ai functions in sheets

Here are some examples of how you’d use this feature: 
  • Text generation: 
    • =AI(“Write a formal ad copy for the product. Cater copy to the objective and target audience”, A2:C2
    • =AI("Create an email to the reviewer addressing specific items in their reviews.", A2:G2
  • Summarization: 
    • =AI("For the customer, write a one sentence summary of their feedback.", A2:D2
    • =AI("You are the owner of a pet sitting business. Write a 2 sentence summary for the customer about their pet’s last stay. Be a little funny.", F2
  • Categorization: 
    • =AI("Categorize the customer inquiry as a compliment, exchange request, or return request.",C2
    • =AI("Perform sentiment analysis on the emails sent by the customers to the barbershop.", C2)
If you want to refer to two ranges that aren’t contiguous, you can use concatenation in the prompt. Here are a few examples: 
  • =AI("Write a review of the hot sauce "&A2&" using only the ingredients "&D2&" and the popularity "&E2&".", A2:D2
  • =AI("Find the major themes in the customer feedback of "&B2&" using the rating "&C2&" and comments: "&D2&".") 

Who’s impacted 

End users 

Why you’d use it 

Now you can create hundreds of rows of data quickly to do things like categorize user feedback requests or write personalized emails, all without being an expert in data or spreadsheets. Regardless of your data needs, with instant access to Gemini from any cell in your Sheet, the Al function helps you get work done faster. 

Additional details 

  • We currently support text-based responses for text generation, summarization, categorization, and sentiment analysis queries. While the input information is optional, we recommend using it for optimal results. 
  • After generating, if an explicitly referenced cell or the prompt is updated, the cell shows an out-of-sync state, and keeps the previous output for reference. 
  • To refresh a cell, you can select one or multiple cells and press “refresh and insert.” 
  • You can select multiple cells with AI functions and generate outputs; however, only the first 200 selected cells with AI functions will be generated. You can wait for the generation to complete and select more cells to generate outputs. 

Getting started 

Rollout pace 

  • Rapid Release domains: Extended rollout (potentially longer than 15 days for feature visibility) starting on June 25, 2025 
  • Scheduled Release domains: Gradual rollout (up to 15 days for feature visibility) starting on July 29, 2025 

Availability 

Available for Google Workspace: 
  • Business Standard and Plus 
  • Enterprise Standard and Plus 
  • Customers with the Gemini Education or Gemini Education Premium add-on 
  • Google AI Pro and Ultra 
Anyone who previously purchased these add-ons will also receive this feature: 
  • Gemini Business* 
  • Gemini Enterprise* 
*As of January 15, 2025, we’re no longer offering the Gemini Business and Gemini Enterprise add-ons for sale. Please refer to this announcement for more details. 

Resources

Google Workspace Updates Weekly Recap – June 20, 2025

New updates

Unless otherwise indicated, the features below are available to all Google Workspace customers, and are fully launched or in the process of rolling out. Rollouts should take no more than 15 business days to complete if launching to both Rapid and Scheduled Release at the same time. If not, each stage of rollout should take no more than 15 business days to complete.

Admins can now deploy Context-Aware Access for the NotebookLM mobile app 
Earlier this year, we introduced the ability for admins to specify Context-Aware Access (CAA) policies when their users access NotebookLM. This week, we’ve expanded this to the NotebookLM app, which enables admins to set up access levels for the NotebookLM app based on a user’s identity and the context of the request (location, device security status, IP address). | Rolling out now to Rapid Release and Scheduled Release domains. | Context-Aware Access is available for Google Workspace Enterprise Standard and Plus; Education Standard and Plus; Enterprise Essentials Plus; Frontline Standard and Cloud Identity Premium customers. | Visit the Help Center to learn more about protecting your business with Context-Aware Access, about qualifying Google Workspace editions and how to turn this service on or off. 

Introducing a new video player experience in Google Drive on Android devices 
Last year, we announced a smoother, more modern video player on the Google Drive web experience. This updated look and feel is now available when watching Drive videos on your Android device. | Rollout to Rapid Release and Scheduled Release domains is complete. | Available to all Google Workspace customers, Workspace Individual Subscribers, and users with personal Google accounts. | Visit the Help Center to learn more about storing & playing video in Google Drive. 

Improving the file upload experience on Android and iOS devices 
To improve Google Drive's mobile upload experience, we've launched more fine grained controls and proactive status updates. Starting this week, you’ll notice updates to: 
  • The initial upload screen where you can adjust the file’s name and location. 
  • The progress bar that tells you how many items are uploading and how long it will take. 
  • The Upload Tab where you can see all pending or recently completed uploads. 
Rollout to Rapid Release and Scheduled Release domains is complete. | Available to all Google Workspace customers, Workspace Individual Subscribers, and users with personal Google accounts. | Visit the Help Center to learn more about uploading files & folders to Google Drive.
Improving the file upload experience on Android and iOS devices
Support for file and people smart chips now available with Google Sheets API
Last month, we introduced the ability to take basic actions to create and modify tables via the Google Sheets API. This week, we’re expanding the API functionality to include the ability to write and read file and people smart chips. | Rollout to Rapid Release and Scheduled Release domains is complete. | Available to Google Workspace customers, Google Workspace Individual subscribers, and users with personal Google accounts. | Visit the Developer Documentation to learn more about the Google Sheets API.

    Previous announcements

    The announcements below were published on the Workspace Updates blog earlier this week. Please refer to the original blog posts for complete details.
    Google Meet now offers customizable caption styling
    You can now customize the styling of captions in Google Meet, including the font size, font type, color, and background color. This allows for the captions to be customized in a way that works best for you. | Learn more about caption styles in Meet. 

    Adding new admin settings to control Google Form responses 
    Admins can now independently control two distinct settings: whether users in their domain can respond to forms created externally, and whether users in their domain can share forms with external recipients. | Learn more about admin controls for Google Forms.

    Create a Google Vid from Google Slides 
    At Google I/O, we introduced the ability to turn existing Google Slides content into engaging videos using Google Vids. Today, we’re starting to roll out the first iteration of this new experience for Vids customers. | Learn more about creating a Vid using Slides. 

    Data migration log events are available in the Admin console 
    Beginning this week, you can now access log events for the new data migration service in the audit and investigation tool and the security investigation tool. You can search across a variety of attributes including: Who started a migration, What data is being migrated and When the migration was set up or executed, and more. | Learn more about Data migration log events. 

    Generate charts and valuable insights using Gemini in Google Sheets in additional languages 
    Earlier this year, we introduced the ability for Gemini to provide insights and generate charts based on your data in Google Sheets. Today, we’re excited to expand this feature to the following languages: Spanish, Portuguese, Japanese, Korean, Italian, French and German. | Learn more about language expansion for Gemini in Sheets. 

    The Gemini app is now available to all education users
    We are expanding support for the Gemini app for Google Workspace for Education users of all ages. | Learn more about the Gemini app for education users.

    Completed rollouts

    The features below completed their rollouts to Rapid Release domains, Scheduled Release domains, or both. Please refer to the original blog posts for additional details.

    Rapid Release Domains: 
    Scheduled Release Domains: 
    Rapid and Scheduled Release Domains: 
    For a recap of announcements in the past six months, check out What’s new in Google Workspace (recent releases).


    Generate charts and valuable insights using Gemini in Google Sheets in additional languages

    What’s changing 

    Earlier this year, we introduced the ability for Gemini to provide insights and generate charts based on your data in Google Sheets. Today, we’re excited to expand this feature to the following languages: 
    • Spanish 
    • Portuguese 
    • Japanese 
    • Korean 
    • Italian 
    • French 
    • German 

    Who’s impacted 

    End users 

    Why you’d use it 

    This update reflects Gemini in Sheets’ enhanced intelligence as it now yields valuable outputs by transforming your requests into Python code, executing on them and then analyzing the results to perform multi-layered analysis. As a result, you’re able to do things like identify top-performing products and then instantly dive into their sales trends — all without writing a single line of code. 

    Additional details 


    Getting started 

    Rollout pace 

    Availability 

    Available for Google Workspace: 
    • Business Standard and Plus 
    • Enterprise Standard and Plus 
    • Customers with the Gemini Education or Gemini Education Premium add-on 
    • Google AI Pro and Ultra 
    Anyone who previously purchased these add-ons will also receive this feature: 
    • Gemini Business* 
    • Gemini Enterprise* 
    *As of January 15, 2025, we’re no longer offering the Gemini Business and Gemini Enterprise add-ons for sale. Please refer to this announcement for more details.

    Resources 

    Generate fully editable charts using Gemini in Google Sheets

    What’s changing

    Earlier this year, we introduced the ability for Gemini to provide insights and generate charts based on your data in Google Sheets. At that time, the generated charts could only be inserted as static images over cells in a spreadsheet. Starting today, Gemini can produce fully editable charts that regenerate if the spreadsheet data changes. 

    To create a chart, click Gemini in Sheets and type in a prompt, such as “create a chart with date on the x-axis and total on the y-axis.” Gemini will produce a chart in the side panel of Sheets, and once you insert it, the chart will appear on a new tab. There, you’ll be able to edit all aspects of the chart, including title, colors, and more. 
    Generate fully editable charts using Gemini in Google Sheets

    Who’s impacted 

    End users 

    Why you’d use it 

    This functionality enables users to generate editable charts using Gemini in Sheets. For example: 
    • A marketing manager analyzing campaign performance can ask "Create a bar chart showing campaign performance by market.” 
    • A small business owner managing cash flow can ask "Create a line graph with my annual projects each month this year.” 
    • A financial analyst investigating inventory trends can ask "create a pie chart showing the inventory amount breakdown from the past year.” 

    Additional details 

    • Generated charts are tied to the data in the newly created tab, not to the originally analyzed data. Any changes you want to make to the data in the chart should be made in the new tab. 
    • For the most accurate results, ensure your data is in a consistent format, with clear headers and no missing values. 
    • When asking Gemini in Sheets to analyze your data, be as specific as possible in your prompts to ensure Gemini understands your request. 
    • For complex analysis, Gemini in Sheets’ performance is most consistent in files below 1 million cells. 
    • For certain chart types, Gemini in Sheets may still produce charts as images. Image charts are not directly editable or linked to your Sheet data, so they won't update automatically if your data changes. 

    Getting started 

    Rollout pace 

    Availability 

    Available for Google Workspace: 
    • Business Standard and Plus 
    • Enterprise Standard and Plus 
    • Customers with the Gemini Education or Gemini Education Premium add-on 
    • Google AI Pro and Ultra 
    Anyone who previously purchased these add-ons will also receive this feature: 
    • Gemini Business* 
    • Gemini Enterprise* 
    *As of January 15, 2025, we’re no longer offering the Gemini Business and Gemini Enterprise add-ons for sale. Please refer to this announcement for more details.

    Resources