 You can now generate videos in Gemini, powered by Veo 2.
Generate videos in Gemini and Whisk with Veo 2
 You can now generate videos in Gemini, powered by Veo 2.
 You can now generate videos in Gemini, powered by Veo 2.
 When you’re searching on Google, we aim to provide the most useful information, and many times that includes providing locally relevant search results. Historically, as …
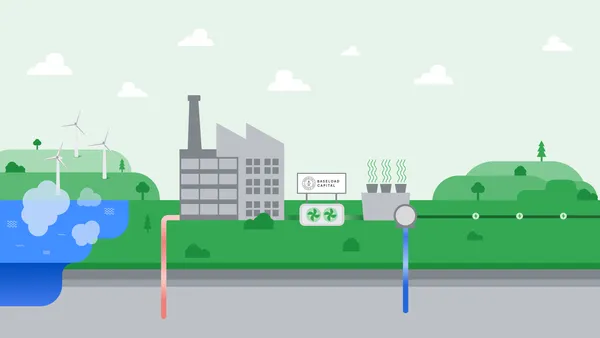
 Today, we’re announcing another milestone in our Asia Pacific clean energy journey by signing the first corporate PPAs for geothermal energy in Taiwan.

At Google Play, we partner with developers like you to help your app or game business reach its full potential, providing powerful tools and insights every step of the way. In Google Play Console, you’ll find the features needed to test, publish, improve, and grow your apps — and today, we're excited to share several enhancements to give you even more actionable insights, starting with a redesigned app dashboard tailored to your key workflows, and new metrics designed to help you improve your app quality.
The first thing you’ll notice is the redesigned app dashboard, which puts the most essential insights front and center. We know that when you visit Play Console, you usually have a goal in mind — whether that’s checking on your release status or tracking installs. That’s why you’ll now see your most important metrics grouped into four core developer objectives:
Each objective highlights the three metrics most important to that goal, giving you a quick grasp of how your app is doing at a glance, as well as how those metrics have changed over time. For example, you can now easily compare between your latest production release against your app’s overall performance, helping you to quickly identify any issues. In the screenshot below, the latest production release has a crash rate of 0.24%, a large improvement over the 28-day average crash rate shown under “Monitor and Improve."

At the top of the page, you’ll see the status of your latest release changes prominently displayed so you know when it’s been reviewed and approved. If you’re using managed publishing, you can also see when things are ready to publish. And based on your feedback, engagement and monetization metrics now show a comparison to your previous year’s data so you can make quick comparisons.
The new app dashboard also keeps you updated on the latest news from Play, including recent blog posts, new features relevant to your app, and even special invitations to early access programs.
In addition to what’s automatically displayed on the dashboard, we know many of you track other vital metrics for your role or business. That's why we've added the “Monitor KPI trends” section at the bottom of your app dashboard. Simply scroll down and personalize your view by selecting the trends you need to monitor. This customized experience allows each user in your developer account to focus on their most important insights.
Later this year, we’ll introduce new overview pages for each of the four core developer objectives. These pages will help you quickly understand your performance, showcase tools and features within each domain, and list recommended actions to optimize performance, engagement, and revenue across all your apps.
If you spend a lot of time in Play Console, you may have already noticed the new notification center. Accessible from every page, the notification center helps you to stay up to date with your account and apps, and helps you to identify any issues that may need urgent attention.
To help you quickly understand and act on important information, we now group notifications about the same issue across multiple apps. Additionally, notifications that are no longer relevant will automatically expire, ensuring you only see what needs your attention. Plus, notifications will be displayed on the new app dashboard within the relevant objectives.
One of Play’s top goals is to provide the insights you need to build high-quality apps that deliver exceptional user experiences. We’re continuing to expand these insights, helping you prevent issues like crashes or ANRs, optimize your app’s performance, and reduce resource consumption on users’ devices.
Users expect a polished experience across their devices, and we’ve learned from you it can be difficult to make your app layouts work seamlessly across phones and large screens. To help with this, we’ve introduced pre-review checks for incorrect edge-to-edge rendering, while another new check helps you detect and prevent large screen layout issues caused by letterboxing and restricted layouts, along with resources on how to fix them.
We’re also making it easier to find and triage the most important quality issues in your app. The release dashboard in Play Console now displays prioritized quality issues from your latest release, alongside the existing dashboard features for monitoring post-launch, like crashes and ANRs This addition provides a centralized view of user-impacting issues, along with clear instructions to help you resolve critical user issues to improve your users’ experiences.

A new "low memory kill" (LMK) metric is available in Android vitals and the Reporting API. Low memory issues cause your app to terminate without any logging, and can be notoriously difficult to detect. We are making these issues visible with device-specific insights into memory constraints to help you identify and fix these problems. This will improve app stability and user engagement, which is especially crucial for games where LMKs can disrupt real-time gameplay.

We're also collaborating closely with leading OEMs like Samsung, leveraging their real-world insights to define consistent benchmarks for optimal technical quality across Android devices. Excessive wakelocks are a leading cause of battery drain, a top frustration for users. Today, we're launching the first of these new metrics in beta: excessive wake locks in Android vitals. Take a look at our wakelock documentation and provide feedback on the metric definition. Your input is essential as we refine this metric towards general availability, and will inform our strategy for making this information available to users on the Play Store so they can make informed decisions when choosing apps.
Together, these updates provide you with even more visibility into your app's performance and quality, enabling you to build more stable, efficient, and user-friendly apps across the Android ecosystem. We'll continue to add more metrics and insights over time. To stay informed about all the latest Play Console enhancements and easily find updates relevant to your workflow, explore our new What’s new in Play Console page, where you can filter features by the four developer objectives.

Android has long championed performance, continuously evolving to deliver exceptional user experiences. Building upon years of refinement, we're now focusing on pinpointing resource-intensive use cases and developing platform-level solutions that benefit all users, across the vast Android ecosystem.
Since the launch of Android vitals in Play Console in 2017, Play has been investing in providing fleet-wide visibility into performance issues, making it easier to identify and fix problems as they occur. Today, Android and Google Play are taking a significant step forward in partnership with top OEMs, like Samsung, leveraging their real-world insights into excessive resource consumption. Our shared goal is to make Android development more streamlined and consistent by providing a standardized definition of what good and great looks like when it comes to technical quality.
"Samsung is excited to collaborate with Android and Google Play on these new performance metrics. By sharing our user experience insights, we aim to help developers build truly optimized apps that deliver exceptional performance and battery life across the ecosystem. We believe this collaboration will lead to a more consistent and positive experience for all Android users."– Samsung
We're embarking on a multi-year plan to empower you with the tools and data you need to understand, diagnose, and improve your app's resource consumption, resulting in happier and more engaged users, both for your app, and Android as a whole.
Today, we're launching the first of these new metrics in beta: excessive wake locks. This metric directly addresses one of the most significant frustrations for Android users – excessive battery drain. By optimizing your app's wake lock behavior, you can significantly enhance battery life and user satisfaction.
The Android vitals beta metric reports partial wake lock use as excessive when all of the partial wake locks, added together, run for more than 3 hours in a 24-hour period. The current iteration of excessive wake lock metrics tracks time only if the wake lock is held when the app is in the background and does not have a foreground service.
These new metrics will provide comprehensive, fleet-wide visibility into performance and battery life, equipping developers with the data needed to diagnose and resolve performance bottlenecks. We have also revamped our wake lock documentation which shares effective wake lock implementation strategies and best practices.
In addition, we are also launching the excessive wake lock metric documentation to provide clear guidance on interpreting the metrics. We highly encourage developers to check out this page and provide feedback with their use case on this new metric. Your input is invaluable in refining these metrics before their general availability. In this beta phase, we're actively seeking feedback on the metric definition and how it aligns with your app's use cases. Once we reach general availability, we will explore Play Store treatments to help users choose apps that meet their needs.
Later this year, we may introduce additional metrics in Android vitals highlighting additional critical performance issues.
Thank you for your ongoing commitment to delivering delightful, fast, and high-performance experiences to users across the entire Android ecosystem.
 Learn more about Google’s World Quantum Day doodle, which illustrates the concept of superposition in quantum computing.
 Dolphin researchers are using Gemma and Google Pixel phones to try to decipher how dolphins talk to one another.