Tag Archives: Semi-supervised Learning

Unsupervised and semi-supervised anomaly detection with data-centric ML

Anomaly detection (AD), the task of distinguishing anomalies from normal data, plays a vital role in many real-world applications, such as detecting faulty products from vision sensors in manufacturing, fraudulent behaviors in financial transactions, or network security threats. Depending on the availability of the type of data — negative (normal) vs. positive (anomalous) and the availability of their labels — the task of AD involves different challenges.

(a) Fully supervised anomaly detection, (b) normal-only anomaly detection, (c, d, e) semi-supervised anomaly detection, (f) unsupervised anomaly detection.

While most previous works were shown to be effective for cases with fully-labeled data (either (a) or (b) in the above figure), such settings are less common in practice because labels are particularly tedious to obtain. In most scenarios users have a limited labeling budget, and sometimes there aren’t even any labeled samples during training. Furthermore, even when labeled data are available, there could be biases in the way samples are labeled, causing distribution differences. Such real-world data challenges limit the achievable accuracy of prior methods in detecting anomalies.

This post covers two of our recent papers on AD, published in Transactions on Machine Learning Research (TMLR), that address the above challenges in unsupervised and semi-supervised settings. Using data-centric approaches, we show state-of-the-art results in both. In “Self-supervised, Refine, Repeat: Improving Unsupervised Anomaly Detection”, we propose a novel unsupervised AD framework that relies on the principles of self-supervised learning without labels and iterative data refinement based on the agreement of one-class classifier (OCC) outputs. In “SPADE: Semi-supervised Anomaly Detection under Distribution Mismatch”, we propose a novel semi-supervised AD framework that yields robust performance even under distribution mismatch with limited labeled samples.


Unsupervised anomaly detection with SRR: Self-supervised, Refine, Repeat

Discovering a decision boundary for a one-class (normal) distribution (i.e., OCC training) is challenging in fully unsupervised settings as unlabeled training data include two classes (normal and abnormal). The challenge gets further exacerbated as the anomaly ratio gets higher for unlabeled data. To construct a robust OCC with unlabeled data, excluding likely-positive (anomalous) samples from the unlabeled data, the process referred to as data refinement, is critical. The refined data, with a lower anomaly ratio, are shown to yield superior anomaly detection models.

SRR first refines data from an unlabeled dataset, then iteratively trains deep representations using refined data while improving the refinement of unlabeled data by excluding likely-positive samples. For data refinement, an ensemble of OCCs is employed, each of which is trained on a disjoint subset of unlabeled training data. If there is consensus among all the OCCs in the ensemble, the data that are predicted to be negative (normal) are included in the refined data. Finally, the refined training data are used to train the final OCC to generate the anomaly predictions.

Training SRR with a data refinement module (OCCs ensemble), representation learner, and final OCC. (Green/red dots represent normal/abnormal samples, respectively).

SRR results

We conduct extensive experiments across various datasets from different domains, including semantic AD (CIFAR-10, Dog-vs-Cat), real-world manufacturing visual AD (MVTec), and real-world tabular AD benchmarks such as detecting medical (Thyroid) or network security (KDD 1999) anomalies. We consider methods with both shallow (e.g., OC-SVM) and deep (e.g., GOAD, CutPaste) models. Since the anomaly ratio of real-world data can vary, we evaluate models at different anomaly ratios of unlabeled training data and show that SRR significantly boosts AD performance. For example, SRR improves more than 15.0 average precision (AP) with a 10% anomaly ratio compared to a state-of-the-art one-class deep model on CIFAR-10. Similarly, on MVTec, SRR retains solid performance, dropping less than 1.0 AUC with a 10% anomaly ratio, while the best existing OCC drops more than 6.0 AUC. Lastly, on Thyroid (tabular data), SRR outperforms a state-of-the-art one-class classifier by 22.9 F1 score with a 2.5% anomaly ratio.

Across various domains, SRR (blue line) significantly boosts AD performance with various anomaly ratios in fully unsupervised settings.

SPADE: Semi-supervised Pseudo-labeler Anomaly Detection with Ensembling

Most semi-supervised learning methods (e.g., FixMatch, VIME) assume that the labeled and unlabeled data come from the same distributions. However, in practice, distribution mismatch commonly occurs, with labeled and unlabeled data coming from different distributions. One such case is positive and unlabeled (PU) or negative and unlabeled (NU) settings, where the distributions between labeled (either positive or negative) and unlabeled (both positive and negative) samples are different. Another cause of distribution shift is additional unlabeled data being gathered after labeling. For example, manufacturing processes may keep evolving, causing the corresponding defects to change and the defect types at labeling to differ from the defect types in unlabeled data. In addition, for applications like financial fraud detection and anti-money laundering, new anomalies can appear after the data labeling process, as criminal behavior may adapt. Lastly, labelers are more confident on easy samples when they label them; thus, easy/difficult samples are more likely to be included in the labeled/unlabeled data. For example, with some crowd-sourcing–based labeling, only the samples with some consensus on the labels (as a measure of confidence) are included in the labeled set.

Three common real-world scenarios with distribution mismatches (blue box: normal samples, red box: known/easy anomaly samples, yellow box: new/difficult anomaly samples).

Standard semi-supervised learning methods assume that labeled and unlabeled data come from the same distribution, so are sub-optimal for semi-supervised AD under distribution mismatch. SPADE utilizes an ensemble of OCCs to estimate the pseudo-labels of the unlabeled data — it does this independent of the given positive labeled data, thus reducing the dependency on the labels. This is especially beneficial when there is a distribution mismatch. In addition, SPADE employs partial matching to automatically select the critical hyper-parameters for pseudo-labeling without relying on labeled validation data, a crucial capability given limited labeled data.

Block diagram of SPADE with zoom in the detailed block diagram of the proposed pseudo-labelers.

SPADE results

We conduct extensive experiments to showcase the benefits of SPADE in various real-world settings of semi-supervised learning with distribution mismatch. We consider multiple AD datasets for image (including MVTec) and tabular (including Covertype, Thyroid) data.

SPADE shows state-of-the-art semi-supervised anomaly detection performance across a wide range of scenarios: (i) new-types of anomalies, (ii) easy-to-label samples, and (iii) positive-unlabeled examples. As shown below, with new-types of anomalies, SPADE outperforms the state-of-the-art alternatives by 5% AUC on average.

AD performances with three different scenarios across various datasets (Covertype, MVTec, Thyroid) in terms of AUC. Some baselines are only applicable to some scenarios. More results with other baselines and datasets can be found in the paper.

We also evaluate SPADE on real-world financial fraud detection datasets: Kaggle credit card fraud and Xente fraud detection. For these, anomalies evolve (i.e., their distributions change over time) and to identify evolving anomalies, we need to keep labeling for new anomalies and retrain the AD model. However, labeling would be costly and time consuming. Even without additional labeling, SPADE can improve the AD performance using both labeled data and newly-gathered unlabeled data.

AD performances with time-varying distributions using two real-world fraud detection datasets with 10% labeling ratio. More baselines can be found in the paper.

As shown above, SPADE consistently outperforms alternatives on both datasets, taking advantage of the unlabeled data and showing robustness to evolving distributions.


Conclusions

AD has a wide range of use cases with significant importance in real-world applications, from detecting security threats in financial systems to identifying faulty behaviors of manufacturing machines.

One challenging and costly aspect of building an AD system is that anomalies are rare and not easily detectable by people. To this end, we have proposed SRR, a canonical AD framework to enable high performance AD without the need for manual labels for training. SRR can be flexibly integrated with any OCC, and applied on raw data or on trainable representations.

Semi-supervised AD is another highly-important challenge — in many scenarios, the distributions of labeled and unlabeled samples don’t match. SPADE introduces a robust pseudo-labeling mechanism using an ensemble of OCCs and a judicious way of combining supervised and self-supervised learning. In addition, SPADE introduces an efficient approach to pick critical hyperparameters without a validation set, a crucial component for data-efficient AD.

Overall, we demonstrate that SRR and SPADE consistently outperform the alternatives in various scenarios across multiple types of datasets.


Acknowledgements

We gratefully acknowledge the contributions of Kihyuk Sohn, Chun-Liang Li, Chen-Yu Lee, Kyle Ziegler, Nate Yoder, and Tomas Pfister.

Source: Google AI Blog


Identifying Disfluencies in Natural Speech

People don’t write in the same way that they speak. Written language is controlled and deliberate, whereas transcripts of spontaneous speech (like interviews) are hard to read because speech is disorganized and less fluent. One aspect that makes speech transcripts particularly difficult to read is disfluency, which includes self-corrections, repetitions, and filled pauses (e.g., words like “umm”, and “you know”). Following is an example of a spoken sentence with disfluencies from the LDC CALLHOME corpus:

But that's it's not, it's not, it's, uh, it's a word play on what you just said.

It takes some time to understand this sentence — the listener must filter out the extraneous words and resolve all of the nots. Removing the disfluencies makes the sentence much easier to read and understand:

But it’s a word play on what you just said.

While people generally don't even notice disfluencies in day-to-day conversation, early foundational work in computational linguistics demonstrated how common they are. In 1994, using the Switchboard corpus, Elizabeh Shriberg demonstrated that there is a 50% probability for a sentence of 10–13 words to include a disfluency and that the probability increases with sentence length.

The proportion of sentences from the Switchboard dataset with at least one disfluency plotted against sentence length measured in non-disfluent (i.e., efficient) tokens in the sentence. The longer a sentence gets, the more likely it is to contain a disfluency.

In “Teaching BERT to Wait: Balancing Accuracy and Latency for Streaming Disfluency Detection”, we present research findings on how to “clean up” transcripts of spoken text. We create more readable transcripts and captions of human speech by finding and removing disfluencies in people’s speech. Using labeled data, we created machine learning (ML) algorithms that identify disfluencies in human speech. Once those are identified we can remove the extra words to make transcripts more readable. This also improves the performance of natural language processing (NLP) algorithms that work on transcripts of human speech. Our work puts special priority on ensuring that these models are able to run on mobile devices so that we can protect user privacy and preserve performance in scenarios with low connectivity.

Base Model Overview
At the core of our base model is a pre-trained BERTBASE encoder with 108.9 million parameters. We use the standard per-token classifier configuration, with a binary classification head being fed by the sequence encodings for each token.

Illustration of how tokens in text become numerical embeddings, which then lead to output labels.

We refined the BERT encoder by continuing the pretraining on the comments from the Pushrift Reddit dataset from 2019. Reddit comments are not speech data, but are more informal and conversational than the wiki and book data. This trains the encoder to better understand informal language, but may run the risk of internalizing some of the biases inherent in the data. For our particular use case, however, the model only captures the syntax or overall form of the text, not its content, which avoids potential issues related to semantic-level biases in the data.

We fine-tune our model for disfluency classification on hand-labeled corpora, such as the Switchboard corpus mentioned above. Hyperparameters (batch size, learning rate, number of training epochs, etc.) were optimized using Vizier.

We also produce a range of “small” models for use on mobile devices using a knowledge distillation technique known as “self training”. Our best small model is based on the Small-vocab BERT variant with 3.1 million parameters. This smaller model achieves comparable results to our baseline at 1% the size (in MiB). You can read more about how we achieved this model miniaturization in our 2021 Interspeech paper.

Streaming
Some of the latest use cases for automatic speech transcription include automated live captioning, such as produced by the Android “Live Captions” feature, which automatically transcribes spoken language in audio being played on the device. For disfluency removal to be of use in improving the readability of the captions in this setting, then it must happen quickly and in a stable manner. That is, the model should not change its past predictions as it sees new words in the transcript.

We call this live token-by-token processing streaming. Accurate streaming is difficult because of temporal dependencies; most disfluencies are only recognizable later. For example, a repetition does not actually become a repetition until the second time the word or phrase is said.

To investigate whether our disfluency detection model is effective in streaming applications, we split the utterances in our training set into prefix segments, where only the first N tokens of the utterance were provided at training time, for all values of N up to the full length of the utterance. We evaluated the model simulating a stream of spoken text by feeding prefixes to the models and measuring the performance with several metrics that capture model accuracy, stability, and latency including streaming F1, time to detection (TTD), edit overhead (EO), and average wait time (AWT). We experimented with look-ahead windows of either one or two tokens, allowing the model to “peek” ahead at additional tokens for which the model is not required to produce a prediction. In essence, we’re asking the model to “wait” for one or two more tokens of evidence before making a decision.

While adding this fixed look-ahead did improve the stability and streaming F1 scores in many contexts, we found that in some cases the label was already clear even without looking ahead to the next token and the model did not necessarily benefit from waiting. Other times, waiting for just one extra token was sufficient. We hypothesized that the model itself could learn when it should wait for more context. Our solution was a modified model architecture that includes a “wait” classification head that decides when the model has seen enough evidence to trust the disfluency classification head.

Diagram showing how the model labels input tokens as they arrive. The BERT embedding layers feed into two separate classification heads, which are combined for the output.

We constructed a training loss function that is a weighted sum of three factors:

  1. The traditional cross-entropy loss for the disfluency classification head
  2. A cross-entropy term that only considers up to the first token with a “wait” classification
  3. A latency penalty that discourages the model from waiting too long to make a prediction

We evaluated this streaming model as well as the standard baseline with no look-ahead and with both 1- and 2-token look-ahead values:

Graph of the streaming F1 score versus the average wait time in tokens. Three data points indicate F1 scores above 0.82 across multiple wait times. The proposed streaming model achieves near top performance with much shorter wait times than the fixed look ahead models.

The streaming model achieved a better streaming F1 score than both a standard baseline with no look ahead and a model with a look ahead of 1. It performed nearly as well as the variant with fixed look ahead of 2, but with much less waiting. On average the model waited for only 0.21 tokens of context.

Internationalization
Our best outcomes so far have been with English transcripts. This is mostly due to resourcing issues: while there are a number of relatively large labeled conversational datasets that include disfluencies in English, other languages often have very few such datasets available. So, in order to make disfluency detection models available outside English a method is needed to build models in a way that does not require finding and labeling hundreds of thousands of utterances in each target language. A promising solution is to leverage multi-language versions of BERT to transfer what a model has learned about English disfluencies to other languages in order to achieve similar performance with much less data. This is an area of active research, but we do have some promising results to outline here.

As a first effort to validate this approach, we added labels to about 10,000 lines of dialogue from the German CALLHOME dataset. We then started with the Geotrend English and German Bilingual BERT model (extracted from Multilingual BERT) and fine-tuned it with approximately 77,000 disfluency-labeled English Switchboard examples and 1.3 million examples of self-labeled transcripts from the Fisher Corpus. Then, we did further fine tuning with about 7,500 in-house–labeled examples from the German CALLHOME dataset.

Diagram illustrating the flow of labeled data and self-trained output in our best multilingual training setup. By training on both English and German data we are able to improve performance via transfer learning.

Our results indicate that fine-tuning on a large English corpus can produce acceptable precision using zero-shot transfer to similar languages like German, but at least a modest amount of German labels were needed to improve recall from less than 60% to greater than 80%. Two-stage fine-tuning of an English-German bilingual model produced the highest precision and overall F1 score.

Approach Precision Recall F1
German BERTBASE model fine-tuned on 7,300 human-labeled German CALLHOME examples 89.1% 81.3% 85.0
Same as above but with additional 7,500 self-labeled German CALLHOME examples 91.5% 83.3% 87.2
English/German Bilingual BERTbase model fine-tuned on English Switchboard+Fisher, evaluated on German CALLHOME (zero-shot language transfer) 87.2% 59.1% 70.4
Same as above but subsequently fine-tuned with 14,800 German CALLHOME (human- and self-labeled) examples 95.5% 82.6% 88.6

Conclusion
Cleaning up disfluencies from transcripts can improve not just their readability for people, but also the performance of other models that consume transcripts. We demonstrate effective methods for identifying disfluencies and expand our disfluency model to resource-constrained environments, new languages, and more interactive use cases.

Acknowledgements
Thank you to Vicky Zayats, Johann Rocholl, Angelica Chen, Noah Murad, Dirk Padfield, and Preeti Mohan for writing the code, running the experiments, and composing the papers discussed here. Wealso thank our technical product manager Aaron Schneider, Bobby Tran from the Cerebra Data Ops team, and Chetan Gupta from Speech Data Ops for their support obtaining additional data labels.

Source: Google AI Blog


Advancing Self-Supervised and Semi-Supervised Learning with SimCLR


Recently, natural language processing models, such as BERT and T5, have shown that it is possible to achieve good results with few class labels by first pretraining on a large unlabeled dataset and then fine-tuning on a smaller labeled dataset. Similarly, pretraining on large unlabeled image datasets has the potential to improve performance on computer vision tasks, as demonstrated by Exemplar-CNN, Instance Discrimination, CPC, AMDIM, CMC, MoCo and others. These methods fall under the umbrella of self-supervised learning, which is a family of techniques for converting an unsupervised learning problem into a supervised one by creating surrogate labels from the unlabeled dataset. However, current self-supervised techniques for image data are complex, requiring significant modifications to the architecture or the training procedure, and have not seen widespread adoption.

In “A Simple Framework for Contrastive Learning of Visual Representations”, we outline a method that not only simplifies but also improves previous approaches to self-supervised representation learning on images. Our proposed framework, called SimCLR, significantly advances the state of the art on self- supervised and semi-supervised learning and achieves a new record for image classification with a limited amount of class-labeled data (85.8% top-5 accuracy using 1% of labeled images on the ImageNet dataset). The simplicity of our approach means that it can be easily incorporated into existing supervised learning pipelines. In what follows, we first introduce the SimCLR framework, then discuss three things we discovered while developing SimCLR.

The SimCLR framework
SimCLR first learns generic representations of images on an unlabeled dataset, and then it can be fine-tuned with a small amount of labeled images to achieve good performance for a given classification task. The generic representations are learned by simultaneously maximizing agreement between differently transformed views of the same image and minimizing agreement between transformed views of different images, following a method called contrastive learning. Updating the parameters of a neural network using this contrastive objective causes representations of corresponding views to “attract” each other, while representations of non-corresponding views “repel” each other.

To begin, SimCLR randomly draws examples from the original dataset, transforming each example twice using a combination of simple augmentations (random cropping, random color distortion, and Gaussian blur), creating two sets of corresponding views. The rationale behind these simple transformations of individual images is (1) we want to encourage "consistent" representation of the same image under transformations, (2) since the pretraining data lacks labels, we can’t know a priori which image contains which object class, and 3) we found that these simple transformations are suffice for the neural net to learn good representations, though more sophisticated transformation policy can also be incorporated.

SimCLR then computes the image representation using a convolutional neural network variant based on the ResNet architecture. Afterwards, SimCLR computes a non-linear projection of the image representation using a fully-connected network (i.e., MLP), which amplifies the invariant features and maximizes the ability of the network to identify different transformations of the same image. We use stochastic gradient descent to update both CNN and MLP in order to minimize the loss function of the contrastive objective. After pre-training on the unlabeled images, we can either directly use the output of the CNN as the representation of an image, or we can fine-tune it with labeled images to achieve good performance for downstream tasks.
An illustration of the proposed SimCLR framework. The CNN and MLP layers are trained simultaneously to yield projections that are similar for augmented versions of the same image, while being dissimilar for different images, even if those images are of the same class of object. The trained model not only does well at identifying different transformations of the same image, but also learns representations of similar concepts (e.g., chairs vs. dogs), which later can be associated with labels through fine-tuning.
Performance
Despite its simplicity, SimCLR greatly advances the state of the art in self-supervised and semi-supervised learning on ImageNet. A linear classifier trained on top of self-supervised representations learned by SimCLR achieves 76.5% / 93.2% top-1 / top-5 accuracy, compared to 71.5% / 90.1% from the previous best (CPC v2), matching the performance of supervised learning in a smaller model, ResNet-50, as demonstrated in the following figure.
ImageNet top-1 accuracy of linear classifiers trained on representations learned with different self-supervised methods (pretrained on ImageNet). Gray cross indicates supervised ResNet-50.
When fine-tuned on only 1% of the labels, SimCLR achieves 63.0% / 85.8% top-1 / top-5 accuracy, compared to 52.7% / 77.9% from previous best (CPC v2). Perhaps surprisingly, when fine-tuned on 100% of labels, the pretrained SimCLR models can still significantly outperform supervised baselines trained from scratch, e.g., fine-tuning SimCLR pretrained ResNet-50 (4x) achieves 80.1% top-1 accuracy in 30 epochs, while training it from scratch gets 78.4% in 90 epochs.

Understanding Contrastive Learning of Representations
The improvement SimCLR provides over previous methods is not due to any single design choice, but to their combination. Several important findings are summarized below.
  • Finding 1: The combinations of image transformations used to generate corresponding views are critical.

    As SimCLR learns representations via maximizing agreement of different views of the same image, it is important to compose image transformations to prevent trivial forms of agreement, such as agreement of the color histograms. To understand this better, we explored different types of transformations, illustrated in the figure below.
    Random examples of transformations applied to the original image.
    We found that while no single transformation (that we studied) suffices to define a prediction task that yields the best representations, two transformations stand out: random cropping and random color distortion. Although neither cropping nor color distortion leads to high performance on its own, composing these two transformations leads to state-of-the-art results.

    To understand why combining random cropping with random color distortion is important, consider the process of maximizing agreement between two crops of the same image. This naturally encompasses two types of prediction tasks that enable effective representation learning: (a) predicting local views (e.g., crop A in the image below) from a larger, “global” view (crop B), and (b) predicting neighboring views (e.g., between crop C and crop D).
    Maximizing agreement between different crops leads to two prediction tasks. Left: Global vs local views. Right: Adjacent views.
    However, different crops of the same image usually look very similar in color space. If the colors are left intact, a model can maximize agreement between crops simply by matching the color histograms. In this case, the model might focus solely on color and ignore other more generalizable features. By independently distorting the colors of each crop, these shallow clues can be removed, and the model can only achieve agreement by learning useful and generalizable representations.

  • Finding 2: The nonlinear projection is important.

    In SimCLR, a MLP-based nonlinear projection is applied before the loss function for contrastive learning objective is calculated, which helps to identify the invariant features of each input image and maximize the ability of the network to identify different transformations of the same image. In our experiments, we found that using such a nonlinear projection helps improve the representation quality, improving the performance of a linear classifier trained on the SimCLR-learned representation by more than 10%.

    Interestingly, comparison between the representations used as input for the MLP projection module and the output from the projection reveals that the earlier stage representations perform better when measured by a linear classifier. Since the loss function for contrastive objective is based on the output of the projection, it is somewhat surprising that the representation before the projection is better. We conjecture that our objective leads the final layer of the network to become invariant to features such as color that may be useful for downstream tasks. With the extra nonlinear projection head, the representation layer before the projection head is able to retain more useful information about the image.

  • Finding 3: Scaling up significantly improves performance.

    We found that (1) processing more examples in the same batch, (2) using bigger networks, and (3) training for longer all lead to significant improvements. While these may seem like somewhat obvious observations, these improvements seem larger for SimCLR than for supervised learning. For example, we observe that the performance of a supervised ResNet peaked between 90 and 300 training epochs (on ImageNet), but SimCLR can continue its improvement even after 800 epochs of training. It also seems to be the case when we increase the depth or width of the network — the gain for SimCLR continues, while it starts to saturate for supervised learning. In order to optimize the returns of scaling up our training, we made extensive use of Cloud TPU in our experiments.
Code and Pretrained-Models
To accelerate research in self-supervised and semi-supervised learning, we are excited to share the code and pretrained models of SimCLR with the larger academic community. They can be found on our GitHub repository.

Acknowledgements
This is a joint work with Simon Kornblith and Mohammad Norouzi. We would like to thank Tom Small for the visualization of the SimCLR framework. We are also grateful for general support from Google Research teams in Toronto and elsewhere.

Source: Google AI Blog


Advancing Semi-supervised Learning with Unsupervised Data Augmentation


Success in deep learning has largely been enabled by key factors such as algorithmic advancements, parallel processing hardware (GPU / TPU), and the availability of large-scale labeled datasets, like ImageNet. However, when labeled data is scarce, it can be difficult to train neural networks to perform well. In this case, one can apply data augmentation methods, e.g., paraphrasing a sentence or rotating an image, to effectively increase the amount of labeled training data. Recently, there has been significant progress in the design of data augmentation approaches for a variety of areas such as natural language processing (NLP), vision, and speech. Unfortunately, data augmentation is often limited to supervised learning only, in which labels are required to transfer from original examples to augmented ones.
Example augmentation operations for text-based (top) or image-based (bottom) training data.
In our recent work, “Unsupervised Data Augmentation (UDA) for Consistency Training”, we demonstrate that one can also perform data augmentation on unlabeled data to significantly improve semi-supervised learning (SSL). Our results support the recent revival of semi-supervised learning, showing that: (1) SSL can match and even outperform purely supervised learning that uses orders of magnitude more labeled data, (2) SSL works well across domains in both text and vision and (3) SSL combines well with transfer learning, e.g., when fine-tuning from BERT. We have also open-sourced our code (github) for the community to replicate and build upon.

Unsupervised Data Augmentation Explained
Unsupervised Data Augmentation (UDA) makes use of both labeled data and unlabeled data. To use labeled data, it computes the loss function using standard methods for supervised learning to train the model, as shown in the left part of the graph below. For unlabeled data, consistency training is applied to enforce the predictions to be similar for an unlabeled example and the augmented unlabeled example, as shown in the right part of the graph. Here, the same model is applied to both the unlabeled example and its augmented counterpart to produce two model predictions, from which a consistency loss is computed (i.e., the distance between the two prediction distributions). UDA then computes the final loss by jointly optimizing both the supervised loss from the labeled data and the unsupervised consistency loss from the unlabeled data.

An overview of Unsupervised Data Augmentation (UDA). Left: Standard supervised loss is computed when labeled data is available. Right: With unlabeled data, a consistency loss is computed between an example and its augmented version.
By minimizing the consistency loss, UDA allows for label information to propagate smoothly from labeled examples to unlabeled ones. Intuitively, one can think of UDA as an implicit iterative process. First, the model relies on a small amount of labeled examples to make correct predictions for some unlabeled examples, from which the label information is propagated to augmented counterparts through the consistency loss. Over time, more and more unlabeled examples will be predicted correctly which reflects the improved generalization of the model. Various other types of noise have been tested for consistency training (e.g., Gaussian noise, adversarial noise, and others), yet we found that data augmentation outperforms all of them, leading to state-of-the-art performance on a wide variety of tasks from language to vision. UDA applies different existing augmentation methods depending on the task at hand, including back translation, AutoAugment, and TF-IDF word replacement.

Benchmarks in NLP and Computer Vision
UDA is surprisingly effective in the low-data regime. With only 20 labeled examples, UDA achieves an error rate of 4.20 on the IMDb sentiment analysis task by leveraging 50,000 unlabeled examples. This result outperforms the previous state-of-the-art model trained on 25,000 labeled examples with an error rate of 4.32. In the large-data regime, with the full training set, UDA also provides robust gains.
Benchmark on IMDb, a sentiment analysis task. UDA surpasses state-of-the-art results in supervised learning across different training sizes.
On the CIFAR-10 semi-supervised learning benchmark, UDA outperforms all existing SSL methods, such as VAT, ICT, and MixMatch by significant margins. With 4k examples, UDA achieves an error rate of 5.27, matching the performance of the fully supervised model that uses 50k examples. Furthermore, with a more advanced architecture, PyramidNet+ShakeDrop, UDA achieves a new state-of-the-art error rate of 2.7, a more than 45% reduction in error rate compared to the previous best semi-supervised result. On SVHN, UDA achieves an error rate of 2.85 with only 250 labeled examples, matching the performance of the fully supervised model trained with ~70k labeled examples.
SSL benchmark on CIFAR-10, an image classification task. UDA surpases all existing semi-supervised learning methods, all of which use the Wide-ResNet-28-2 architecture. At 4000 examples, UDA matches the performance of the fully supervised setting with 50,000 examples.
On ImageNet with 10% labeled examples, UDA improves the top-1 accuracy from 55.1% to 68.7%. In the high-data regime with the fully labeled set and 1.3M extra unlabeled examples, UDA continues to provide gains from 78.3% to 79.0% for top-1 accuracy.

Release
We have released the codebase of UDA, together with all data augmentation methods, e.g., back-translation with pre-trained translation models, to replicate our results. We hope that this release will further advance the progress in semi-supervised learning.

Acknowledgements
Special thanks to the co-authors of the paper Zihang Dai, Eduard Hovy, and Quoc V. Le. We’d also like to thank Hieu Pham, Adams Wei Yu, Zhilin Yang, Colin Raffel, Olga Wichrowska, Ekin Dogus Cubuk, Guokun Lai, Jiateng Xie, Yulun Du, Trieu Trinh, Ran Zhao, Ola Spyra, Brandon Yang, Daiyi Peng, Andrew Dai, Samy Bengio and Jeff Dean for their help with this project. A preprint is available online.

Source: Google AI Blog


On-Device Machine Intelligence


To build the cutting-edge technologies that enable conversational understanding and image recognition, we often apply combinations of machine learning technologies such as deep neural networks and graph-based machine learning. However, the machine learning systems that power most of these applications run in the cloud and are computationally intensive and have significant memory requirements. What if you want machine intelligence to run on your personal phone or smartwatch, or on IoT devices, regardless of whether they are connected to the cloud?

Yesterday, we announced the launch of Android Wear 2.0, along with brand new wearable devices, that will run Google's first entirely “on-device” ML technology for powering smart messaging. This on-device ML system, developed by the Expander research team, enables technologies like Smart Reply to be used for any application, including third-party messaging apps, without ever having to connect with the cloud…so now you can respond to incoming chat messages directly from your watch, with a tap.
The research behind this began last year while our team was developing the machine learning systems that enable conversational understanding capability in Allo and Inbox. The Android Wear team reached out to us and was interested to know whether it would be possible to deploy this Smart Reply technology directly onto a smart device. Because of the limited computing power and memory on smart devices, we quickly realized that it was not possible to do so. Our product manager, Patrick McGregor, realized that this presented a unique challenge and an opportunity for the Expander team to return to the drawing board to design a completely new, lightweight, machine learning architecture — not only to enable Smart Reply on Android Wear, but also to power a wealth of other on-device mobile applications. Together with Tom Rudick, Nathan Beach, and other colleagues from the Android Wear team, we set out to build the new system.

Learning with Projections
A simple strategy to build lightweight conversational models might be to create a small dictionary of common rules (input → reply mappings) on the device and use a naive look-up strategy at inference time. This can work for simple prediction tasks involving a small set of classes using a handful of features (such as binary sentiment classification from text, e.g. “I love this movie” conveys a positive sentiment whereas the sentence “The acting was horrible” is negative). But, it does not scale to complex natural language tasks involving rich vocabularies and the wide language variability observed in chat messages. On the other hand, machine learning models like recurrent neural networks (such as LSTMs), in conjunction with graph learning, have proven to be extremely powerful tools for complex sequence learning in natural language understanding tasks, including Smart Reply. However, compressing such rich models to fit in device memory and produce robust predictions at low computation cost (rapidly on-demand) is extremely challenging. Early experiments with restricting the model to predict only a small handful of replies or using other techniques like quantization or character-level models did not produce useful results.

Instead, we built a different solution for the on-device ML system. We first use a fast, efficient mechanism to group similar incoming messages and project them to similar (“nearby”) bit vector representations. While there are several ways to perform this projection step, such as using word embeddings or encoder networks, we employ a modified version of locality sensitive hashing (LSH) to reduce dimension from millions of unique words to a short, fixed-length sequence of bits. This allows us to compute a projection for an incoming message very fast, on-the-fly, with a small memory footprint on the device since we do not need to store the incoming messages, word embeddings, or even the full model used for training.
Projection step: Similar messages are grouped together and projected to nearby vectors. For example, the messages "hey, how's it going?" and "How's it going buddy?" share similar content and might be projected to the same vector 11100011. Another related message “Howdy, everything going well?” is mapped to a nearby vector 11100110 that differs only in 2 bits.
Next, our system takes the incoming message along with its projections and jointly trains a “message projection model” that learns to predict likely replies using our semi-supervised graph learning framework. The graph learning framework enables training a robust model by combining semantic relationships from multiple sources — message/reply interactions, word/phrase similarity, semantic cluster information — learning useful projection operations that can be mapped to good reply predictions.
Learning step: (Top) Messages along with projections and corresponding replies, if available, are used in a machine learning framework to jointly learn a “message projection model”. (Bottom) The message projection model learns to associate replies with the projections of the corresponding incoming messages. For example, the model projects two different messages “Howdy, everything going well?” and “How’s it going buddy?” (bottom center) to nearby bit vectors and learns to map these to relevant replies (bottom right).
It’s worth noting that while the message projection model can be trained using complex machine learning architectures and the power of the cloud, as described above, the model itself resides and performs inference completely on device. Apps running on the device can pass a user’s incoming messages and receive reply predictions from the on-device model without data leaving the device. The model can also be adapted to cater to the user’s writing style and individual preferences to provide a personalized experience.
Inference step: The model applies the learned projections to an incoming message (or sequence of messages) and suggests relevant and diverse replies. Inference is performed on the device, allowing the model to adapt to user data and personal writing styles.
To get the on-device system to work out of the box, we had to make a few additional improvements such as optimizing for speeding up computations on device and generating rich, diverse replies from the model. We will have a forthcoming scientific publication that describes the on-device machine learning work in more detail.

Converse from Your Wrist
When we embarked on our journey to build this technology from scratch, we weren’t sure if the predictions would be useful or of sufficient quality. We’re quite surprised and excited about how well it works even on Android wearable devices with very limited computation and memory resources. We look forward to continuing to improve the models to provide users with more delightful conversational experiences, and we will be leveraging this on-device ML platform to enable completely new applications in the months to come.

You can now use this feature to respond to your messages directly from your Google watches or any watch that runs Android Wear 2.0. It is already enabled on Google Hangouts, Google Messenger, and many third-party messaging apps. We also provide an API for developers of third-party Wear apps.

Acknowledgements
On behalf of the Google Expander team, I would also like to thank the following people who helped make this technology a success: Andrei Broder, Andrew Tomkins, David Singleton, Mirko Ranieri, Robin Dua and Yicheng Fan.

A Large Corpus for Supervised Word-Sense Disambiguation


Understanding the various meanings of a particular word in text is key to understanding language. For example, in the sentence “he will receive stock in the reorganized company”, we know that “stock” refers to “the capital raised by a business or corporation through the issue and subscription of shares” as defined in the New Oxford American Dictionary (NOAD), based on the context. However, there are more than 10 other definitions for “stock” in NOAD, ranging from “goods in a store”to “a medieval device for punishment”. For a computer algorithm, distinguishing between these meanings is so difficult that it has been described as “AI-complete” in the past (Navigli, 2009; Ide and Veronis 1998; Mallery 1988).

In order to help further progress on this challenge, we’re happy to announce the release of word-sense annotations on the popular MASC and SemCor datasets, manually annotated with senses from the NOAD. We’re also releasing mappings from the NOAD senses to English Wordnet, which is more commonly used by the research community. This is one of the largest releases of fully sense-annotated English corpora.

Supervised Word-Sense Disambiguation
Humans distinguish between meanings of words in text easily because we have access to an enormous amount of common-sense knowledge about how the world works, and how this connects to language. For an example of the difficulty, “[stock] in a business” implies the financial sense, but “[stock] in a bodega” is more likely to refer to goods on the shelves of a store, even though a bodega is a kind of business. Acquiring sufficient knowledge in a form that a machine can use, and then applying it to understanding the words in text, is a challenge.

Supervised word-sense disambiguation (WSD) is the problem of building a machine-learned system using human-labeled data that can assign a dictionary sense to all words used in text (in contrast to entity disambiguation, which focuses on nouns, mostly proper). Building a supervised model that performs better than just assigning the most frequent sense of a word without considering the surrounding text is difficult, but supervised models can perform well when supplied with significant amounts of training data. (Navigli, 2009)

By releasing this dataset, it is our hope that the research community will be able to further the advance of algorithms that allow machines to understand language better, allowing applications such as:
  • Facilitating the automatic construction of databases from text in order to answer questions and connect knowledge in documents. For example, understanding that a “hemi engine” is a kind of automotive machinery, and a “locomotive engine” is a kind of train, or that “Kanye West is a star” implies that he is a celebrity, but “Sirius is a star” implies that it is an astronomical object.
  • Disambiguating words in queries, so that results for “date palm” and “date night” or “web spam” and “spam recipe” can have distinct interpretations for different senses, and documents returned from a query have the same meaning that is implied by the query.
Manual Annotation
In the manually labeled data sets that we are releasing, each sense annotation is labeled by five raters. To ensure high quality of the sense annotation, raters are first trained with gold annotations, which were labeled by experienced linguists in a separate pilot study before the annotation task. The figure below shows an example of a rater’s work page in our annotation tool.

The left side of the page lists all candidate dictionary senses (in this case, the word “general”). Example sentences from the dictionary are also provided. The to-be-annotated words, highlighted within a sentence, are shown on the right side of the work page. Besides linking a dictionary sense to a word, raters could also label one of the three exceptions: (1) The word is a typo (2) None of the above and (3) I can’t decide. Raters could also check whether the word usage is a metaphor and leave comments.

The sense annotation task used for this data release achieves an inter-rater reliability score of 0.869 using Krippendorff's alpha (α >= 0.67 is considered an acceptable level of reproducibility, and α >= 0.80 is considered a highly reproducible result) (Krippendorff, 2004). Annotation counts are listed below.

Total
noun
verb
adjective
adverb
SemCor
115k
38k
57k
11.6k
8.6k
MASC
133k
50k
12.7k
13.6k
4.2k

Wordnet Mappings
We’ve also included two sets of mappings from NOAD to Wordnet. A smaller set of 2200 words was manually mapped in a process similar to the sense annotations described above, and a larger set was created algorithmically. Together, these mappings allow for resources in Wordnet to be applied to this NOAD corpus, and for systems built using Wordnet to be evaluated using this corpus.

You can learn more about our full research results on this corpus using LSTM-based language models and semi-supervised learning in “Semi-supervised Word Sense Disambiguation with Neural Models”.

Acknowledgements
The datasets were built with help from Eric Altendorf, Heng Chen, Jutta Degener, Ryan Doherty, David Huynh, Ji Li, Julian Richardson and Binbin Ruan.

Graph-powered Machine Learning at Google


Recently, there have been significant advances in Machine Learning that enable computer systems to solve complex real-world problems. One of those advances is Google’s large scale, graph-based machine learning platform, built by the Expander team in Google Research. A technology that is behind many of the Google products and features you may use everyday, graph-based machine learning is a powerful tool that can be used to power useful features such as reminders in Inbox and smart messaging in Allo, or used in conjunction with deep neural networks to power the latest image recognition system in Google Photos.
Learning with Minimal Supervision

Much of the recent success in deep learning and machine learning, in general, can be attributed to models that demonstrate high predictive capacity when trained on large amounts of labeled data -- often millions of training examples. This is commonly referred to as “supervised learning” since it requires supervision, in the form of labeled data, to train the machine learning systems. (Conversely, some machine learning methods operate directly on raw data without any supervision, a paradigm referred to as unsupervised learning.)

However, the more difficult the task, the harder it is to get sufficient high-quality labeled data. It is often prohibitively labor intensive and time-consuming to collect labeled data for every new problem. This motivated the Expander research team to build new technology for powering machine learning applications at scale and with minimal supervision.

Expander’s technology draws inspiration from how humans learn to generalize and bridge the gap between what they already know (labeled information) and novel, unfamiliar observations (unlabeled information). Known as “semi-supervised” learning, this powerful technique enables us to build systems that can work in situations where training data may be sparse. One of the key advantages to a graph-based semi-supervised machine learning approach is the fact that (a) one models labeled and unlabeled data jointly during learning, leveraging the underlying structure in the data, (b) one can easily combine multiple types of signals (for example, relational information from Knowledge Graph along with raw features) into a single graph representation and learn over them. This is in contrast to other machine learning approaches, such as neural network methods, in which it is typical to first train a system using labeled data with features and then apply the trained system to unlabeled data.

Graph Learning: How It Works

At its core, Expander’s platform combines semi-supervised machine learning with large-scale graph-based learning by building a multi-graph representation of the data with nodes corresponding to objects or concepts and edges connecting concepts that share similarities. The graph typically contains both labeled data (nodes associated with a known output category or label) and unlabeled data (nodes for which no labels were provided). Expander’s framework then performs semi-supervised learning to label all nodes jointly by propagating label information across the graph.

However, this is easier said than done! We have to (1) learn efficiently at scale with minimal supervision (i.e., tiny amount of labeled data), (2) operate over multi-modal data (i.e., heterogeneous representations and various sources of data), and (3) solve challenging prediction tasks (i.e., large, complex output spaces) involving high dimensional data that might be noisy.

One of the primary ingredients in the entire learning process is the graph and choice of connections. Graphs come in all sizes, shapes and can be combined from multiple sources. We have observed that it is often beneficial to learn over multi-graphs that combine information from multiple types of data representations (e.g., image pixels, object categories and chat response messages for PhotoReply in Allo). The Expander team’s graph learning platform automatically generates graphs directly from data based on the inferred or known relationships between data elements. The data can be structured (for example, relational data) or unstructured (for example, sparse or dense feature representations extracted from raw data).

To understand how Expander’s system learns, let us consider an example graph shown below.
There are two types of nodes in the graph: “grey” represents unlabeled data whereas the colored nodes represent labeled data. Relationships between node data is represented via edges and thickness of each edge indicates strength of the connection. We can formulate the semi-supervised learning problem on this toy graph as follows: predict a color (“red” or “blue”) for every node in the graph. Note that the specific choice of graph structure and colors depend on the task. For example, as shown in this research paper we recently published, a graph that we built for the Smart Reply feature in Inbox represents email messages as nodes and colors indicate semantic categories of user responses (e.g., “yes”, “awesome”, “funny”).

The Expander graph learning framework solves this labeling task by treating it as an optimization problem. At the simplest level, it learns a color label assignment for every node in the graph such that neighboring nodes are assigned similar colors depending on the strength of their connection. A naive way to solve this would be to try to learn a label assignment for all nodes at once -- this method does not scale to large graphs. Instead, we can optimize the problem formulation by propagating colors from labeled nodes to their neighbors, and then repeating the process. In each step, an unlabeled node is assigned a label by inspecting color assignments of its neighbors. We can update every node’s label in this manner and iterate until the whole graph is colored. This process is a far more efficient way to optimize the same problem and the sequence of iterations converges to a unique solution in this case. The solution at the end of the graph propagation looks something like this:
Semi-supervised learning on a graph
In practice, we use complex optimization functions defined over the graph structure, which incorporate additional information and constraints for semi-supervised graph learning that can lead to hard, non-convex problems. The real challenge, however, is to scale this efficiently to graphs containing billions of nodes, trillions of edges and for complex tasks involving billions of different label types.

To tackle this challenge, we created an approach outlined in Large Scale Distributed Semi-Supervised Learning Using Streaming Approximation, published last year. It introduces a streaming algorithm to process information propagated from neighboring nodes in a distributed manner that makes it work on very large graphs. In addition, it addresses other practical concerns, notably it guarantees that the space complexity or memory requirements of the system stays constant regardless of the difficulty of the task, i.e., the overall system uses the same amount of memory regardless of whether the number of prediction labels is two (as in the above toy example) or a million or even a billion. This enables wide-ranging applications for natural language understanding, machine perception, user modeling and even joint multimodal learning for tasks involving multiple modalities such as text, image and video inputs.

Language Graphs for Learning Humor

As an example use of graph-based machine learning, consider emotion labeling, a language understanding task in Smart Reply for Inbox, where the goal is to label words occurring in natural language text with their fine-grained emotion categories. A neural network model is first applied to a text corpus to learn word embeddings, i.e., a mathematical vector representation of the meaning of each word. The dense embedding vectors are then used to build a sparse graph where nodes correspond to words and edges represent semantic relationship between them. Edge strength is computed using similarity between embedding vectors — low similarity edges are ignored. We seed the graph with emotion labels known a priori for a few nodes (e.g., laugh is labeled as “funny”) and then apply semi-supervised learning over the graph to discover emotion categories for remaining words (e.g., ROTFL gets labeled as “funny” owing to its multi-hop semantic connection to the word “laugh”).
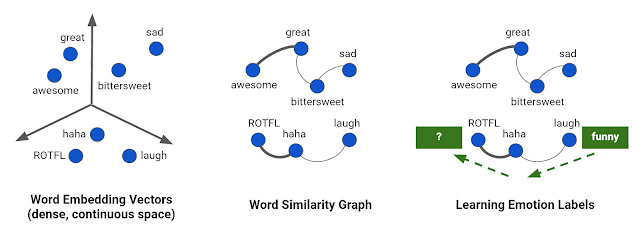
Learning emotion associations using graph constructed from word embedding vectors
For applications involving large datasets or dense representations that are observed (e.g., pixels from images) or learned using neural networks (e.g., embedding vectors), it is infeasible to compute pairwise similarity between all objects to construct edges in the graph. The Expander team solves this problem by leveraging approximate, linear-time graph construction algorithms.

Graph-based Machine Intelligence in Action

The Expander team’s machine learning system is now being used on massive graphs (containing billions of nodes and trillions of edges) to recognize and understand concepts in natural language, images, videos, and queries, powering Google products for applications like reminders, question answering, language translation, visual object recognition, dialogue understanding, and more.

We are excited that with the recent release of Allo, millions of chat users are now experiencing smart messaging technology powered by the Expander team’s system for understanding and assisting with chat conversations in multiple languages. Also, this technology isn’t used only for large-scale models in the cloud - as announced this past week, Android Wear has opened up an on-device Smart Reply capability for developers that will provide smart replies for any messaging application. We’re excited to tackle even more challenging Internet-scale problems with Expander in the years to come.

Acknowledgements

We wish to acknowledge the hard work of all the researchers, engineers, product managers, and leaders across Google who helped make this technology a success. In particular, we would like to highlight the efforts of Allan Heydon, Andrei Broder, Andrew Tomkins, Ariel Fuxman, Bo Pang, Dana Movshovitz-Attias, Fritz Obermeyer, Krishnamurthy Viswanathan, Patrick McGregor, Peter Young, Robin Dua, Sujith Ravi and Vivek Ramavajjala.