Tag Archives: TPU

Advancements in machine learning for machine learning

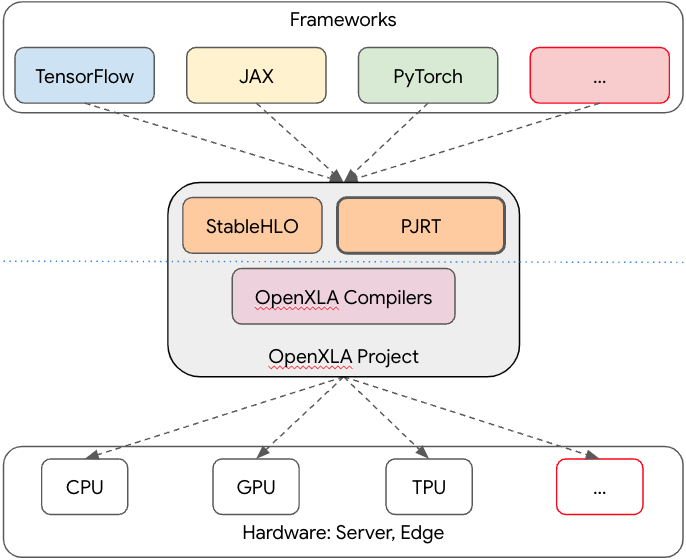
With the recent and accelerated advances in machine learning (ML), machines can understand natural language, engage in conversations, draw images, create videos and more. Modern ML models are programmed and trained using ML programming frameworks, such as TensorFlow, JAX, PyTorch, among many others. These libraries provide high-level instructions to ML practitioners, such as linear algebra operations (e.g., matrix multiplication, convolution, etc.) and neural network layers (e.g., 2D convolution layers, transformer layers). Importantly, practitioners need not worry about how to make their models run efficiently on hardware because an ML framework will automatically optimize the user's model through an underlying compiler. The efficiency of the ML workload, thus, depends on how good the compiler is. A compiler typically relies on heuristics to solve complex optimization problems, often resulting in suboptimal performance.

In this blog post, we present exciting advancements in ML for ML. In particular, we show how we use ML to improve efficiency of ML workloads! Prior works, both internal and external, have shown that we can use ML to improve performance of ML programs by selecting better ML compiler decisions. Although there exist a few datasets for program performance prediction, they target small sub-programs, such as basic blocks or kernels. We introduce “TpuGraphs: A Performance Prediction Dataset on Large Tensor Computational Graphs” (presented at NeurIPS 2023), which we recently released to fuel more research in ML for program optimization. We hosted a Kaggle competition on the dataset, which recently completed with 792 participants on 616 teams from 66 countries. Furthermore, in “Learning Large Graph Property Prediction via Graph Segment Training”, we cover a novel method to scale graph neural network (GNN) training to handle large programs represented as graphs. The technique both enables training arbitrarily large graphs on a device with limited memory capacity and improves generalization of the model.


ML compilers

ML compilers are software routines that convert user-written programs (here, mathematical instructions provided by libraries such as TensorFlow) to executables (instructions to execute on the actual hardware). An ML program can be represented as a computation graph, where a node represents a tensor operation (such as matrix multiplication), and an edge represents a tensor flowing from one node to another. ML compilers have to solve many complex optimization problems, including graph-level and kernel-level optimizations. A graph-level optimization requires the context of the entire graph to make optimal decisions and transforms the entire graph accordingly. A kernel-level optimization transforms one kernel (a fused subgraph) at a time, independently of other kernels.

Important optimizations in ML compilers include graph-level and kernel-level optimizations.

To provide a concrete example, imagine a matrix (2D tensor):

It can be stored in computer memory as [A B C a b c] or [A a B b C c], known as row- and column-major memory layout, respectively. One important ML compiler optimization is to assign memory layouts to all intermediate tensors in the program. The figure below shows two different layout configurations for the same program. Let’s assume that on the left-hand side, the assigned layouts (in red) are the most efficient option for each individual operator. However, this layout configuration requires the compiler to insert a copy operation to transform the memory layout between the add and convolution operations. On the other hand, the right-hand side configuration might be less efficient for each individual operator, but it doesn’t require the additional memory transformation. The layout assignment optimization has to trade off between local computation efficiency and layout transformation overhead.

A node represents a tensor operator, annotated with its output tensor shape [n0, n1, ...], where ni is the size of dimension i. Layout {d0, d1, ...} represents minor-to-major ordering in memory. Applied configurations are highlighted in red, and other valid configurations are highlighted in blue. A layout configuration specifies the layouts of inputs and outputs of influential operators (i.e., convolution and reshape). A copy operator is inserted when there is a layout mismatch.

If the compiler makes optimal choices, significant speedups can be made. For example, we have seen up to a 32% speedup when choosing an optimal layout configuration over the default compiler’s configuration in the XLA benchmark suite.


TpuGraphs dataset

Given the above, we aim to improve ML model efficiency by improving the ML compiler. Specifically, it can be very effective to equip the compiler with a learned cost model that takes in an input program and compiler configuration and then outputs the predicted runtime of the program.

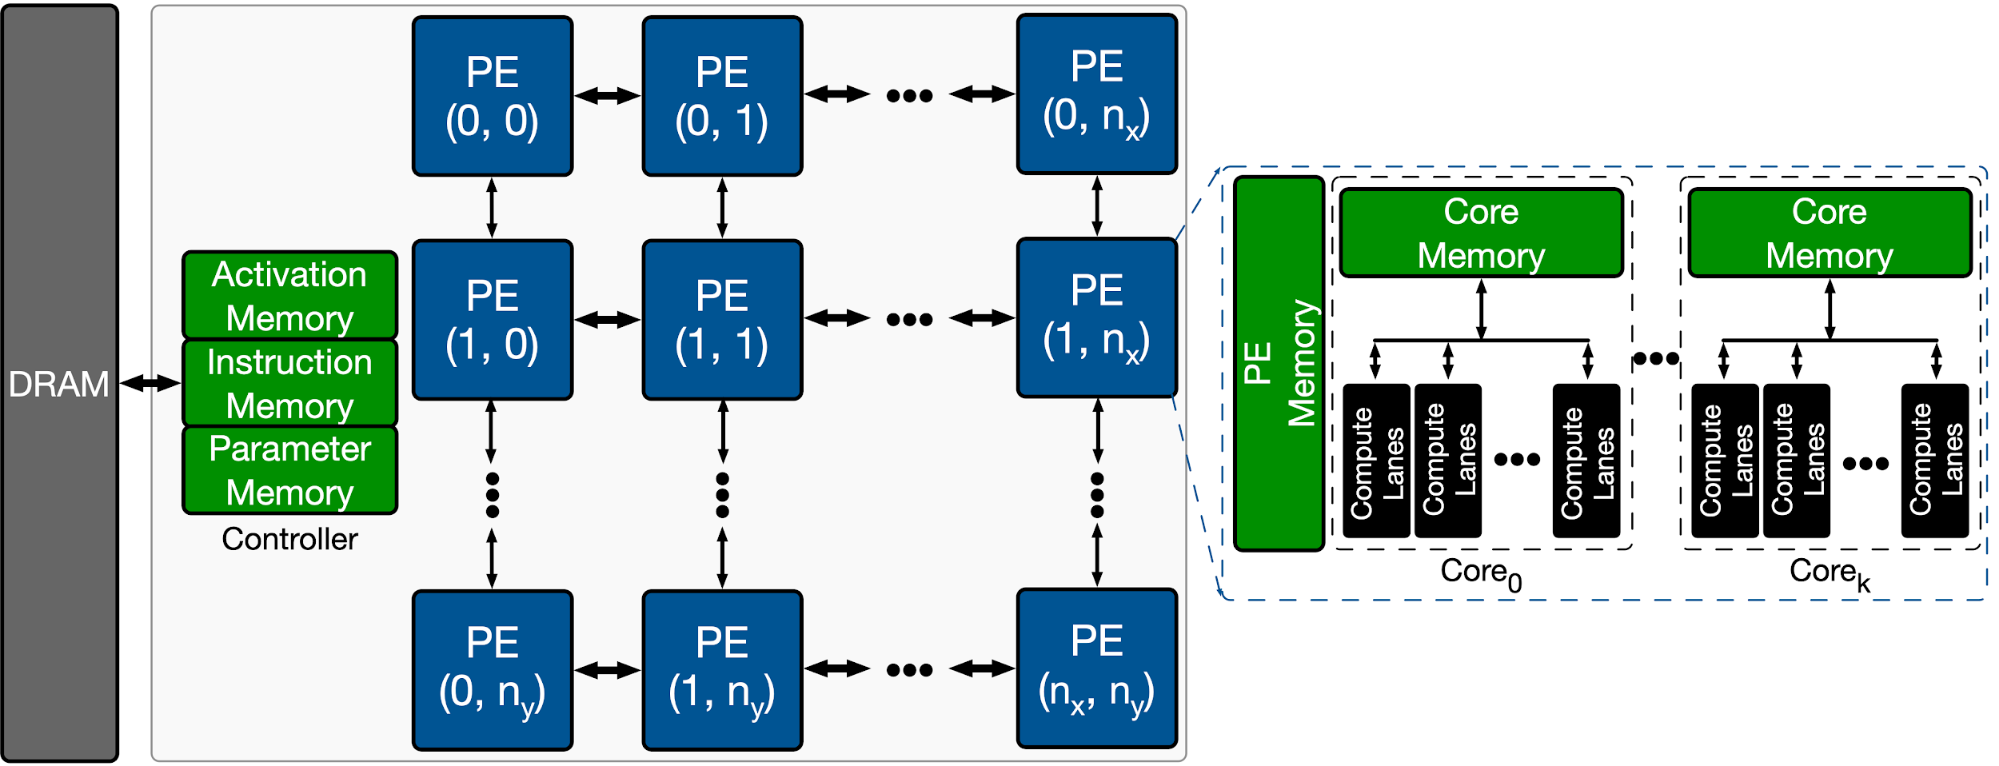
With this motivation, we release TpuGraphs, a dataset for learning cost models for programs running on Google’s custom Tensor Processing Units (TPUs). The dataset targets two XLA compiler configurations: layout (generalization of row- and column-major ordering, from matrices, to higher dimension tensors) and tiling (configurations of tile sizes). We provide download instructions and starter code on the TpuGraphs GitHub. Each example in the dataset contains a computational graph of an ML workload, a compilation configuration, and the execution time of the graph when compiled with the configuration. The graphs in the dataset are collected from open-source ML programs, featuring popular model architectures, e.g., ResNet, EfficientNet, Mask R-CNN, and Transformer. The dataset provides 25× more graphs than the largest (earlier) graph property prediction dataset (with comparable graph sizes), and graph size is 770× larger on average compared to existing performance prediction datasets on ML programs. With this greatly expanded scale, for the first time we can explore the graph-level prediction task on large graphs, which is subject to challenges such as scalability, training efficiency, and model quality.

Scale of TpuGraphs compared to other graph property prediction datasets.

We provide baseline learned cost models with our dataset (architecture shown below). Our baseline models are based on a GNN since the input program is represented as a graph. Node features, shown in blue below, consist of two parts. The first part is an opcode id, the most important information of a node, which indicates the type of tensor operation. Our baseline models, thus, map an opcode id to an opcode embedding via an embedding lookup table. The opcode embedding is then concatenated with the second part, the rest of the node features, as inputs to a GNN. We combine the node embeddings produced by the GNN to create the fixed-size embedding of the graph using a simple graph pooling reduction (i.e., sum and mean). The resulting graph embedding is then linearly transformed into the final scalar output by a feedforward layer.

Our baseline learned cost model employs a GNN since programs can be naturally represented as graphs.

Furthermore we present Graph Segment Training (GST), a method for scaling GNN training to handle large graphs on a device with limited memory capacity in cases where the prediction task is on the entire-graph (i.e., graph-level prediction). Unlike scaling training for node- or edge-level prediction, scaling for graph-level prediction is understudied but crucial to our domain, as computation graphs can contain hundreds of thousands of nodes. In a typical GNN training (“Full Graph Training”, on the left below), a GNN model is trained using an entire graph, meaning all nodes and edges of the graph are used to compute gradients. For large graphs, this might be computationally infeasible. In GST, each large graph is partitioned into smaller segments, and a random subset of segments is selected to update the model; embeddings for the remaining segments are produced without saving their intermediate activations (to avoid consuming memory). The embeddings of all segments are then combined to generate an embedding for the original large graph, which is then used for prediction. In addition, we introduce the historical embedding table to efficiently obtain graph segments’ embeddings and segment dropout to mitigate the staleness from historical embeddings. Together, our complete method speeds up the end-to-end training time by 3×.

Comparing Full Graph Training (typical method) vs Graph Segment Training (our proposed method).

Kaggle competition

Finally, we ran the “Fast or Slow? Predict AI Model Runtime” competition over the TpuGraph dataset. This competition ended with 792 participants on 616 teams. We had 10507 submissions from 66 countries. For 153 users (including 47 in the top 100), this was their first competition. We learned many interesting new techniques employed by the participating teams, such as:

  • Graph pruning / compression: Instead of using the GST method, many teams experimented with different ways to compress large graphs (e.g., keeping only subgraphs that include the configurable nodes and their immediate neighbors).
  • Feature padding value: Some teams observed that the default padding value of 0 is problematic because 0 clashes with a valid feature value, so using a padding value of -1 can improve the model accuracy significantly.
  • Node features: Some teams observed that additional node features (such as dot general’s contracting dimensions) are important. A few teams found that different encodings of node features also matter.
  • Cross-configuration attention: A winning team designed a simple layer that allows the model to explicitly "compare" configs against each other. This technique is shown to be much better than letting the model infer for each config individually.

We will debrief the competition and preview the winning solutions at the competition session at the ML for Systems workshop at NeurIPS on December 16, 2023. Finally, congratulations to all the winners and thank you for your contributions to advancing research in ML for systems!


NeurIPS expo

If you are interested in more research about structured data and artificial intelligence, we hosted the NeurIPS Expo panel Graph Learning Meets Artificial Intelligence on December 9, which covered advancing learned cost models and more!


Acknowledgements

Sami Abu-el-Haija (Google Research) contributed significantly to this work and write-up. The research in this post describes joint work with many additional collaborators including Mike Burrows, Kaidi Cao, Bahare Fatemi, Jure Leskovec, Charith Mendis, Dustin Zelle, and Yanqi Zhou.

Source: Google AI Blog


A novel computational fluid dynamics framework for turbulent flow research

Turbulence is ubiquitous in environmental and engineering fluid flows, and is encountered routinely in everyday life. A better understanding of these turbulent processes could provide valuable insights across a variety of research areas — improving the prediction of cloud formation by atmospheric transport and the spreading of wildfires by turbulent energy exchange, understanding sedimentation of deposits in rivers, and improving the efficiency of combustion in aircraft engines to reduce emissions, to name a few. However, despite its importance, our current understanding and our ability to reliably predict such flows remains limited. This is mainly attributed to the highly chaotic nature and the enormous spatial and temporal scales these fluid flows occupy, ranging from energetic, large-scale movements on the order of several meters on the high-end, where energy is injected into the fluid flow, all the way down to micrometers (μm) on the low-end, where the turbulence is dissipated into heat by viscous friction.

A powerful tool to understand these turbulent flows is the direct numerical simulation (DNS), which provides a detailed representation of the unsteady three-dimensional flow-field without making any approximations or simplifications. More specifically, this approach utilizes a discrete grid with small enough grid spacing to capture the underlying continuous equations that govern the dynamics of the system (in this case, variable-density Navier-Stokes equations, which govern all fluid flow dynamics). When the grid spacing is small enough, the discrete grid points are enough to represent the true (continuous) equations without the loss of accuracy. While this is attractive, such simulations require tremendous computational resources in order to capture the correct fluid-flow behaviors across such a wide range of spatial scales.

The actual span in spatial resolution to which direct numerical calculations must be applied depends on the task and is determined by the Reynolds number, which compares inertial to viscous forces. Typically, the Reynolds number can range between 102 up to 107 (even larger for atmospheric or interstellar problems). In 3D, the grid size for the resolution required scales roughly with the Reynolds number to the power of 4.5! Because of this strong scaling dependency, simulating such flows is generally limited to flow regimes with moderate Reynolds numbers, and typically requires access to high-performance computing systems with millions of CPU/GPU cores.

In “A TensorFlow simulation framework for scientific computing of fluid flows on tensor processing units”, we introduce a new simulation framework that enables the computation of fluid flows with TPUs. By leveraging latest advances on TensorFlow software and TPU-hardware architecture, this software tool allows detailed large-scale simulations of turbulent flows at unprecedented scale, pushing the boundaries of scientific discovery and turbulence analysis. We demonstrate that this framework scales efficiently to accommodate the scale of the problem or, alternatively, improved run times, which is remarkable since most large-scale distributed computation frameworks exhibit reduced efficiency with scaling. The software is available as an open-source project on GitHub.


Large-scale scientific computation with accelerators

The software solves variable-density Navier-Stokes equations on TPU architectures using the TensorFlow framework. The single-instruction, multiple-data (SIMD) approach is adopted for parallelization of the TPU solver implementation. The finite difference operators on a colocated structured mesh are cast as filters of the convolution function of TensorFlow, leveraging TPU’s matrix multiply unit (MXU). The framework takes advantage of the low-latency high-bandwidth inter-chips interconnect (ICI) between the TPU accelerators. In addition, by leveraging the single-precision floating-point computations and highly optimized executable through the accelerated linear algebra (XLA) compiler, it’s possible to perform large-scale simulations with excellent scaling on TPU hardware architectures.

This research effort demonstrates that the graph-based TensorFlow in combination with new types of ML special purpose hardware, can be used as a programming paradigm to solve partial differential equations representing multiphysics flows. The latter is achieved by augmenting the Navier-Stokes equations with physical models to account for chemical reactions, heat-transfer, and density changes to enable, for example, simulations of cloud formation and wildfires.

It’s worth noting that this framework is the first open-source computational fluid dynamics (CFD) framework for high-performance, large-scale simulations to fully leverage the cloud accelerators that have become common (and become a commodity) with the advancement of machine learning (ML) in recent years. While our work focuses on using TPU accelerators, the code can be easily adjusted for other accelerators, such as GPU clusters.

This framework demonstrates a way to greatly reduce the cost and turn-around time associated with running large-scale scientific CFD simulations and enables even greater iteration speed in fields, such as climate and weather research. Since the framework is implemented using TensorFlow, an ML language, it also enables the ready integration with ML methods and allows the exploration of ML approaches on CFD problems. With the general accessibility of TPU and GPU hardware, this approach lowers the barrier for researchers to contribute to our understanding of large-scale turbulent systems.


Framework validation and homogeneous isotropic turbulence

Beyond demonstrating the performance and the scaling capabilities, it is also critical to validate the correctness of this framework to ensure that when it is used for CFD problems, we get reasonable results. For this purpose, researchers typically use idealized benchmark problems during CFD solver development, many of which we adopted in our work (more details in the paper).

One such benchmark for turbulence analysis is homogeneous isotropic turbulence (HIT), which is a canonical and well studied flow in which the statistical properties, such as kinetic energy, are invariant under translations and rotations of the coordinate axes. By pushing the resolution to the limits of the current state of the art, we were able to perform direct numerical simulations with more than eight billion degrees of freedom — equivalent to a three-dimensional mesh with 2,048 grid points along each of the three directions. We used 512 TPU-v4 cores, distributing the computation of the grid points along the x, y, and z axes to a distribution of [2,2,128] cores, respectively, optimized for the performance on TPU. The wall clock time per timestep was around 425 milliseconds and the flow was simulated for a total of 400,000 timesteps. 50 TB data, which includes the velocity and density fields, is stored for 400 timesteps (every 1,000th step). To our knowledge, this is one of the largest turbulent flow simulations of its kind conducted to date.

Due to the complex, chaotic nature of the turbulent flow field, which extends across several magnitudes of resolution, simulating the system in high resolution is necessary. Because we employ a fine-resolution grid with eight billion points, we are able to accurately resolve the field.

Contours of x-component of velocity along the z midplane. The high resolution of the simulation is critical to accurately represent the turbulent field.

The turbulent kinetic energy and dissipation rates are two statistical quantities commonly used to analyze a turbulent flow. The temporal decay of these properties in a turbulent field without additional energy injection is due to viscous dissipation and the decay asymptotes follow the expected analytical power law. This is in agreement with the theoretical asymptotes and observations reported in the literature and thus, validates our framework.

Solid line: Temporal evolution of turbulent kinetic energy (k). Dashed line: Analytical power laws for decaying homogeneous isotropic turbulence (n=1.3) (l: eddy turnover time).
Solid line: Temporal evolution of dissipation rate (ε). Dashed line: Analytical power laws for decaying homogeneous isotropic turbulence (n=1.3).

The energy spectrum of a turbulent flow represents the energy content across wavenumber, where the wavenumber k is proportional to the inverse wavelength λ (i.e., k ∝ 1/λ). Generally, the spectrum can be qualitatively divided into three ranges: source range, inertial range and viscous dissipative range (from left to right on the wavenumber axis, below). The lowest wavenumbers in the source range correspond to the largest turbulent eddies, which have the most energy content. These large eddies transfer energy to turbulence in the intermediate wavenumbers (inertial range), which is statistically isotropic (i.e., essentially uniform in all directions). The smallest eddies, corresponding to the largest wavenumbers, are dissipated into thermal energy by the viscosity of the fluid. By virtue of the fine grid having 2,048 points in each of the three spatial directions, we are able to resolve the flow field up to the length scale at which viscous dissipation takes place. This direct numerical simulation approach is the most accurate as it does not require any closure model to approximate the energy cascade below the grid size.

Spectrum of turbulent kinetic energy at different time instances. The spectrum is normalized by the instantaneous integral length (l) and the turbulent kinetic energy (k).

A new era for turbulent flows research

More recently, we extended this framework to predict wildfires and atmospheric flows, which is relevant for climate-risk assessment. Apart from enabling high-fidelity simulations of complex turbulent flows, this simulation framework also provides capabilities for scientific machine learning (SciML) — for example, downsampling from a fine to a coarse grid (model reduction) or building models that run at lower resolution while still capturing the correct dynamic behaviors. It could also provide avenues for further scientific discovery, such as building ML-based models to better parameterize microphysics of turbulent flows, including physical relationships between temperature, pressure, vapor fraction, etc., and could improve upon various control tasks, e.g., to reduce the energy consumption of buildings or find more efficient propeller shapes. While attractive, a main bottleneck in SciML has been the availability of data for training. To explore this, we have been working with groups at Stanford and Kaggle to make the data from our high-resolution HIT simulation available through a community-hosted web-platform, BLASTNet, to provide broad access to high-fidelity data to the research community via a network-of-datasets approach. We hope that the availability of these emerging high-fidelity simulation tools in conjunction with community-driven datasets will lead to significant advances in various areas of fluid mechanics.


Acknowledgements

We would like to thank Qing Wang, Yi-Fan Chen, and John Anderson for consulting and advice, Tyler Russell and Carla Bromberg for program management.

Source: Google AI Blog


PJRT: Simplifying ML Hardware and Framework Integration

Infrastructure fragmentation in Machine Learning (ML) across frameworks, compilers, and runtimes makes developing new hardware and toolchains challenging. This inhibits the industry’s ability to quickly productionize ML-driven advancements. To simplify the growing complexity of ML workload execution across hardware and frameworks, we are excited to introduce PJRT and open source it as part of the recently available OpenXLA Project.

PJRT (used in conjunction with OpenXLA’s StableHLO) provides a hardware- and framework-independent interface for compilers and runtimes. It simplifies the integration of hardware with frameworks, accelerating framework coverage for the hardware, and thus hardware targetability for workload execution.

PJRT is the primary interface for TensorFlow and JAX and fully supported for PyTorch, and is well integrated with the OpenXLA ecosystem to execute workloads on TPU, GPU, and CPU. It is also the default runtime execution path for most of Google’s internal production workloads. The toolchain-independent architecture of PJRT allows it to be leveraged by any hardware, framework, or compiler, with extensibility for unique features. With this open-source release, we're excited to allow anyone to begin leveraging PJRT for their own devices.

If you’re developing an ML hardware accelerator or developing your own compiler and runtime, check out the PJRT source code on GitHub and sign up for the OpenXLA mailing list to quickly bootstrap your work.

Vision: Simplifying ML Hardware and Framework Integration

We are entering a world of ambient experiences where intelligent apps and devices surround us, from edge to the cloud, in a range of environments and scales. ML workload execution currently supports a combinatorial matrix of hardware, frameworks, and workflows, mostly through tight vertical integrations. Examples of such vertical integrations include specific kernels for TPU versus GPU, specific toolchains to train and serve in TensorFlow versus PyTorch. These bespoke 1:1 integrations are perfectly valid solutions but promote lock-in, inhibit innovation, and are expensive to maintain. This problem of a fragmented software stack is compounded over time as different computing hardware needs to be supported.

A variety of ML hardware exists today and hardware diversity is expected to increase in the future. ML users have options and they want to exercise them seamlessly: users want to train a large language model (LLM) on TPU in the Cloud, batch infer on GPU or even CPU, distill, quantize, and finally serve them on mobile processors. Our goal is to solve the challenge of making ML workloads portable across hardware by making it easy to integrate the hardware into the ML infrastructure (framework, compiler, runtime).

Portability: Seamless Execution

The workflow to enable this vision with PJRT is as follows (shown in Figure 1):

  1. The hardware-specific compiler and runtime provider implement the PJRT API, package it as a plugin containing the compiler and runtime hooks, and register it with the frameworks. The implementation can be opaque to the frameworks.
  2. The frameworks discover and load one or multiple PJRT plugins as dynamic libraries targeting the hardware on which to execute the workload.
  3. That’s it! Execute the workload from the framework onto the target hardware.

The PJRT API will be backward compatible. The plugin would not need to change often and would be able to do version-checking for features.

Diagram of PJRT architecture
Figure 1: To target specific hardware, provide an implementation of the PJRT API to package a compiler and runtime plugin that can be called by the framework.

Cohesive Ecosystem

As a foundational pillar of the OpenXLA Project, PJRT is well-integrated with projects within the OpenXLA Project including StableHLO and the OpenXLA compilers (XLA, IREE). It is the primary interface for TensorFlow and JAX and fully supported for PyTorch through PyTorch/XLA. It provides the hardware interface layer in solving the combinatorial framework x hardware ML infrastructure fragmentation (see Figure 2).

Diagram of PJRT hardware interface layer
Figure 2: PJRT provides the hardware interface layer in solving the combinatorial framework x hardware ML infrastructure fragmentation, well-integrated with OpenXLA.

Toolchain Independent

PJRT is hardware and framework independent. With framework integration through the self-contained IR StableHLO, PJRT is not coupled with a specific compiler, and can be used outside of the OpenXLA ecosystem, including with other proprietary compilers. The public availability and toolchain-independent architecture allows it to be used by any hardware, framework or compiler, with extensibility for unique features. If you are developing an ML hardware accelerator, compiler, or runtime targeting any hardware, or converging siloed toolchains to solve infrastructure fragmentation, PJRT can minimize bespoke hardware and framework integration, providing greater coverage and improving time-to-market at lower development cost.

Driving Impact with Collaboration

Industry partners such as Intel and others have already adopted PJRT.

Intel

Intel is leveraging PJRT in Intel® Extension for TensorFlow to provide the Intel GPU backend for TensorFlow and JAX. This implementation is based on the PJRT plugin mechanism (see RFC). Check out how this greatly simplifies the framework and hardware integration with this example of executing a JAX program on Intel GPU.

"At Intel, we share Google's vision of modular interfaces to make integration easier and enable faster, framework-independent development. Similar in design to the PluggableDevice mechanism, PJRT is a pluggable interface that allows us to easily compile and execute XLA's High Level Operations on Intel devices. Its simple design allowed us to quickly integrate it into our systems and start running JAX workloads on Intel® GPUs within just a few months. PJRT enables us to more efficiently deliver hardware acceleration and oneAPI-powered AI software optimizations to developers using a wide range of AI Frameworks." - Wei Li, VP and GM, Artificial Intelligence and Analytics, Intel.

Technology Leader

We’re also working with a technology leader to leverage PJRT to provide the backend targeting their proprietary processor for JAX. More details on this to follow soon.

Get Involved

PJRT is available on GitHub: source code for the API and a reference openxla-pjrt-plugin, and integration guides. If you develop ML frameworks, compilers, or runtimes, or are interested in improving portability of workloads across hardware, we want your feedback. We encourage you to contribute code, design ideas, and feature suggestions. We also invite you to join the OpenXLA mailing list to stay updated with the latest product and community announcements and to help shape the future of an interoperable ML infrastructure.

Acknowledgements

Allen Hutchison, Andrew Leaver, Chuanhao Zhuge, Jack Cao, Jacques Pienaar, Jieying Luo, Penporn Koanantakool, Peter Hawkins, Robert Hundt, Russell Power, Sagarika Chalasani, Skye Wanderman-Milne, Stella Laurenzo, Will Cromar, Xiao Yu.

By Aman Verma, Product Manager, Machine Learning Infrastructure

ML in Action: Campaign to Collect and Share Machine Learning Use Cases

Posted by Hee Jung, Developer Relations Community Manager / Soonson Kwon, Developer Relations Program Manager

ML in Action is a virtual event to collect and share cool and useful machine learning (ML) use cases that leverage multiple Google ML products. This is the first run of an ML use case campaign by the ML Developer Programs team.

Let us announce the winners right now, right here. They have showcased practical uses of ML, and how ML was adapted to real life situations. We hope these projects can spark new applied ML project ideas and provide opportunities for ML community leaders to discuss ML use cases.

4 Winners of "ML in Action" are:

Detecting Food Quality with Raspberry Pi and TensorFlow

By George Soloupis, ML Google Developer Expert (Greece)

This project helps people with smell impairment by identifying food degradation. The idea came suddenly when a friend revealed that he has no sense of smell due to a bike crash. Even with experiences attending a lot of IT meetings, this issue was unaddressed and the power of machine learning is something we could rely on. Hence the goal. It is to create a prototype that is affordable, accurate and usable by people with minimum knowledge of computers.

The basic setting of the food quality detection is this. Raspberry Pi collects data from air sensors over time during the food degradation process. This single board computer was very useful! With the GUI, it’s easy to execute Python scripts and see the results on screen. Eight sensors collected data of the chemical elements such as NH3, H2s, O3, CO, and CH4. After operating the prototype for one day, categories were set following the results. The first hours of the food out of the refrigerator as “good” and the rest as “bad”. Then the dataset was evaluated with the help of TensorFlow and the inference was done with TensorFlow Lite.

Since there were no open source prototypes out there with similar goals, it was a complete adventure. Sensors on PCBs and standalone sensors were used to get the best mixture of accuracy, stability and sensitivity. A logic level converter has been used to minimize the use of resistors, and capacitors have been placed for stability. And the result, a compact prototype! The Raspberry Pi could attach directly on with slots for eight sensors. It is developed in such a way that sensors can be replaced at any time. Users can experiment with different sensors. And the inference time values are sent through the bluetooth to a mobile device. As an end result a user with no advanced technical knowledge will be able to see food quality on an app built on Android (Kotlin).

Reference: Github, more to read

* This project is supported by Google Impact Fund.


Election Watch: Applying ML in Analyzing Elections Discourse and Citizen Participation in Nigeria

By Victor Dibia, ML Google Developer Expert (USA)

This project explores the use of GCP tools in ingesting, storing and analyzing data on citizen participation and election discourse in Nigeria. It began on the premise that the proliferation of social media interactions provides an interesting lens to study human behavior, and ask important questions about election discourse in Nigeria as well as interrogate social/demographic questions.

It is based on data collected from twitter between September 2018 to March 2019 (tweets geotagged to Nigeria and tweets containing election related keywords). Overall, the data set contains 25.2 million tweets and retweets, 12.6 million original tweets, 8.6 million geotagged tweets and 3.6 million tweets labeled (using an ML model) as political.

By analyzing election discourse, we can learn a few important things including - issues that drive election discourse, how social media was utilized by candidates, and how participation was distributed across geographic regions in the country. Finally, in a country like Nigeria where updated demographics data is lacking (e.g., on community structures, wealth distribution etc), this project shows how social media can be used as a surrogate to infer relative statistics (e.g., existence of diaspora communities based on election discussion and wealth distribution based on device type usage across the country).

Data for the project was collected using python scripts that wrote tweets from the Twitter streaming api (matching certain criteria) to BigQuery. BigQuery queries were then used to generate aggregate datasets used for visualizations/analysis and training machine learning models (political text classification models to label political text and multi class classification models to label general discourse). The models were built using Tensorflow 2.0 and trained on Colab notebooks powered by GCP GPU compute VMs.

References: Election Watch website, ML models descriptions one, two


Bioacoustic Sound Detector (To identify bird calls in soundscapes)

By Usha Rengaraju, TFUG Organizer (India)

 
(Bird image is taken by Krisztian Toth @unsplash)

“Visionary Perspective Plan (2020-2030) for the conservation of avian diversity, their ecosystems, habitats and landscapes in the country” proposed by the Indian government to help in the conservation of birds and their habitats inspired me to take up this project.

Extinction of bird species is an increasing global concern as it has a huge impact on food chains. Bioacoustic monitoring can provide a passive, low labor, and cost-effective strategy for studying endangered bird populations. Recent advances in machine learning have made it possible to automatically identify bird songs for common species with ample training data. This innovation makes it easier for researchers and conservation practitioners to accurately survey population trends and they’ll be able to regularly and more effectively evaluate threats and adjust their conservation actions.

This project is an implementation of a Bioacoustic monitor using Masked Autoencoders in TensorFlow and Cloud TPUs. The project will be presented as a browser based application using Flask. The deep learning prototype can process continuous audio data and then acoustically recognize the species.

The goal of the project when I started was to build a basic prototype for monitoring of rare bird species in India. In future I would like to expand the project to monitor other endangered species as well.

References: Kaggle Notebook, Colab Notebook, Github, the dataset and more to read


Persona Labs' Digital Personas

By Martin Andrews and Sam Witteveen, ML Google Developer Experts (Singapore)

Over the last 3 years, Red Dragon AI (a company co-founded by Martin and Sam) has been developing real-time digital “Personas”. The key idea is to enable users to interact with life-like Personas in a format similar to a Zoom call : Speaking to them and seeing them respond in real time, just as a human would. Naturally, each Persona can be tailored to tasks required (by adjusting the appearance, voice, and ‘motivation’ of the dialog system behind the scenes and their corresponding backend APIs).

The components required to make the Personas work effectively include dynamic face models, expression generation models, Text-to-Speech (TTS), dialog backend(s) and Speech Recognition (ASR). Much of this was built on GCP, with GPU VMs running the (many) Deep Learning models and combining the outputs into dynamic WebRTC video that streams to users via a browser front-end.

Much of the previous years’ work focussed on making the Personas’ faces behave in a life-like way, while making sure that the overall latency (i.e. the time between the Persona hearing the user asking a question, to their lips starting the response) is kept low, and the rendering of individual images matches the 25 frames-per-second video rate required. As you might imagine, there were many Deep Learning modeling challenges, coupled with hard engineering issues to overcome.

In terms of backend technologies, Google Cloud GPUs were used to train the Deep Learning models (built using TensorFlow/TFLite, PyTorch/ONNX & more recently JAX/Flax), and the real-time serving is done by Nvidia T4 GPU-enabled VMs, launched as required. Google ASR is currently used as a streaming backend for speech recognition, and Google’s WaveNet TTS is used when multilingual TTS is needed. The system also makes use of Google’s serverless stack with CloudRun and Cloud Functions being used in some of the dialog backends.

Visit the Persona’s website (linked below) and you can see videos that demonstrate several aspects : What the Personas look like; their Multilingual capability; potential applications; etc. However, the videos can’t really demonstrate what the interactivity ‘feels like’. For that, it’s best to get a live demo from Sam and Martin - and see what real-time Deep Learning model generation looks like!

Reference: The Persona Labs website

Good News About the Carbon Footprint of Machine Learning Training

Machine learning (ML) has become prominent in information technology, which has led some to raise concerns about the associated rise in the costs of computation, primarily the carbon footprint, i.e., total greenhouse gas emissions. While these assertions rightfully elevated the discussion around carbon emissions in ML, they also highlight the need for accurate data to assess true carbon footprint, which can help identify strategies to mitigate carbon emission in ML.

In “The Carbon Footprint of Machine Learning Training Will Plateau, Then Shrink”, accepted for publication in IEEE Computer, we focus on operational carbon emissions — i.e., the energy cost of operating ML hardware, including data center overheads — from training of natural language processing (NLP) models and investigate best practices that could reduce the carbon footprint. We demonstrate four key practices that reduce the carbon (and energy) footprint of ML workloads by large margins, which we have employed to help keep ML under 15% of Google’s total energy use.

The 4Ms: Best Practices to Reduce Energy and Carbon Footprints
We identified four best practices that reduce energy and carbon emissions significantly — we call these the “4Ms” — all of which are being used at Google today and are available to anyone using Google Cloud services.

  • Model. Selecting efficient ML model architectures, such as sparse models, can advance ML quality while reducing computation by 3x–10x.
  • Machine. Using processors and systems optimized for ML training, versus general-purpose processors, can improve performance and energy efficiency by 2x–5x.
  • Mechanization. Computing in the Cloud rather than on premise reduces energy usage and therefore emissions by 1.4x–2x. Cloud-based data centers are new, custom-designed warehouses equipped for energy efficiency for 50,000 servers, resulting in very good power usage effectiveness (PUE). On-premise data centers are often older and smaller and thus cannot amortize the cost of new energy-efficient cooling and power distribution systems.
  • Map Optimization. Moreover, the cloud lets customers pick the location with the cleanest energy, further reducing the gross carbon footprint by 5x–10x. While one might worry that map optimization could lead to the greenest locations quickly reaching maximum capacity, user demand for efficient data centers will result in continued advancement in green data center design and deployment.

These four practices together can reduce energy by 100x and emissions by 1000x.

Note that Google matches 100% of its operational energy use with renewable energy sources. Conventional carbon offsets are usually retrospective up to a year after the carbon emissions and can be purchased anywhere on the same continent. Google has committed to decarbonizing all energy consumption so that by 2030, it will operate on 100% carbon-free energy, 24 hours a day on the same grid where the energy is consumed. Some Google data centers already operate on 90% carbon-free energy; the overall average was 61% carbon-free energy in 2019 and 67% in 2020.

Below, we illustrate the impact of improving the 4Ms in practice. Other studies examined training the Transformer model on an Nvidia P100 GPU in an average data center and energy mix consistent with the worldwide average. The recently introduced Primer model reduces the computation needed to achieve the same accuracy by 4x. Using newer-generation ML hardware, like TPUv4, provides an additional 14x improvement over the P100, or 57x overall. Efficient cloud data centers gain 1.4x over the average data center, resulting in a total energy reduction of 83x. In addition, using a data center with a low-carbon energy source can reduce the carbon footprint another 9x, resulting in a 747x total reduction in carbon footprint over four years.

Reduction in gross carbon dioxide equivalent emissions (CO2e) from applying the 4M best practices to the Transformer model trained on P100 GPUs in an average data center in 2017, as done in other studies. Displayed values are the cumulative improvement successively addressing each of the 4Ms: updating the model to Primer; upgrading the ML accelerator to TPUv4; using a Google data center with better PUE than average; and training in a Google Oklahoma data center that uses very clean energy.

Overall Energy Consumption for ML
Google’s total energy usage increases annually, which is not surprising considering increased use of its services. ML workloads have grown rapidly, as has the computation per training run, but paying attention to the 4Ms — optimized models, ML-specific hardware, efficient data centers — has largely compensated for this increased load. Our data shows that ML training and inference are only 10%–15% of Google’s total energy use for each of the last three years, each year split ⅗ for inference and ⅖ for training.

Prior Emission Estimates
Google uses neural architecture search (NAS) to find better ML models. NAS is typically performed once per problem domain/search space combination, and the resulting model can then be reused for thousands of applications — e.g., the Evolved Transformer model found by NAS is open sourced for all to use. As the optimized model found by NAS is often more efficient, the one time cost of NAS is typically more than offset by emission reductions from subsequent use.

A study from the University of Massachusetts (UMass) estimated carbon emissions for the Evolved Transformer NAS.

  • Without ready access to Google hardware or data centers, the study extrapolated from the available P100 GPUs instead of TPUv2s, and assumed US average data center efficiency instead of highly efficient hyperscale data centers. These assumptions increased the estimate by 5x over the energy used by the actual NAS computation that was performed in Google’s data center.
  • In order to accurately estimate the emissions for NAS, it's important to understand the subtleties of how they work. NAS systems use a much smaller proxy task to search for the most efficient models to save time, and then scale up the found models to full size. The UMass study assumed that the search repeated full size model training thousands of times, resulting in emission estimates that are another 18.7x too high.

The overshoot for the NAS was 88x: 5x for energy-efficient hardware in Google data centers and 18.7x for computation using proxies. The actual CO2e for the one-time search were 3,223 kg versus 284,019 kg, 88x less than the published estimate.

Unfortunately, some subsequent papers misinterpreted the NAS estimate as the training cost for the model it discovered, yet emissions for this particular NAS are ~1300x larger than for training the model. These papers estimated that training the Evolved Transformer model takes two million GPU hours, costs millions of dollars, and that its carbon emissions are equivalent to five times the lifetime emissions of a car. In reality, training the Evolved Transformer model on the task examined by the UMass researchers and following the 4M best practices takes 120 TPUv2 hours, costs $40, and emits only 2.4 kg (0.00004 car lifetimes), 120,000x less. This gap is nearly as large as if one overestimated the CO2e to manufacture a car by 100x and then used that number as the CO2e for driving a car.

Outlook
Climate change is important, so we must get the numbers right to ensure that we focus on solving the biggest challenges. Within information technology, we believe these are much more likely the lifecycle costs — i.e., emission estimates that include the embedded carbon emitted from manufacturing all components involved, from chips to data center buildings — of manufacturing computing equipment of all types and sizes1 rather than the operational cost of ML training.

Expect more good news if everyone improves the 4Ms. While these numbers may currently vary across companies, these simple measures can be followed across the industry:

If the 4Ms become widely recognized, we predict a virtuous circle that will bend the curve so that the global carbon footprint of ML training is actually shrinking, not increasing.

Acknowledgements
Let me thank my co-authors who stayed with this long and winding investigation into a topic that was new to most of us: Jeff Dean, Joseph Gonzalez, Urs Hölzle, Quoc Le, Chen Liang, Lluis-Miquel Munguia, Daniel Rothchild, David So, and Maud Texier. We also had a great deal of help from others along the way for an earlier study that eventually led to this version of the paper. Emma Strubell made several suggestions for the prior paper, including the recommendation to examine the recent giant NLP models. Christopher Berner, Ilya Sutskever, OpenAI, and Microsoft shared information about GPT-3. Dmitry Lepikhin and Zongwei Zhou did a great deal of work to measure the performance and power of GPUs and TPUs in Google data centers. Hallie Cramer, Anna Escuer, Elke Michlmayr, Kelli Wright, and Nick Zakrasek helped with the data and policies for energy and CO2e emissions at Google.


1Worldwide IT manufacturing for 2021 included 1700M cell phones, 340M PCs, and 12M data center servers.   

Source: Google AI Blog


Unlocking the Full Potential of Datacenter ML Accelerators with Platform-Aware Neural Architecture Search

Continuing advances in the design and implementation of datacenter (DC) accelerators for machine learning (ML), such as TPUs and GPUs, have been critical for powering modern ML models and applications at scale. These improved accelerators exhibit peak performance (e.g., FLOPs) that is orders of magnitude better than traditional computing systems. However, there is a fast-widening gap between the available peak performance offered by state-of-the-art hardware and the actual achieved performance when ML models run on that hardware.

One approach to address this gap is to design hardware-specific ML models that optimize both performance (e.g., throughput and latency) and model quality. Recent applications of neural architecture search (NAS), an emerging paradigm to automate the design of ML model architectures, have employed a platform-aware multi-objective approach that includes a hardware performance objective. While this approach has yielded improved model performance in practice, the details of the underlying hardware architecture are opaque to the model. As a result, there is untapped potential to build full capability hardware-friendly ML model architectures, with hardware-specific optimizations, for powerful DC ML accelerators.

In “Searching for Fast Model Families on Datacenter Accelerators”, published at CVPR 2021, we advanced the state of the art of hardware-aware NAS by automatically adapting model architectures to the hardware on which they will be executed. The approach we propose finds optimized families of models for which additional hardware performance gains cannot be achieved without loss in model quality (called Pareto optimization). To accomplish this, we infuse a deep understanding of hardware architecture into the design of the NAS search space for discovery of both single models and model families. We provide quantitative analysis of the performance gap between hardware and traditional model architectures and demonstrate the advantages of using true hardware performance (i.e., throughput and latency), instead of the performance proxy (FLOPs), as the performance optimization objective. Leveraging this advanced hardware-aware NAS and building upon the EfficientNet architecture, we developed a family of models, called EfficientNetX, that demonstrate the effectiveness of this approach for Pareto-optimized ML models on TPUs and GPUs.

Platform-Aware NAS for DC ML Accelerators
To achieve high performance, ML models need to adapt to modern ML accelerators. Platform-aware NAS integrates knowledge of the hardware accelerator properties into all three pillars of NAS: (i) the search objectives; (ii) the search space; and (iii) the search algorithm (shown below). We focus on the new search space because it contains the building blocks needed to compose the models and is the key link between the ML model architectures and accelerator hardware architectures.

We construct TPU/GPU specialized search spaces with TPU/GPU-friendly operations to infuse hardware awareness into NAS. For example, a key adaptation is maximizing parallelism to ensure different hardware components inside the accelerators work together as efficiently as possible. This includes the matrix multiplication units (MXUs) in TPUs and the TensorCore in GPUs for matrix/tensor computation, as well as the vector processing units (VPUs) in TPUs and CUDA cores in GPUs for vector processing. Maximizing model arithmetic intensity (i.e., optimizing the parallelism between computation and operations on the high bandwidth memory) is also critical to achieve top performance. To tap into the full potential of the hardware, it is crucial for ML models to achieve high parallelism inside and across these hardware components.

Overview of platform-aware NAS on TPUs/GPUs, highlighting the search space and search objectives.

Advanced platform-aware NAS has an optimized search space containing a set of complementary techniques to holistically improve parallelism for ML model execution on TPUs and GPUs:

  1. It uses specialized tensor reshaping techniques to maximize the parallelism in the MXUs / TensorCores.
  2. It dynamically selects different activation functions depending on matrix operation types to ensure overlapping of vector and matrix/tensor processing.
  3. It employs hybrid convolutions and a novel fusion strategy to strike a balance between total compute and arithmetic intensity to ensure that computation and memory access happens in parallel and to reduce the contention on VPUs / CUDA cores.
  4. With latency-aware compound scaling (LACS), which uses hardware performance instead of FLOPs as the performance objective to search for model depth, width and resolutions, we ensure parallelism at all levels for the entire model family on the Pareto-front.

EfficientNet-X: Platform-Aware NAS-Optimized Computer Vision Models for TPUs and GPUs
Using this approach to platform-aware NAS, we have designed EfficientNet-X, an optimized computer vision model family for TPUs and GPUs. This family builds upon the EfficientNet architecture, which itself was originally designed by traditional multi-objective NAS without true hardware-awareness as the baseline. The resulting EfficientNet-X model family achieves an average speedup of ~1.5x–2x over EfficientNet on TPUv3 and GPUv100, respectively, with comparable accuracy.

In addition to the improved speeds, EfficientNet-X has shed light on the non-proportionality between FLOPs and true performance. Many think FLOPs are a good ML performance proxy (i.e., FLOPs and performance are proportional), but they are not. While FLOPs are a good performance proxy for simple hardware such as scalar machines, they can exhibit a margin of error of up to 400% on advanced matrix/tensor machines. For example, because of its hardware-friendly model architecture, EfficientNet-X requires ~2x more FLOPs than EfficientNet, but is ~2x faster on TPUs and GPUs.

EfficientNet-X family achieves 1.5x–2x speedup on average over the state-of-the-art EfficientNet family, with comparable accuracy on TPUv3 and GPUv100.

Self-Driving ML Model Performance on New Accelerator Hardware Platforms
Platform-aware NAS exposes the inner workings of the hardware and leverages these properties when designing hardware-optimized ML models. In a sense, the “platform-awareness” of the model is a “gene” that preserves knowledge of how to optimize performance for a hardware family, even on new generations, without the need to redesign the models. For example, TPUv4i delivers up to 3x higher peak performance (FLOPS) than its predecessor TPUv2, but EfficientNet performance only improves by 30% when migrating from TPUv2 to TPUv4i. In comparison, EfficientNet-X retains its platform-aware properties even on new hardware and achieves a 2.6x speedup when migrating from TPUv2 to TPUv4i, utilizing almost all of the 3x peak performance gain expected when upgrading between the two generations.

Hardware peak performance ratio of TPUv2 to TPUv4i and the geometric mean speedup of EfficientNet-X and EfficientNet families, respectively, when migrating from TPUv2 to TPUv4i.

Conclusion and Future Work
We demonstrate how to improve the capabilities of platform-aware NAS for datacenter ML accelerators, especially TPUs and GPUs. Both platform-aware NAS and the EfficientNet-X model family have been deployed in production and materialize up to ~40% efficiency gains and significant quality improvements for various internal computer vision projects across Google. Additionally, because of its deep understanding of accelerator hardware architecture, platform-aware NAS was able to identify critical performance bottlenecks on TPUv2-v4i architectures and has enabled design enhancements to future TPUs with significant potential performance uplift. As next steps, we are working on expanding platform-aware NAS’s capabilities to the ML hardware and model design beyond computer vision.

Acknowledgements
Special thanks to our co-authors: Mingxing Tan, Ruoming Pang, Andrew Li, Liqun Cheng, Quoc Le. We also thank many collaborators including Jeff Dean, David Patterson, Shengqi Zhu, Yun Ni, Gang Wu, Tao Chen, Xin Li, Yuan Qi, Amit Sabne, Shahab Kamali, and many others from the broad Google research and engineering teams who helped on the research and the subsequent broad production deployment of platform-aware NAS.

Source: Google AI Blog


Speeding Up Reinforcement Learning with a New Physics Simulation Engine

Reinforcement learning (RL) is a popular method for teaching robots to navigate and manipulate the physical world, which itself can be simplified and expressed as interactions between rigid bodies1 (i.e., solid physical objects that do not deform when a force is applied to them). In order to facilitate the collection of training data in a practical amount of time, RL usually leverages simulation, where approximations of any number of complex objects are composed of many rigid bodies connected by joints and powered by actuators. But this poses a challenge: it frequently takes millions to billions of simulation frames for an RL agent to become proficient at even simple tasks, such as walking, using tools, or assembling toy blocks.

While progress has been made to improve training efficiency by recycling simulation frames, some RL tools instead sidestep this problem by distributing the generation of simulation frames across many simulators. These distributed simulation platforms yield impressive results that train very quickly, but they must run on compute clusters with thousands of CPUs or GPUs which are inaccessible to most researchers.

In “Brax - A Differentiable Physics Engine for Large Scale Rigid Body Simulation”, we present a new physics simulation engine that matches the performance of a large compute cluster with just a single TPU or GPU. The engine is designed to both efficiently run thousands of parallel physics simulations alongside a machine learning (ML) algorithm on a single accelerator and scale millions of simulations seamlessly across pods of interconnected accelerators. We’ve open sourced the engine along with reference RL algorithms and simulation environments that are all accessible via Colab. Using this new platform, we demonstrate 100-1000x faster training compared to a traditional workstation setup.

Three typical RL workflows. The left shows a typical workstation flow: on a single machine, with the environment on CPU, training takes hours or days. The middle shows a typical distributed simulation flow: training takes minutes by farming simulation out to thousands of machines. The right shows the Brax flow: learning and large batch simulation occur side by side on a single CPU/GPU chip.

Physics Simulation Engine Design Opportunities
Rigid body physics are used in video games, robotics, molecular dynamics, biomechanics, graphics and animation, and other domains. In order to accurately model such systems, simulators integrate forces from gravity, motor actuation, joint constraints, object collisions, and others to simulate the motion of a physical system across time.

Simulation of three spherical bodies, a wall, two joints, and one actuator. For each simulation timestep, forces and torques are integrated together to update the positions, rotations, and velocities of each physical body.

Taking a closer look at how most physics simulation engines are designed today, there are a few large opportunities to improve efficiency. As we noted above, a typical robotics learning pipeline places a single learner in a tight feedback with many simulations in parallel, but upon analyzing this architecture, one finds that:

  1. This layout imposes an enormous latency bottleneck. Because the data must travel over the network within a datacenter, the learner must wait for 10,000+ nanoseconds to fetch experience from the simulator. Were this experience instead already on the same device as the learner’s neural network, latency would drop to <1 nanosecond.
  2. The computation necessary for training the agent (one simulation step, followed by one update of the agent’s neural network) is overshadowed by the computation spent packaging the data (i.e., marshalling data within the engine, then into a wire format such as protobuf, then into TCP buffers, and then undoing all these steps on the learner side).
  3. The computations happening within each simulator are remarkably similar, but not exactly the same.

Brax Design
In response to these observations, Brax is designed so that its physics calculations are exactly the same across each of its thousands of parallel environments by ensuring that the simulation is free of branches (i.e., simulation “if” logic that diverges as a result of the environment state). An example of a branch in a physics engine is the application of a contact force between a ball and a wall: different code paths will execute depending on whether the ball is touching the wall. That is, if the ball contacts the wall, separate code for simulating the ball’s bounce off the wall will execute. Brax employs a mix of the following three strategies to avoid branching:

  • Replace the discrete branching logic with a continuous function, such as approximating the ball-wall contact force using a signed distance function. This approach results in the most efficiency gains.
  • Evaluate the branch during JAX’s just-in-time compile. Many branches based on static properties of the environment, such as whether it’s even possible for two objects to collide, may be evaluated prior to simulation time.
  • Run both sides of the branch during simulation but then select only the required results. Because this executes some code that isn’t ultimately used, it wastes operations compared to the above.

Once the calculations are guaranteed to be exactly uniform, the entire training architecture can be reduced in complexity to be executed on a single TPU or GPU. Doing so removes the computational overhead and latency of cross-machine communication. In practice, these changes lower the cost of training by 100x-1000x for comparable workloads.

Brax Environments
Environments are tiny packaged worlds that define a task for an RL agent to learn. Environments contain not only the means to simulate a world, but also functions, such as how to observe the world and the definition of the goal in that world.

A few standard benchmark environments have emerged in recent years for testing new RL algorithms and for evaluating the impact of those algorithms using metrics commonly understood by research scientists. Brax includes four such ready-to-use environments that come from the popular OpenAI gym: Ant, HalfCheetah, Humanoid, and Reacher.


From left to right: Ant, HalfCheetah, Humanoid, and Reacher are popular baseline environments for RL research.

Brax also includes three novel environments: dexterous manipulation of an object (a popular challenge in robotics), generalized locomotion (an agent that goes to a target placed anywhere around it), and a simulation of an industrial robot arm.


Left: Grasp, a claw hand that learns dexterous manipulation. Middle: Fetch, a toy, box-like dog learns a general goal-based locomotion policy. Right: Simulation of UR5e, an industrial robot arm.

Performance Benchmarks
The first step for analyzing Brax’s performance is to measure the speed at which it can simulate large batches of environments, because this is the critical bottleneck to overcome in order for the learner to consume enough experience to learn quickly.

These two graphs below show how many physics steps (updates to the state of the environment) Brax can produce as it is tasked with simulating more and more environments in parallel. The graph on the left shows that Brax scales the number of steps per second linearly with the number of parallel environments, only hitting memory bandwidth bottlenecks at 10,000 environments, which is not only enough for training single agents, but also suitable for training entire populations of agents. The graph on the right shows two things: first, that Brax performs well not only on TPU, but also on high-end GPUs (see the V100 and P100 curves), and second, that by leveraging JAX’s device parallelism primitives, Brax scales seamlessly across multiple devices, reaching hundreds of millions of physics steps per second (see the TPUv3 8x8 curve, which is 64 TPUv3 chips directly connected to each other over a high speed interconnect) .

Left: Scaling of the simulation steps per second for each Brax environment on a 4x2 TPU v3. Right: Scaling of the simulation steps per second for several accelerators on the Ant environment.

Another way to analyze Brax’s performance is to measure its impact on the time it takes to run a reinforcement learning experiment on a single workstation. Here we compare Brax training the popular Ant benchmark environment to its OpenAI counterpart, powered by the MuJoCo physics engine.

In the graph below, the blue line represents a standard workstation setup, where a learner runs on the GPU and the simulator runs on the CPU. We see that the time it takes to train an ant to run with reasonable proficiency (a score of 4000 on the y axis) drops from about 3 hours for the blue line, to about 10 seconds using Brax on accelerator hardware. It’s interesting to note that even on CPU alone (the grey line), Brax performs more than an order of magnitude faster, benefitting from learner and simulator both sitting in the same process.

Brax’s optimized PPO versus a standard GPU-backed PPO learning the MuJoCo-Ant-v2 environment, evaluated for 10 million steps. Note the x-axis is log-wallclock-time in seconds. Shaded region indicates lowest and highest performing seeds over 5 replicas, and solid line indicates mean.

Physics Fidelity
Designing a simulator that matches the behavior of the real world is a known hard problem that this work does not address. Nevertheless, it is useful to compare Brax to a reference simulator to ensure it is producing output that is at least as valid. In this case, we again compare Brax to MuJoCo, which is well-regarded for its simulation quality. We expect to see that, all else being equal, a policy has a similar reward trajectory whether trained in MuJoCo or Brax.

MuJoCo-Ant-v2 vs. Brax Ant, showing the number of environment steps plotted against the average episode score achieved for the environment. Both environments were trained with the same standard implementation of SAC. Shaded region indicates lowest and highest performing seeds over five runs, and solid line indicates the mean.

These curves show that as the reward rises at about the same rate for both simulators, both engines compute physics with a comparable level of complexity or difficulty to solve. And as both curves top out at about the same reward, we have confidence that the same general physical limits apply to agents operating to the best of their ability in either simulation.

We can also measure Brax’s ability to conserve linear momentum, angular momentum, and energy.

Linear momentum (left), angular momentum (middle), and energy (right) non-conservation scaling for Brax as well as several other physics engines. The y-axis indicates drift from the expected calculation (higher is smaller drift, which is better), and the x axis indicates the amount of time being simulated.

This measure of physics simulation quality was first proposed by the authors of MuJoCo as a way to understand how the simulation drifts off course as it is tasked with computing larger and larger time steps. Here, Brax performs similarly as its neighbors.

Conclusion
We invite researchers to perform a more qualitative measure of Brax’s physics fidelity by training their own policies in the Brax Training Colab. The learned trajectories are recognizably similar to those seen in OpenAI Gym.

Our work makes fast, scalable RL and robotics research much more accessible — what was formerly only possible via large compute clusters can now be run on workstations, or for free via hosted Google Colaboratory. Our Github repository includes not only the Brax simulation engine, but also a host of reference RL algorithms for fast training. We can’t wait to see what kind of new research Brax enables.

Acknowledgements
We'd like to thank our paper co-authors: Anton Raichuk, Sertan Girgin, Igor Mordatch, and Olivier Bachem. We also thank Erwin Coumans for advice on building physics engines, Blake Hechtman and James Bradbury for providing optimization help with JAX and XLA, and Luke Metz and Shane Gu for their advice. We’d also like to thank Vijay Sundaram, Wright Bagwell, Matt Leffler, Gavin Dodd, Brad Mckee, and Logan Olson, for helping to incubate this project.


1 Due to the complexity of the real world, there is also ongoing research exploring the physics of deformable bodies

Source: Google AI Blog


Machine Learning for Computer Architecture

One of the key contributors to recent machine learning (ML) advancements is the development of custom accelerators, such as Google TPUs and Edge TPUs, which significantly increase available compute power unlocking various capabilities such as AlphaGo, RankBrain, WaveNets, and Conversational Agents. This increase can lead to improved performance in neural network training and inference, enabling new possibilities in a broad range of applications, such as vision, language, understanding, and self-driving cars.

To sustain these advances, the hardware accelerator ecosystem must continue to innovate in architecture design and acclimate to rapidly evolving ML models and applications. This requires the evaluation of many different accelerator design points, each of which may not only improve the compute power, but also unravel a new capability. These design points are generally parameterized by a variety of hardware and software factors (e.g., memory capacity, number of compute units at different levels, parallelism, interconnection networks, pipelining, software mapping, etc.). This is a daunting optimization task, due to the fact that the search space is exponentially large1 while the objective function (e.g., lower latency and/or higher energy efficiency) is computationally expensive to evaluate through simulations or synthesis, making identification of feasible accelerator configurations challenging .

In “Apollo: Transferable Architecture Exploration”, we present the progress of our research on ML-driven design of custom accelerators. While recent work has demonstrated promising results in leveraging ML to improve the low-level floorplanning process (in which the hardware components are spatially laid out and connected in silicon), in this work we focus on blending ML into the high-level system specification and architectural design stage, a pivotal contributing factor to the overall performance of the chip in which the design elements that control the high-level functionality are established. Our research shows how ML algorithms can facilitate architecture exploration and suggest high-performing architectures across a range of deep neural networks, with domains spanning image classification, object detection, OCR and semantic segmentation.

Architecture Search Space and Workloads
The objective in architecture exploration is to discover a set of feasible accelerator parameters for a set of workloads, such that a desired objective function (e.g., the weighted average of runtime) is minimized under an optional set of user-defined constraints. However, the manifold of architecture search generally contains many points for which there is no feasible mapping from software to hardware. Some of these design points are known a priori and can be bypassed by formulating them as optimization constraints by the user (e.g., in the case of an area budget2 constraint, the total memory size must not pass over a predefined limit). However, due to the interplay of the architecture and compiler and the complexity of the search space, some of the constraints may not be properly formulated into the optimization, and so the compiler may not find a feasible software mapping for the target hardware. These infeasible points are not easy to formulate in the optimization problem, and are generally unknown until the whole compiler pass is performed. As such, one of main challenges for architecture exploration is to effectively sidestep the infeasible points for efficient exploration of the search space with a minimum number of cycle-accurate architecture simulations.

The following figure shows the overall architecture search space of a target ML accelerator. The accelerator contains a 2D array of processing elements (PE), each of which performs a set of arithmetic computations in a single instruction multiple data (SIMD) manner. The main architectural components of each PE are processing cores that include multiple compute lanes for SIMD operations. Each PE has shared memory (PE Memory) across all their compute cores, which is mainly used to store model activations, partial results, and outputs, while individual cores feature memory that is mainly used for storing model parameters. Each core has multiple compute lanes with multi-way multiply-accumulate (MAC) units. The results of model computations at each cycle are either stored back in the PE memory for further computation or are offloaded back into the DRAM.

Overview of the template-based ML accelerator used for architecture exploration.

Optimization Strategies
In this study, we explored four optimization strategies in the context of architecture exploration:

  1. Random:Samples the architecture search space uniformly at random.
  2. Vizier: Uses Bayesian optimization for the exploration in the search space in which the evaluation of the objective function is expensive (e.g. hardware simulation which can take hours to complete). Using a collection of sampled points from the search space, the Bayesian optimization forms a surrogate function, usually represented by a Gaussian process, that approximates the manifold of the search space. Guided by the value of the surrogate function, the Bayesian optimization algorithm decides, in an exploration and exploitation trade-off, whether to sample more from the promising regions in the manifold (exploitation) or sample more from the unseen regions in the search space (exploration). Then, the optimization algorithm uses these newly sampled points and further updates the surrogate function to better model the target search space. Vizier uses expected improvement as its core acquisition function.
  3. Evolutionary: Performs evolutionary search using a population of k individuals, where the genome of each individual corresponds to a sequence of discretized accelerator configurations. New individuals are generated by selecting for each individual two parents from the population using tournament selecting, recombining their genomes with some crossover rate, and mutating the recombined genome with some probability.
  4. Population-based black-box optimization (P3BO): Uses an ensemble of optimization methods, including evolutionary and model-based, which has been shown to increase sample-efficiency and robustness. The sampled data are exchanged between optimization methods in the ensemble, and optimizers are weighted by their performance history to generate new configurations. In our study, we use a variant of P3BO in which the hyper-parameters of the optimizers are dynamically updated using evolutionary search.

Accelerator Search Space Embeddings
To better visualize the effectiveness of each optimization strategy in navigating the accelerator search space, we use t-distributed stochastic neighbor embedding (t-SNE) to map the explored configurations into a two-dimensional space across the optimization horizon. The objective (reward) for all the experiments is defined as the throughput (inference/second) per accelerator area. In the figures below, the x and y axes indicate the t-SNE components (embedding 1 and embedding 2) of the embedding space. The star and circular markers show the infeasible (zero reward) and feasible design points, respectively, with the size of the feasible points corresponding to their reward.

As expected, the random strategy searches the space in a uniformly distributed way and eventually finds very few feasible points in the design space.

Visualization presenting the t-SNE of the explored design points (~4K) by random optimization strategy (max reward = 0.96). The maximum reward points (red cross markers) are highlighted at the last frame of the animation.

Compared to the random sampling approach, the Vizier default optimization strategy strikes a good balance between exploring the search space and finding the design points with higher rewards (1.14 vs. 0.96). However, this approach tends to get stuck in infeasible regions and, while it does find a few points with the maximum reward (indicated by the red cross markers), it finds few feasible points during the last iterations of exploration.

As above, with the Vizier (default) optimization strategy (max reward = 1.14). The maximum reward points (red cross markers) are highlighted at the last frame of the animation.

The evolutionary optimization strategy, on the other hand, finds feasible solutions very early in the optimization and assemble clusters of feasible points around them. As such, this approach mostly navigates the feasible regions (the green circles) and efficiently sidesteps the infeasible points. In addition, the evolutionary search is able to find more design options with maximum reward (the red crosses). This diversity in the solutions with high reward provides flexibility to the designer in exploring various architectures with different design trade-offs.

As above, with the evolutionary optimization strategy (max reward = 1.10). The maximum reward points (red cross markers) are highlighted at the last frame of the animation.

Finally, the population-based optimization method (P3BO) explores the design space in a more targeted way (regions with high reward points) in order to find optimal solutions. The P3BO strategy finds design points with the highest reward in search spaces with tighter constraints (e.g., a larger number of infeasible points), showing its effectiveness in navigating search spaces with large numbers of infeasible points.

As above, with the P3BO optimization strategy (max reward = 1.13). The maximum reward points (red cross markers) are highlighted at the last frame of the animation.

Architecture Exploration under Different Design Constraints
We also studied the benefits of each optimization strategy under different area budget constraints, 6.8 mm2, 5.8 mm2 and 4.8 mm2. The following violin plots show the full distribution of the maximum achievable reward at the end of optimization (after ten runs each with 4K trials) across the studied optimization strategies. The wider sections represent a higher probability of observing feasible architecture configurations at a particular given reward. This implies that we favor the optimization algorithm that yields increased width at the points with higher reward (higher performance).

The two top-performing optimization strategies for architecture exploration are evolutionary and P3BO, both in terms of delivering solutions with high reward and robustness across multiple runs. Looking into different design constraints, we observe that as one tightens the area budget constraint, the P3BO optimization strategy yields more high performing solutions. For example, when the area budget constraint is set to 5.8 mm2, P3BO finds design points with a reward (throughput / accelerator area) of 1.25 outperforming all the other optimization strategies. The same trend is observed when the area budget constraint is set to 4.8 mm2, a slightly better reward is found with more robustness (less variability) across multiple runs.

Violin plot showing the full distribution of the maximum achievable reward in ten runs across the optimization strategies after 4K trial evaluations under an area budget of 6.8 mm2. The P3BO and Evolutionary algorithm yield larger numbers of high-performing designs (wider sections). The x and y axes indicate the studied optimization algorithms and the geometric mean of speedup (reward) over the baseline accelerator, respectively.
As above, under an area budget of 5.8 mm2.
As above, under an area budget of 4.8 mm2.

Conclusion
While Apollo presents the first step towards better understanding of accelerator design space and building more efficient hardware, inventing accelerators with new capabilities is still an uncharted territory and a new frontier. We believe that this research is an exciting path forward to further explore ML-driven techniques for architecture design and co-optimization (e.g., compiler, mapping, and scheduling) across the computing stack to invent efficient accelerators with new capabilities for the next generation of applications.

Acknowledgments
This work was performed by Amir Yazdanbakhsh, Christof Angermueller, and Berkin Akin . We would like to also thank Milad Hashemi, Kevin Swersky, James Laudon, Herman Schmit, Cliff Young, Yanqi Zhou, Albin Jones, Satrajit Chatterjee, Ravi Narayanaswami, Ray (I-Jui) Sung, Suyog Gupta, Kiran Seshadri, Suvinay Subramanian, Matthew Denton, and the Vizier team for their help and support.


1 In our target accelerator, the total number of design points is around 5 x 10⁸

2 The chip area is approximately the sum of total hardware components on the chip, including on-chip storage, processing engines, controllers, I/O pins, and etc.  

Source: Google AI Blog


Massively Large-Scale Distributed Reinforcement Learning with Menger

In the last decade, reinforcement learning (RL) has become one of the most promising research areas in machine learning and has demonstrated great potential for solving sophisticated real-world problems, such as chip placement and resource management, and solving challenging games (e.g., Go, Dota 2, and hide-and-seek). In simplest terms, an RL infrastructure is a loop of data collection and training, where actors explore the environment and collect samples, which are then sent to the learners to train and update the model. Most current RL techniques require many iterations over batches of millions of samples from the environment to learn a target task (e.g., Dota 2 learns from batches of 2 million frames every 2 seconds). As such, an RL infrastructure should not only scale efficiently (e.g., increase the number of actors) and collect an immense number of samples, but also be able to swiftly iterate over these extensive amounts of samples during training.

Overview of an RL system in which an actor sends trajectories (e.g., multiple samples) to a learner. The learner trains a model using the sampled data and pushes the updated model back to the actor (e.g. TF-Agents, IMPALA).

Today we introduce Menger1, a massive large-scale distributed RL infrastructure with localized inference that scales up to several thousand actors across multiple processing clusters (e.g., Borg cells), reducing the overall training time in the task of chip placement. In this post we describe how we implement Menger using Google TPU accelerators for fast training iterations, and present its performance and scalability on the challenging task of chip placement. Menger reduces the training time by up to 8.6x compared to a baseline implementation.

Menger System Design
There are various distributed RL systems, such as Acme and SEED RL, each of which focus on optimizing a single particular design point in the space of distributed reinforcement learning systems. For example, while Acme uses local inference on each actor with frequent model retrieval from the learner, SEED RL benefits from a centralized inference design by allocating a portion of TPU cores for performing batched calls. The tradeoffs between these design points are (1) paying the communication cost of sending/receiving observations and actions to/from a centralized inference server or paying the communication cost of model retrieval from a learner and (2) the cost of inference on actors (e.g., CPUs) compared to accelerators (e.g., TPUs/GPUs). Because of the requirements of our target application (e.g., size of observations, actions, and model size), Menger uses local inference in a manner similar to Acme, but pushes the scalability of actors to virtually an unbounded limit. The main challenges to achieving massive scalability and fast training on accelerators include:

  1. Servicing a large number of read requests from actors to a learner for model retrieval can easily throttle the learner and quickly become a major bottleneck (e.g., significantly increasing the convergence time) as the number of actors increases.
  2. The TPU performance is often limited by the efficiency of the input pipeline in feeding the training data to the TPU compute cores. As the number of TPU compute cores increases (e.g., TPU Pod), the performance of the input pipeline becomes even more critical for the overall training runtime.

Efficient Model Retrieval
To address the first challenge, we introduce transparent and distributed caching components between the learner and the actors optimized in TensorFlow and backed by Reverb (similar approach used in Dota). The main responsibility of the caching components is to strike a balance between the large number of requests from actors and the learner job. Adding these caching components not only significantly reduces the pressure on the learner to service the read requests, but also further distributes the actors across multiple Borg cells with a marginal communication overhead. In our study, we show that for a 16 MB model with 512 actors, the introduced caching components reduce the average read latency by a factor of ~4.0x leading to faster training iterations, especially for on-policy algorithms such as PPO.

Overview of a distributed RL system with multiple actors placed in different Borg cells. Servicing the frequent model update requests from a massive number of actors across different Borg cells throttles the learner and the communication network between learner and actors, which leads to a significant increase in the overall convergence time. The dashed lines represent gRPC communication between different machines.

Overview of a distributed RL system with multiple actors placed in different Borg cells with the introduced transparent and distributed caching service. The learner only sends the updated model to the distributed caching services. Each caching service handles the model request updates from the nearby actors (i.e., actors placed on the same Borg cells) and the caching service. The caching service not only reduces the load on the learner for servicing the model update requests, but also reduces the average read latency by the actors.

High Throughput Input Pipeline
To deliver a high throughput input data pipeline, Menger uses Reverb, a recently open-sourced data storage system designed for machine learning applications that provides an efficient and flexible platform to implement experience replay in a variety of on-policy/off-policy algorithms. However, using a single Reverb replay buffer service does not currently scale well in a distributed RL setting with thousands of actors, and simply becomes inefficient in terms of write throughput from actors.

A distributed RL system with a single replay buffer. Servicing a massive number of write requests from actors throttles the replay buffer and reduces its overall throughput. In addition, as we scale the learner to a setting with multiple compute engines (e.g., TPU Pod), feeding the data to these engines from a single replay buffer service becomes inefficient, which negatively impacts the overall convergence time.

To better understand the efficiency of the replay buffer in a distributed setting, we evaluate the average write latency for various payload sizes from 16 MB to 512 MB and a number of actors ranging from 16 to 2048. We repeat the experiment when the replay buffer and actors are placed on the same Borg cell. As the number of actors grows the average write latency also increases significantly. Expanding the number of actors from 16 to 2048, the average write latency increases by a factor of ~6.2x and ~18.9x for payload size 16 MB and 512 MB, respectively. This increase in the write latency negatively impacts the data collection time and leads to inefficiency in the overall training time.

The average write latency to a single Reverb replay buffer for various payload sizes (16 MB - 512 MB) and various number of actors (16 to 2048) when the actors and replay buffer are placed on the same Borg cells.

To mitigate this, we use the sharding capability provided by Reverb to increase the throughput between actors, learner, and replay buffer services. Sharding balances the write load from the large number of actors across multiple replay buffer servers, instead of throttling a single replay buffer server, and also minimizes the average write latency for each replay buffer server (as fewer actors share the same server). This enables Menger to scale efficiently to thousands of actors across multiple Borg cells.

A distributed RL system with sharded replay buffers. Each replay buffer service is a dedicated data storage for a collection of actors, generally located on the same Borg cells. In addition, the sharded replay buffer configuration provides a higher throughput input pipeline to the accelerator cores.

Case Study: Chip Placement
We studied the benefits of Menger in the complex task of chip placement for a large netlist. Using 512 TPU cores, Menger achieves significant improvements in the training time (up to ~8.6x, reducing the training time from ~8.6 hours down to merely one hour in the fastest configuration) compared to a strong baseline. While Menger was optimized for TPUs, that the key factor for this performance gain is the architecture, and we would expect to see similar gains when tailored to use on GPUs.

The improvement in training time using Menger with variable number of TPU cores compared to a baseline in the task of chip placement.

We believe that Menger infrastructure and its promising results in the intricate task of chip placement demonstrate an innovative path forward to further shorten the chip design cycle and has the potential to not only enable further innovations in the chip design process, but other challenging real-world tasks as well.

Acknowledgments
Most of the work was done by Amir Yazdanbakhsh, Junchaeo Chen, and Yu Zheng. We would like to also thank Robert Ormandi, Ebrahim Songhori, Shen Wang, TF-Agents team, Albin Cassirer, Aviral Kumar, James Laudon, John Wilkes, Joe Jiang, Milad Hashemi, Sat Chatterjee, Piotr Stanczyk, Sabela Ramos, Lasse Espeholt, Marcin Michalski, Sam Fishman, Ruoxin Sang, Azalia Mirhosseini, Anna Goldie, and Eric Johnson for their help and support.


1 A Menger cube is a three-dimensional fractal curve, and the inspiration for the name of this system, given that the proposed infrastructure can virtually scale ad infinitum.

Source: Google AI Blog


Chip Design with Deep Reinforcement Learning


The revolution of modern computing has been largely enabled by remarkable advances in computer systems and hardware. With the slowing of Moore’s Law and Dennard scaling, the world is moving toward specialized hardware to meet the exponentially growing demand for compute. However, today’s chips take years to design, resulting in the need to speculate about how to optimize the next generation of chips for the machine learning (ML) models of 2-5 years from now. Dramatically shortening the chip design cycle would allow hardware to adapt to the rapidly advancing field of ML. What if ML itself could provide the means to shorten the chip design cycle, creating a more integrated relationship between hardware and ML, with each fueling advances in the other?

In “Chip Placement with Deep Reinforcement Learning”, we pose chip placement as a reinforcement learning (RL) problem, where we train an agent (i.e, an RL policy) to optimize the quality of chip placements. Unlike prior methods, our approach has the ability to learn from past experience and improve over time. In particular, as we train over a greater number of chip blocks, our method becomes better at rapidly generating optimized placements for previously unseen chip blocks. Whereas existing baselines require human experts in the loop and take several weeks to generate, our method can generate placements in under six hours that outperform or match their manually designed counterparts. While we show that we can generate optimized placements for Google accelerator chips (TPUs), our methods are applicable to any kind of chip (ASIC).

The Chip Floorplanning Problem
A computer chip is divided into dozens of blocks, each of which is an individual module, such as a memory subsystem, compute unit, or control logic system. These blocks can be described by a netlist, a graph of circuit components, such as macros (memory components) and standard cells (logic gates like NAND, NOR, and XOR), all of which are connected by wires. Determining the layout of a chip block, a process called chip floorplanning, is one of the most complex and time-consuming stages of the chip design process and involves placing the netlist onto a chip canvas (a 2D grid), such that power, performance, and area (PPA) are minimized, while adhering to constraints on density and routing congestion. Despite decades of research on this topic, it is still necessary for human experts to iterate for weeks to produce solutions that meet multi-faceted design criteria. This problem’s complexity arises from the size of the netlist graph (millions to billions of nodes), the granularity of the grid onto which that graph must be placed, and the exorbitant cost of computing the true target metrics, which can take many hours (sometimes over a day) using industry-standard electronic design automation tools.

The Deep Reinforcement Learning Model
The input to our model is the chip netlist (node types and graph adjacency information), the ID of the current node to be placed, and some netlist metadata, such as the total number of wires, macros, and standard cell clusters. The netlist graph and the current node are passed through an edge-based graph neural network that we developed to encode the input state. This generates embeddings of the partially placed graph and the candidate node.
A graph neural network generates embeddings that are concatenated with the metadata embeddings to form the input to the policy and value networks.
The edge, macro and netlist metadata embeddings are then concatenated to form a single state embedding, which is passed to a feedforward neural network. The output of the feedforward network is a learned representation that captures the useful features and serves as input to the policy and value networks. The policy network generates a probability distribution over all possible grid cells onto which the current node could be placed.

In each iteration of training, the macros are sequentially placed by the RL agent, after which the standard cell clusters are placed by a force-directed method, which models the circuit as a system of springs to minimize wirelength. RL training is guided by a fast-but-approximate reward signal calculated for each of the agent’s chip placements using the weighted average of approximate wirelength (i.e., the half-perimeter wirelength, HPWL) and approximate congestion (the fraction of routing resources consumed by the placed netlist).
During each training iteration, the macros are placed by the policy one at a time and the standard cell clusters are placed by a force-directed method. The reward is calculated from the weighted combination of approximate wirelength and congestion.
Results
To our knowledge, this method is the first chip placement approach that has the ability to generalize, meaning that it can leverage what it has learned while placing previous netlists to generate better placements for new unseen netlists. We show that as we increase the number of chip netlists on which we perform pre-training (i.e., as our method becomes more experienced in placement optimization), our policy better generalizes to new netlists.

For example, the pre-trained policy organically identifies an arrangement that places the macros near the edges of the chip with a convex space in the center in which to place the standard cells. This results in lower wirelength between the macros and standard cells without introducing excessive routing congestion. In contrast, the policy trained from scratch starts with random placements and takes much longer to converge to a high-quality solution, rediscovering the need to leave an opening in the center of the chip canvas. This is demonstrated in the animation below.
Macro placements of Ariane, an open-source RISC-V processor, as training progresses. On the left, the policy is being trained from scratch, and on the right, a pre-trained policy is being fine-tuned for this chip. Each rectangle represents an individual macro placement. Notice how the cavity discovered by the from-scratch policy is already present from the outset in the pre-trained policy’s placement.
We observe that pre-training improves sample efficiency and placement quality. We compare the quality of placements generated using pre-trained policies to those generated by training the policy from scratch. To generate placements for previously unseen chip blocks, we use a zero-shot method, meaning that we simply use a pre-trained policy (with no fine-tuning) to place a new block, yielding a placement in less than a second. The results can be further improved by fine-tuning the policy on the new block. The policy trained from scratch takes much longer to converge, and even after 24 hours, its chip placements are worse than what the fine-tuned policy achieves after 12 hours.
Convergence plots for two policies on Ariane blocks. One is training from scratch and the other is finetuning a pre-trained policy.
The performance of our approach improves as we train on a larger dataset. We observed that as we increase the training set from two blocks to five blocks, and then to 20 blocks, the policy generates better placements, both at zero-shot and after being fine-tuned for the same training wall-clock time.
Training data size vs. fine-tuning performance.
The ability of our approach to learn from experience and improve over time unlocks new possibilities for chip designers. As the agent is exposed to a greater volume and variety of chips, it becomes both faster and better at generating optimized placements for new chip blocks. A fast, high-quality, automatic chip placement method could greatly accelerate chip design and enable co-optimization with earlier stages of the chip design process. Although we evaluate primarily on accelerator chips, our proposed method is broadly applicable to any chip placement problem. After all that hardware has done for machine learning, we believe that it is time for machine learning to return the favor.

Acknowledgements
This project was a collaboration between Google Research and Google Hardware and Architecture teams. We would like to thank our coauthors: Mustafa Yazgan, Joe Jiang, Ebrahim Songhori, Shen Wang, Young-Joon Lee, Eric Johnson, Omkar Pathak, Sungmin Bae, Azade Nazi, Jiwoo Pak, Andy Tong, Kavya Srinivasa, William Hang, Emre Tuncer, Anand Babu, Quoc Le, James Laudon, Roger Carpenter, Richard Ho, and Jeff Dean for their support and contributions to this work.

Source: Google AI Blog