Tag Archives: compilers

Faster Rust Toolchains for Android

Posted by Chris Wailes - Senior Software Engineer

The performance, safety, and developer productivity provided by Rust has led to rapid adoption in the Android Platform. Since slower build times are a concern when using Rust, particularly within a massive project like Android, we've worked to ship the fastest version of the Rust toolchain that we can. To do this we leverage multiple forms of profiling and optimization, as well as tuning C/C++, linker, and Rust flags. Much of what I’m about to describe is similar to the build process for the official releases of the Rust toolchain, but tailored for the specific needs of the Android codebase. I hope that this post will be generally informative and, if you are a maintainer of a Rust toolchain, may make your life easier.

Android’s Compilers

While Android is certainly not unique in its need for a performant cross-compiling toolchain this fact, combined with the large number of daily Android build invocations, means that we must carefully balance tradeoffs between the time it takes to build a toolchain, the toolchain’s size, and the produced compiler’s performance.

Our Build Process

To be clear, the optimizations listed below are also present in the versions of rustc that are obtained using rustup. What differentiates the Android toolchain from the official releases, besides the provenance, are the cross-compilation targets available and the codebase used for profiling. All performance numbers listed below are the time it takes to build the Rust components of an Android image and may not be reflective of the speedup when compiling other codebases with our toolchain.

Codegen Units (CGU1)

When Rust compiles a crate it will break it into some number of code generation units. Each independent chunk of code is generated and optimized concurrently and then later re-combined. This approach allows LLVM to process each code generation unit separately and improves compile time but can reduce the performance of the generated code. Some of this performance can be recovered via the use of Link Time Optimization (LTO), but this isn’t guaranteed to achieve the same performance as if the crate were compiled in a single codegen unit.

To expose as many opportunities for optimization as possible and ensure reproducible builds we add the -C codegen-units=1 option to the RUSTFLAGS environment variable. This reduces the size of the toolchain by ~5.5% while increasing performance by ~1.8%.

Be aware that setting this option will slow down the time it takes to build the toolchain by ~2x (measured on our workstations).

GC Sections

Many projects, including the Rust toolchain, have functions, classes, or even entire namespaces that are not needed in certain contexts. The safest and easiest option is to leave these code objects in the final product. This will increase code size and may decrease performance (due to caching and layout issues), but it should never produce a miscompiled or mislinked binary.

It is possible, however, to ask the linker to remove code objects that aren’t transitively referenced from the main()function using the --gc-sections linker argument. The linker can only operate on a section-basis, so, if any object in a section is referenced, the entire section must be retained. This is why it is also common to pass the -ffunction-sections and -fdata-sections options to the compiler or code generation backend. This will ensure that each code object is given an independent section, thus allowing the linker’s garbage collection pass to collect objects individually.

This is one of the first optimizations we implemented and, at the time, it produced significant size savings (on the order of 100s of MiBs). However, most of these gains have been subsumed by those made from setting -C codegen-units=1 when they are used in combination and there is now no difference between the two produced toolchains in size or performance. However, due to the extra overhead, we do not always use CGU1 when building the toolchain. When testing for correctness the final speed of the compiler is less important and, as such, we allow the toolchain to be built with the default number of codegen units. In these situations we still run section GC during linking as it yields some performance and size benefits at a very low cost.

Link-Time Optimization (LTO)

A compiler can only optimize the functions and data it can see. Building a library or executable from independent object files or libraries can speed up compilation but at the cost of optimizations that depend on information that’s only available when the final binary is assembled. Link-Time Optimization gives the compiler another opportunity to analyze and modify the binary during linking.

For the Android Rust toolchain we perform thin LTO on both the C++ code in LLVM and the Rust code that makes up the Rust compiler and tools. Because the IR emitted by our clang might be a different version than the IR emitted by rustc we can’t perform cross-language LTO or statically link against libLLVM. The performance gains from using an LTO optimized shared library are greater than those from using a non-LTO optimized static library however, so we’ve opted to use shared linking.

Using CGU1, GC sections, and LTO produces a speedup of ~7.7% and size improvement of ~5.4% over the baseline. This works out to a speedup of ~6% over the previous stage in the pipeline due solely to LTO.

Profile-Guided Optimization (PGO)

Command line arguments, environment variables, and the contents of files can all influence how a program executes. Some blocks of code might be used frequently while other branches and functions may only be used when an error occurs. By profiling an application as it executes we can collect data on how often these code blocks are executed. This data can then be used to guide optimizations when recompiling the program.

We use instrumented binaries to collect profiles from both building the Rust toolchain itself and from building the Rust components of Android images for x86_64, aarch64, and riscv64. These four profiles are then combined and the toolchain is recompiled with profile-guided optimizations.

As a result, the toolchain achieves a ~19.8% speedup and 5.3% reduction in size over the baseline compiler. This is a 13.2% speedup over the previous stage in the compiler.

BOLT: Binary Optimization and Layout Tool

Even with LTO enabled the linker is still in control of the layout of the final binary. Because it isn’t being guided by any profiling information the linker might accidentally place a function that is frequently called (hot) next to a function that is rarely called (cold). When the hot function is later called all functions on the same memory page will be loaded. The cold functions are now taking up space that could be allocated to other hot functions, thus forcing the additional pages that do contain these functions to be loaded.

BOLT mitigates this problem by using an additional set of layout-focused profiling information to re-organize functions and data. For the purposes of speeding up rustc we profiled libLLVM, libstd, and librustc_driver, which are the compiler’s main dependencies. These libraries are then BOLT optimized using the following options:

--peepholes=all
--data=<path-to-profile>
--reorder-blocks=ext-tsp
–-reorder-functions=hfsort
--split-functions
--split-all-cold
--split-eh
--dyno-stats

Any additional libraries matching lib/*.so are optimized without profiles using only --peepholes=all.

Applying BOLT to our toolchain produces a speedup over the baseline compiler of ~24.7% at a size increase of ~10.9%. This is a speedup of ~6.1% over the PGOed compiler without BOLT.

If you are interested in using BOLT in your own project/build I offer these two bits of advice: 1) you’ll need to emit additional relocation information into your binaries using the -Wl,--emit-relocs linker argument and 2) use the same input library when invoking BOLT to produce the instrumented and the optimized versions.

Conclusion

Graph of normalized size and duration comparison between Toolchain size and Android Rust build time

Optimizations

Speedup vs Baseline
Monolithic 1.8%
Mono + GC Sections

1.9%
Mono + GC + LTO 7.7%
Mono + GC + LTO + PGO 19.8%

Mono + GC + LTO + PGO + BOLT

24.7%

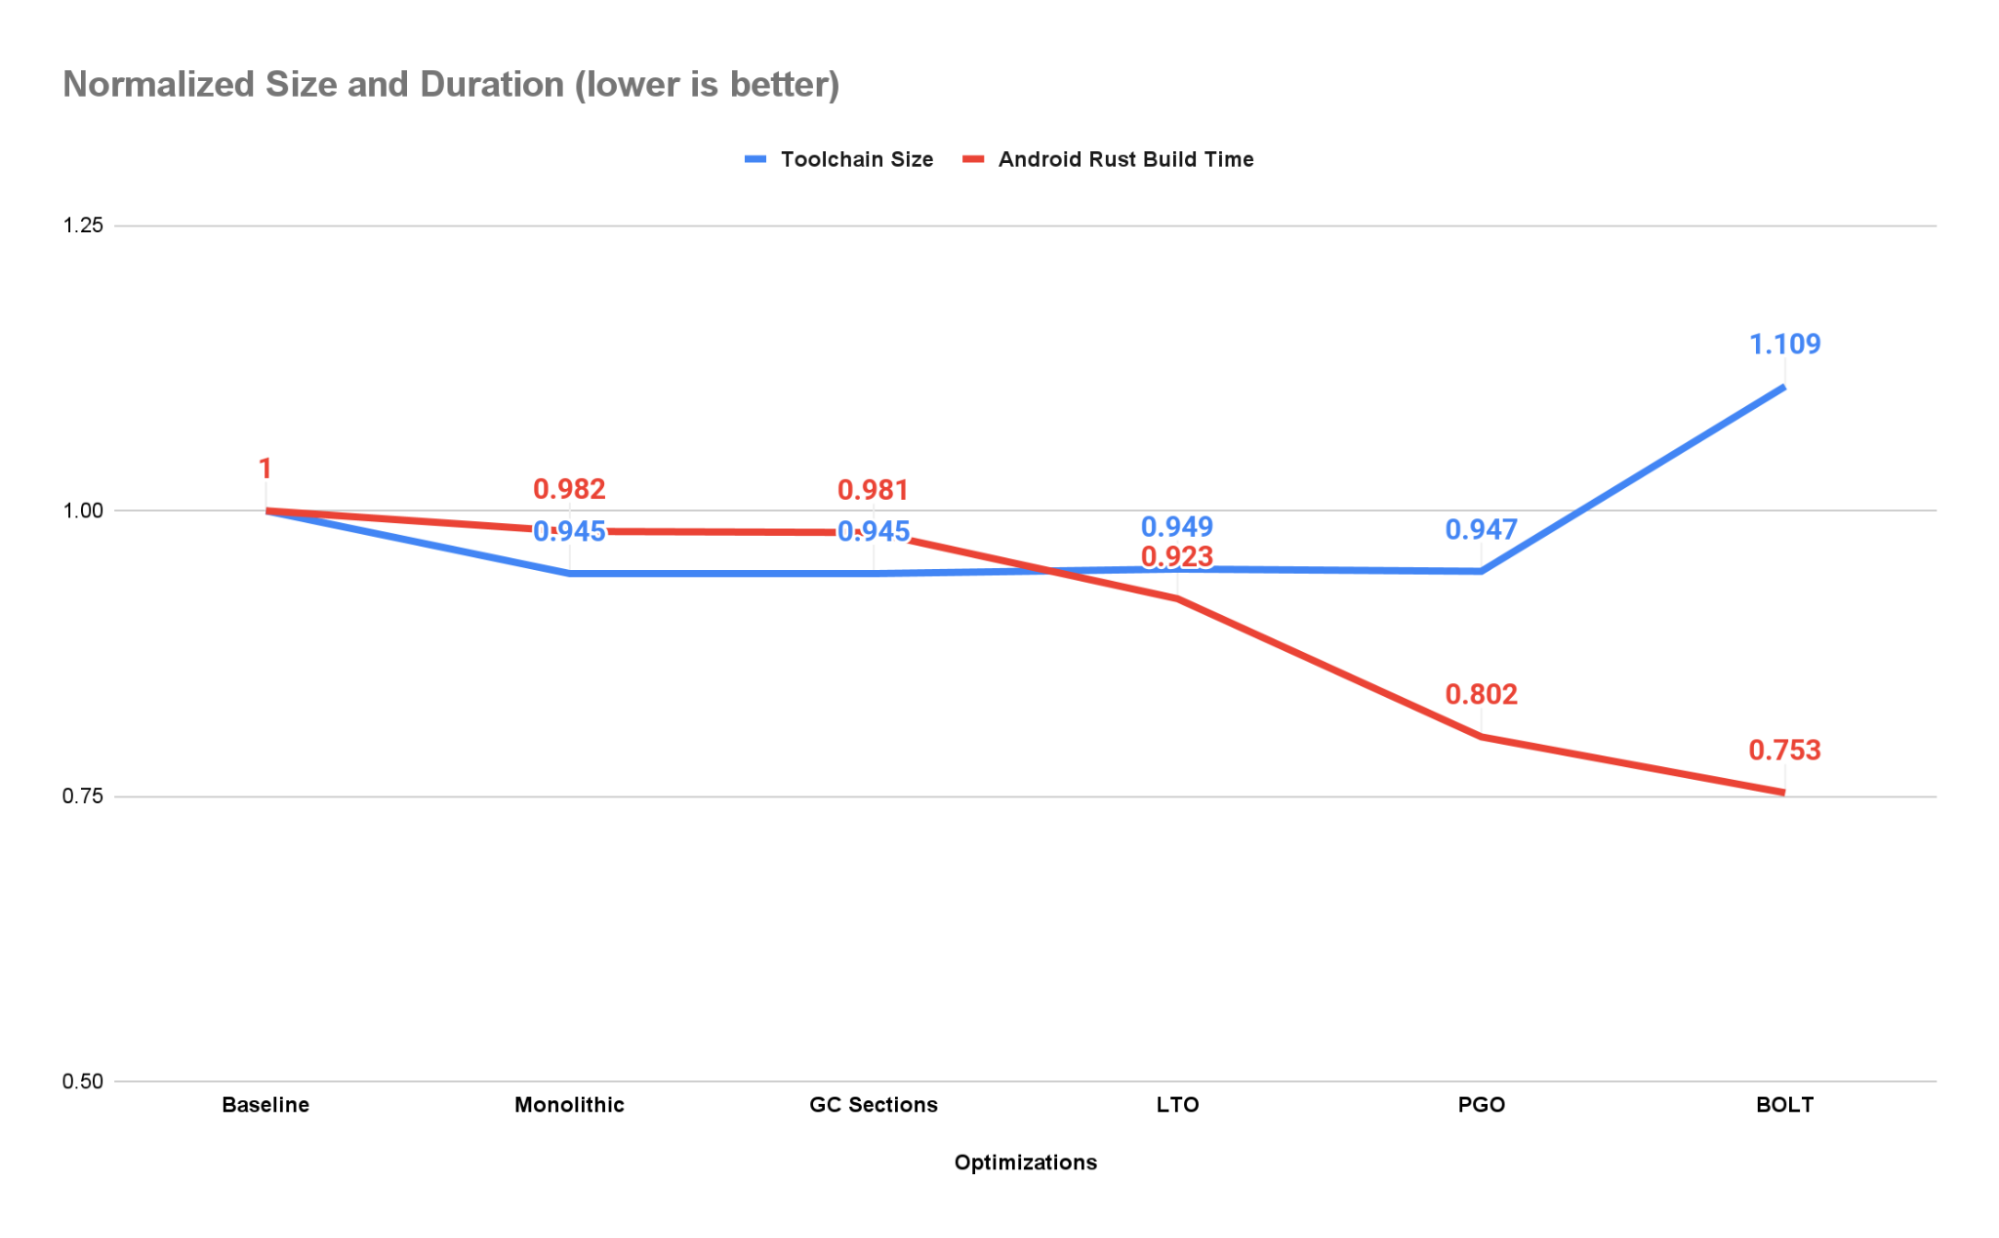
By compiling as a single code generation unit, garbage collecting our data objects, performing both link-time and profile-guided optimizations, and leveraging the BOLT tool we were able to speed up the time it takes to compile the Rust components of Android by 24.8%. For every 50k Android builds per day run in our CI infrastructure we save ~10K hours of serial execution.

Our industry is not one to stand still and there will surely be another tool and another set of profiles in need of collecting in the near future. Until then we’ll continue making incremental improvements in search of additional performance. Happy coding!

PJRT: Simplifying ML Hardware and Framework Integration

Infrastructure fragmentation in Machine Learning (ML) across frameworks, compilers, and runtimes makes developing new hardware and toolchains challenging. This inhibits the industry’s ability to quickly productionize ML-driven advancements. To simplify the growing complexity of ML workload execution across hardware and frameworks, we are excited to introduce PJRT and open source it as part of the recently available OpenXLA Project.

PJRT (used in conjunction with OpenXLA’s StableHLO) provides a hardware- and framework-independent interface for compilers and runtimes. It simplifies the integration of hardware with frameworks, accelerating framework coverage for the hardware, and thus hardware targetability for workload execution.

PJRT is the primary interface for TensorFlow and JAX and fully supported for PyTorch, and is well integrated with the OpenXLA ecosystem to execute workloads on TPU, GPU, and CPU. It is also the default runtime execution path for most of Google’s internal production workloads. The toolchain-independent architecture of PJRT allows it to be leveraged by any hardware, framework, or compiler, with extensibility for unique features. With this open-source release, we're excited to allow anyone to begin leveraging PJRT for their own devices.

If you’re developing an ML hardware accelerator or developing your own compiler and runtime, check out the PJRT source code on GitHub and sign up for the OpenXLA mailing list to quickly bootstrap your work.

Vision: Simplifying ML Hardware and Framework Integration

We are entering a world of ambient experiences where intelligent apps and devices surround us, from edge to the cloud, in a range of environments and scales. ML workload execution currently supports a combinatorial matrix of hardware, frameworks, and workflows, mostly through tight vertical integrations. Examples of such vertical integrations include specific kernels for TPU versus GPU, specific toolchains to train and serve in TensorFlow versus PyTorch. These bespoke 1:1 integrations are perfectly valid solutions but promote lock-in, inhibit innovation, and are expensive to maintain. This problem of a fragmented software stack is compounded over time as different computing hardware needs to be supported.

A variety of ML hardware exists today and hardware diversity is expected to increase in the future. ML users have options and they want to exercise them seamlessly: users want to train a large language model (LLM) on TPU in the Cloud, batch infer on GPU or even CPU, distill, quantize, and finally serve them on mobile processors. Our goal is to solve the challenge of making ML workloads portable across hardware by making it easy to integrate the hardware into the ML infrastructure (framework, compiler, runtime).

Portability: Seamless Execution

The workflow to enable this vision with PJRT is as follows (shown in Figure 1):

  1. The hardware-specific compiler and runtime provider implement the PJRT API, package it as a plugin containing the compiler and runtime hooks, and register it with the frameworks. The implementation can be opaque to the frameworks.
  2. The frameworks discover and load one or multiple PJRT plugins as dynamic libraries targeting the hardware on which to execute the workload.
  3. That’s it! Execute the workload from the framework onto the target hardware.

The PJRT API will be backward compatible. The plugin would not need to change often and would be able to do version-checking for features.

Diagram of PJRT architecture
Figure 1: To target specific hardware, provide an implementation of the PJRT API to package a compiler and runtime plugin that can be called by the framework.

Cohesive Ecosystem

As a foundational pillar of the OpenXLA Project, PJRT is well-integrated with projects within the OpenXLA Project including StableHLO and the OpenXLA compilers (XLA, IREE). It is the primary interface for TensorFlow and JAX and fully supported for PyTorch through PyTorch/XLA. It provides the hardware interface layer in solving the combinatorial framework x hardware ML infrastructure fragmentation (see Figure 2).

Diagram of PJRT hardware interface layer
Figure 2: PJRT provides the hardware interface layer in solving the combinatorial framework x hardware ML infrastructure fragmentation, well-integrated with OpenXLA.

Toolchain Independent

PJRT is hardware and framework independent. With framework integration through the self-contained IR StableHLO, PJRT is not coupled with a specific compiler, and can be used outside of the OpenXLA ecosystem, including with other proprietary compilers. The public availability and toolchain-independent architecture allows it to be used by any hardware, framework or compiler, with extensibility for unique features. If you are developing an ML hardware accelerator, compiler, or runtime targeting any hardware, or converging siloed toolchains to solve infrastructure fragmentation, PJRT can minimize bespoke hardware and framework integration, providing greater coverage and improving time-to-market at lower development cost.

Driving Impact with Collaboration

Industry partners such as Intel and others have already adopted PJRT.

Intel

Intel is leveraging PJRT in Intel® Extension for TensorFlow to provide the Intel GPU backend for TensorFlow and JAX. This implementation is based on the PJRT plugin mechanism (see RFC). Check out how this greatly simplifies the framework and hardware integration with this example of executing a JAX program on Intel GPU.

"At Intel, we share Google's vision of modular interfaces to make integration easier and enable faster, framework-independent development. Similar in design to the PluggableDevice mechanism, PJRT is a pluggable interface that allows us to easily compile and execute XLA's High Level Operations on Intel devices. Its simple design allowed us to quickly integrate it into our systems and start running JAX workloads on Intel® GPUs within just a few months. PJRT enables us to more efficiently deliver hardware acceleration and oneAPI-powered AI software optimizations to developers using a wide range of AI Frameworks." - Wei Li, VP and GM, Artificial Intelligence and Analytics, Intel.

Technology Leader

We’re also working with a technology leader to leverage PJRT to provide the backend targeting their proprietary processor for JAX. More details on this to follow soon.

Get Involved

PJRT is available on GitHub: source code for the API and a reference openxla-pjrt-plugin, and integration guides. If you develop ML frameworks, compilers, or runtimes, or are interested in improving portability of workloads across hardware, we want your feedback. We encourage you to contribute code, design ideas, and feature suggestions. We also invite you to join the OpenXLA mailing list to stay updated with the latest product and community announcements and to help shape the future of an interoperable ML infrastructure.

Acknowledgements

Allen Hutchison, Andrew Leaver, Chuanhao Zhuge, Jack Cao, Jacques Pienaar, Jieying Luo, Penporn Koanantakool, Peter Hawkins, Robert Hundt, Russell Power, Sagarika Chalasani, Skye Wanderman-Milne, Stella Laurenzo, Will Cromar, Xiao Yu.

By Aman Verma, Product Manager, Machine Learning Infrastructure

The cpu_features library

Originally posted by Guillaume Chatelet from the Google Compiler Research Team on the Google Open Source Blog

"Write Once, Run Anywhere." That was the promise of Java back in the 1990s. You could write your Java code on one platform, and it would run on any CPU implementing a Java Virtual Machine.

Copyright Andrew Dunn, licensed CC-BY-SA-2.0

But for developers who need to squeeze every bit of performance out of their applications, that's not enough. Since the dawn of computing, performance-minded programmers have used insights about hardware to fine tune their code.

Let's say you're working on code for which speed is paramount, perhaps a new video codec or a library to process tensors. There are individual instructions that will dramatically improve performance, like fused multiply-add, as well as entire instruction sets like SSE2 and AVX, that can give the critical portions of your code a speed boost.

Here's the problem: there's no way to know a priori which instructions your CPU supports. Identifying the CPU manufacturer isn't sufficient. For instance, Intel's Haswell architecture supports the AVX2 instruction set, while Sandy Bridge doesn't. Some developers resort to desperate measures like reading /proc/cpuinfo to identify the CPU and then consulting hardcoded mappings of CPU IDs to instructions.

Enter cpu_features, a small, fast, and simple open source library to report CPU features at runtime. Written in C99 for maximum portability, it allocates no memory and is suitable for implementing fundamental functions and running in sandboxed environments.

The library currently supports x86, ARM/AArch64, and MIPS processors, and we'll be adding to it as the need arises. We also welcome contributions from others interested in making programs "write once, run fast everywhere."

The cpu_features library

"Write Once, Run Anywhere." That was the promise of Java back in the 1990s. You could write your Java code on one platform, and it would run on any CPU implementing a Java Virtual Machine.

But for developers who need to squeeze every bit of performance out of their applications, that's not enough. Since the dawn of computing, performance-minded programmers have used insights about hardware to fine tune their code.

Let's say you're working on code for which speed is paramount, perhaps a new video codec or a library to process tensors. There are individual instructions that will dramatically improve performance, like fused multiply-add, as well as entire instruction sets like SSE2 and AVX, that can give the critical portions of your code a speed boost.
Photo by Andrew Dunn, licensed CC-BY-SA-2.0.

Here's the problem: there's no way to know a priori which instructions your CPU supports. Identifying the CPU manufacturer isn't sufficient. For instance, Intel’s Haswell architecture supports the AVX2 instruction set, while Sandy Bridge doesn't. Some developers resort to desperate measures like reading /proc/cpuinfo to identify the CPU and then consulting hardcoded mappings of CPU IDs to instructions.

Enter cpu_features, a small, fast, and simple open source library to report CPU features at runtime. Written in C89 for maximum portability, it allocates no memory and is suitable for implementing fundamental functions and running in sandboxed environments.

The library currently supports x86, ARM/AArch64, and MIPS processors, and we'll be adding to it as the need arises. We also welcome contributions from others interested in making programs “write once, run fast everywhere.”

By Guillaume Chatelet, Google Compiler Research Team