Tag Archives: Android Vitals

NordVPN boosted the speed of its login user flow by 60% using Baseline Profiles

Posted by Ben Weiss, Senior Developer Relations Engineer

NordVPN is a virtual private network (VPN) app that protects users while they’re browsing the web by providing them a more secure and private connection. As a network utility, NordVPN’s users deserve a responsive UI, allowing them to set up their protections at a moment’s notice. That's why NordVPN developers recently integrated Baseline Profiles, a profile-guided optimization that helps Android developers improve an app's startup and runtime performance using ahead-of-time compilation.

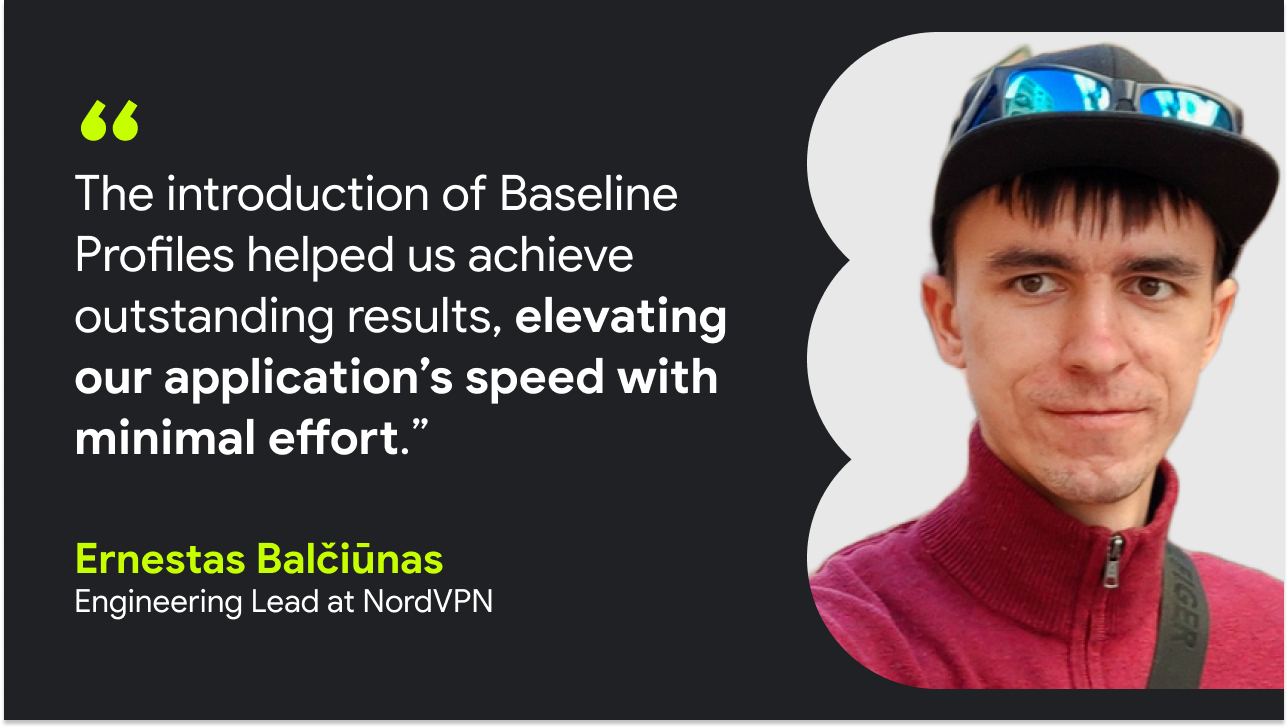
Improving performance with Baseline profiles

As part of its product roadmap for 2023, the NordVPN team wanted to boost the application’s performance. Before implementing Baseline Profiles, NordVPN’s startup times on Android devices didn’t meet the team’s standards, prompting them to examine new ways to make the app run better.

After exploring ways to improve its runtime performance and streamline the login process for users, NordVPN developers identified an opportunity to make the app faster using Baseline Profiles. Baseline Profiles lets the Android Runtime (ART) know which code paths to optimize through Ahead-of-Time (AOT) compilation before an app launches, boosting speed, stability, and overall responsiveness during startup, when navigating through the app, and while viewing content.

“App speed and stability are essential for a better user experience, so we’re always looking for new ways to improve NordVPN’s performance,” said Himanshu Singh, senior Android engineer at NordVPN. “We wanted to speed up the app’s load time and make launch and navigation faster than ever.”

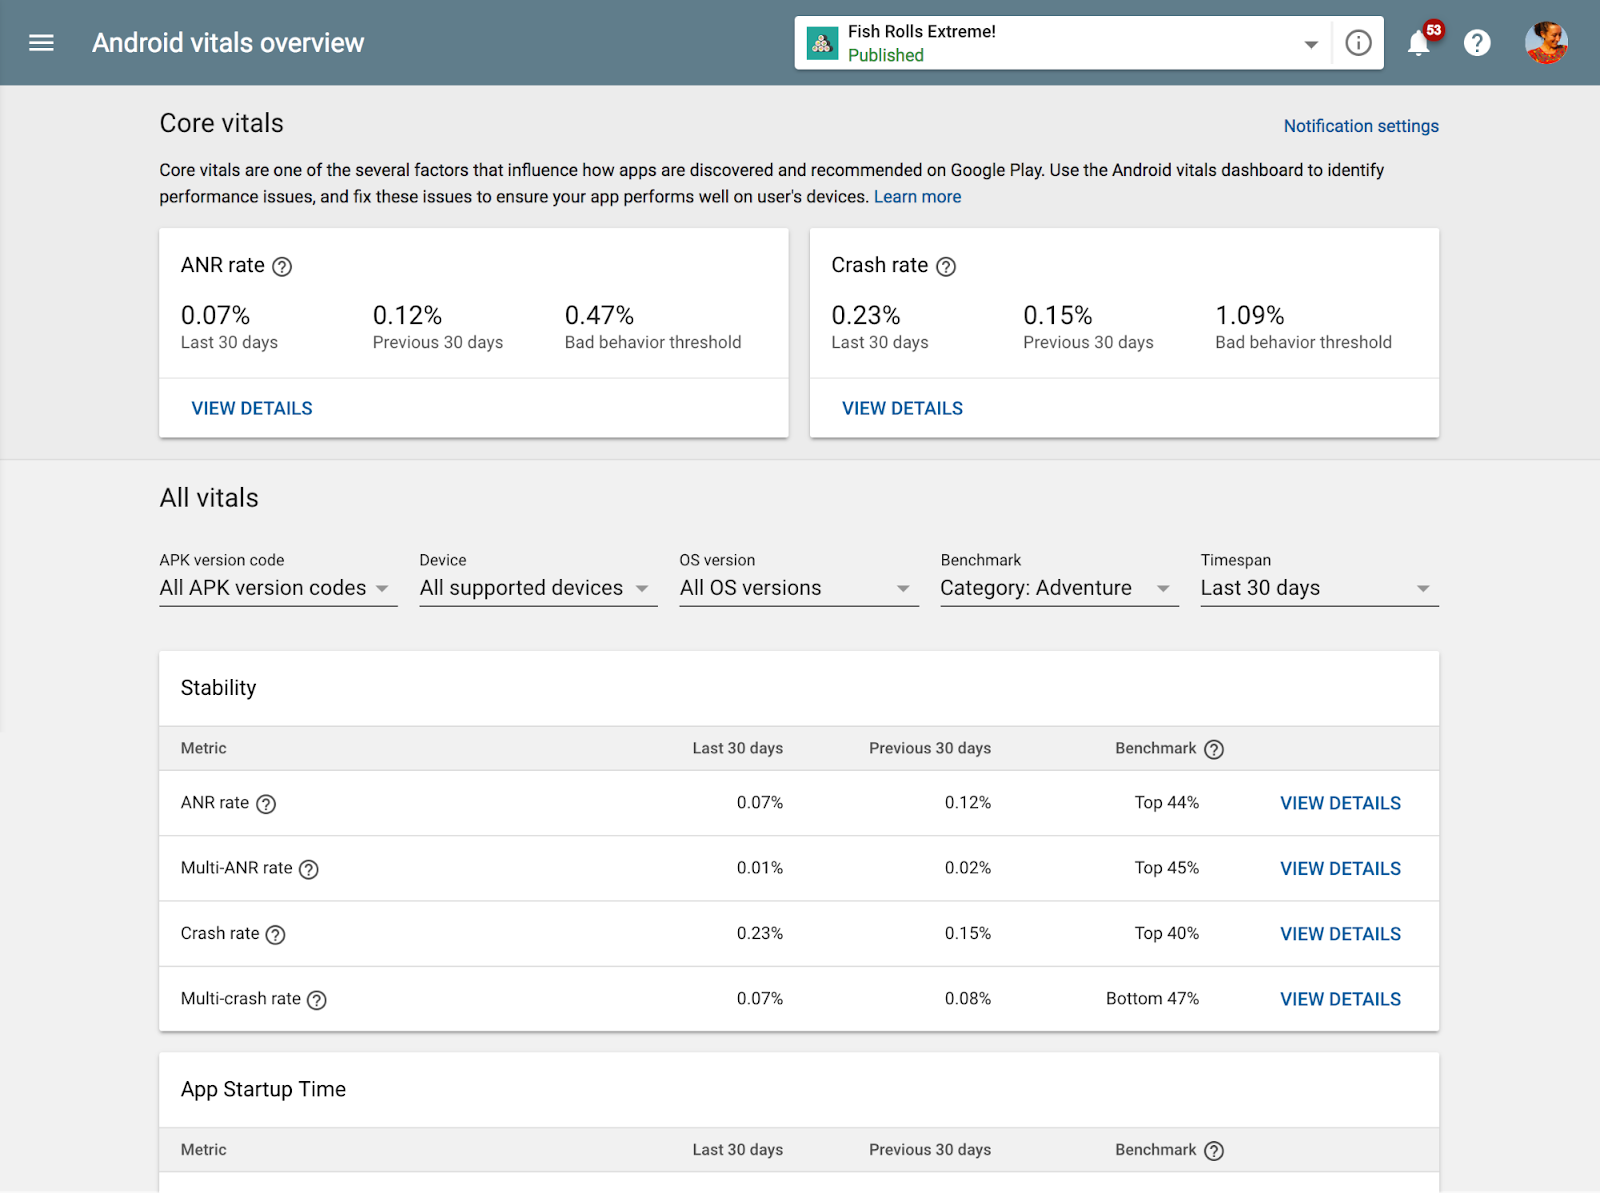
By applying Baseline Profiles, NordVPN improved its launch speed by an average of 24%. Using tools like Android Vitals, the NordVPN team measured that it had reduced the application’s cold start time from 4.3 seconds to 3.2 seconds, the warm start time from 2.7 seconds to 1.8 seconds, and the hot start time from 1 second to 0.7 seconds.

After implementation, NordVPN developers' also noticed that Baseline Profiles made it faster for users to login to the app, improving the user login flow. The login flow is measured from when a user starts an app to when a user is logged into it. Using the Macrobenchmark library to monitor the improvements, the team observed that the NordVPN app runs its login flow 60% faster than before.

A black quote card featuring a headshot if Ernestas on the right with text in white that reads “The introduction of Baseline Profiles helped us achieve outstanding results, elevating our application’s speed with minimal effort.” — Ernestas Balčiūnas, engineering lead at NordVPN

Integrating and testing Baseline Profiles is easy

The ease of implementing Baseline Profiles impressed NordVPN developers. The available resources, in-depth documentation, and codelabs from Android allowed them to enhance the app’s UX without having to write an extensive amount of code themselves.

Using the Macrobenchmark library, NordVPN developers quickly generated Baseline Profiles for the application. To do this, they used a Gradle managed device, which enabled them to create new profiles without a physical device. Using a Gradle Managed Device also allowed NordVPN developers to create fresh profiles for each app release build on their Continuous Integration platform. Looking forward, NordVPN developers plan to migrate Baseline Profile generation to the official Gradle plugin, which will further automate profile generation.

NordVPN developers combined development workflows to create an integration pipeline, allowing them to test the app under various conditions. Then, the Macrobenchmark library ran Baseline generation tests, pushing the latest Baseline Profiles into the code base.

A black Quote card featuring droid on the right side and a green half oval overlay on the left with white text that reads, 'Applying Baseline Profiles in the NordVPN application led to a 29% improvement to overall in-app speed.'

A quick boost to app quality

After integrating Baseline Profiles into NordVPN’s code, its developers saw immediate speed improvements. The engineering team assessed the app’s overall speed after finishing the project and found that, beyond improving the app’s launch times, applying Baseline Profiles led to a 29% improvement to overall in-app speed.

"We’re constantly working to improve app quality, and Baseline Profiles integration has proven to be one of the most successful steps we’ve taken,” said Šarūnas Rimša, product owner at NordVPN. “We’re helping users access the services they’re entitled to faster. What's not to like?"

Get started

Learn how you can improve your app’s performance using Baseline Profiles.

Performance insights for Games, powered by Android Performance Tuner

Posted by Dan Galpin, Developer Advocate

Android vitals is the destination for managing your app's technical quality. Over 80,000 developers take advantage of its performance and stability metrics every month.

As part of our work to help you deliver better game experiences to more Android users, we're introducing Android Performance Tuner - a new library in the Android Game SDK that unlocks game performance insights in Android Vitals. This gives you a scalable way to measure and optimize your frame rate and graphical fidelity across the whole Android device ecosystem.

Unity Boat Attack Sample with Different Optimizations

Unity Boat Attack Sample with Different Optimizations

Once you have integrated Android Performance Tuner into your game and published it on Play, you'll be able to see how it performs across real users and devices with the following new features in Android vitals.

Frame rate performance

Frame Rate Performance by Quality Level and Device Model

Frame Rate Performance by Quality Level and Device Model

We chart the frame time distribution across your users’ devices, broken down by quality levels that you have implemented in your game, so you can see how specific device models or hardware specifications are performing on each quality level.

Performance issues

We also analyze your performance data to help determine the likely cause of issues, so you can differentiate between problems associated with specific hardware and problems with specific screens or levels in your game. You annotate your code to give contextual information about what your game is doing at that point. This gives you full control over the granularity of the insights.

Top Device Model/Annotation Issues

Top Device Model/Annotation Issues

We call out the top device model issue as well as the top game-specific issue to give you clear guidance on what's most important.

Underperforming Device Models by GPU

Underperforming Device Models by GPU

You can drill down to see a breakdown of underperforming device models by different specs, such as GPU and SoC. This allows you to decide whether you can work at the GPU or SoC-level to optimize performance. Alternatively, you may decide to change quality levels, rather than work at the device model level.

Device Model Impact, User Impact, GPU time

Device Model Impact, User Impact, GPU Time

You can also see the full list of device models, along with the number of affected user sessions and frame time, to help you prioritize device-specific changes. As well as total frame time, we also show you GPU time to help determine whether the device is GPU bound or has another performance problem, such as being CPU or I/O bound. All data in the device model table can be exported for further analysis and action planning.

Opportunities to make a good experience great

We can also help identify opportunities — places where you could potentially provide users with a better experience by giving them a higher quality level, enabling more advanced graphical features. Frame Time Performance with Opportunities

Frame Time Performance with Opportunities

The devices on the far left are more than meeting the frame times for smooth performance. You can drill down to see stats by device model and specification to see if there is an opportunity to improve the graphical fidelity across a wide range of devices.

Available (almost) everywhere

The Android Performance Tuner is intended to work across over 99% of the Android device ecosystem. You can get these insights on any Android devices around the world, from Android 4.1 (API 16) onwards.

Integrating Android Performance Tuner

Whether you have your own game engine or are using a third-party game engine, we're doing our best to make integration easy. The Android Performance Tuner relies on tick functions being called each frame. Within the library, this tick information is aggregated into histograms, which are periodically uploaded through an HTTP endpoint, so your game will need to have the internet access permission.

With our plugin for the Unity platform, you can collect frame ticks from Unity 2017.4 onwards. Unity 2019.3.14+ enables the collection of higher-fidelity performance information.

If you're doing a native source code level engine integration, we strongly recommend integrating the Frame Pacing API from the Android Game SDK to get the highest quality information. The Frame Pacing API will give you smoother frame rates and improved support for high-refresh rate displays, so it's worth integrating on its own.

Unreal 4.25+ integrates the Frame Pacing API. You enable it by adding a.UseSwappyForFramePacing=1 to the Android_Default profile to activate it for all Android devices.

Within Unreal or your native engine integration, you pass in the Swappy_injectTracer function from the Frame Pacing API at initialization to enable automatic frame time recording.

void InitTf(JNIEnv* env, jobject activity) {
   SwappyGL_init(env, activity);
   swappy_enabled = SwappyGL_isEnabled();
   TFSettings settings {};
   if (swappy_enabled) {
       settings.swappy_tracer_fn = &SwappyGL_injectTracer;
   }
…
}

Enabling Frame Time Recording in the Android Performance Tuner for your Engine

In Unity, we recommend activating Optimized Frame Pacing within the Unity settings (Unity 2019.3+ only), but Frame Pacing isn't required in Unity to use the Android Performance Tuner.

Activating Optimized Frame Pacing in Unity 2019.3

Activating Optimized Frame Pacing in Unity 2019.3

Providing contextual information

Next, you want to define annotations to give contextual information about what your game is doing when a tick is recorded, such as:

  • Current game level
  • Loading a specific scene
  • A "big boss" or other complex rendered item is on the screen
  • Relevant game state information

Annotation Parameters

If you're using Unity with the Android Performance Tuner plugin, you'll automatically get a scene annotation that maps to the current scene being played. The LoadingState annotation can be easily hooked up to your scripts, and you can define additional annotations within the plugin editor UI.

Annotation Parameters within the Unity Editor from the Android Performance Tuner Plugin

Annotation Parameters within the Unity Editor from the Android Performance Tuner Plugin

To pass annotation parameters from within your own game engine, you define a protocol buffer message that contains all of these annotations, such as loading state, level or scene, etc.

Fidelity Parameters and Quality Levels

You also define fidelity parameters and associate them with quality levels that your game reports back. These can be used for anything that you use in your game to reduce the complexity of the scene, such as texture quality, draw distance, particle count, post-processing effects, shadow resolution, etc. In the native integration, you define these parameters using a protocol buffer.

import "tuningfork.proto"
message FidelityParams {
  int32 texture_quality_level = 1;
  int32 shadow_resolution = 2;
  float terrain_details_percent = 3;
  int32 post_processing_effects_level = 4;
}

Example FidelityParams Proto Definition for an In-house Engine

Then, you create up to fifteen sets of quality levels as a set of values defined by the FidelityParams message, which allows the Android Performance Tuner to track its metrics against your quality data. You can create both fidelity parameters and quality levels in the Unity editor interface provided by the Android Performance Tuner for Unity plugin.

Testing your integration

We've created the Tuning Fork Monitor app to act as a local server and display data from an Android Performance Tuner-enabled app. You can call EnableLocalEndpoint() in the Android Performance Tuner Unity plugin on a development build to enable local testing. In your native integration, you set the endpoint_uri_override in the Android Performance Tuner settings.

Once local tests look great, you then enable the Android Performance Parameters API in the Google Cloud Console to test end-to-end.

Available Now

We're committed to helping you bring the best version of your game to the widest number of users and devices in the Android ecosystem. Android Performance Tuner within the Android Game SDK, the Unity plugin, and Performance Insights within Android Vitals are all available now. You can refer to our documentation for a walk through of the process for native and Unity integrations.

Wrapping up for 2018 with Google Play and Android

Posted by Patricia Correa, Platforms & Ecosystems

Earlier this year we highlighted some of Google Play's milestones and commitments in supporting the 1M+ developers on the Play Store, as well as those of you working on Android apps and games and looking to launch and grow your business on our platforms. We have been inspired and humbled by the achievements of app and game developers, building experiences that delight and help people everywhere, as some stories highlighted in #IMakeApps.

We continue to focus on helping you grow thriving businesses and building tools and resources to help you reach and engage more users in more places, whilst ensuring a safe and secure ecosystem. Looking to 2019, we are excited about all the things to come and seeing more developers adopt new features and update to Android P.

In the meantime let's share some of the 2018 highlights on Google Play and Android:

Building for the future

Along with Android P we have continued to help the Android developer ecosystem, launching Android Jetpack, the latest Android Studio, and Kotlin support. Developers are also now able to add rich and dynamic UI templates with Slices in places such as Google Search and Assistant, APIs for new screens support, and much more. Discover the latest from Android 9, API Level 28.

Smaller apps have higher conversion rates and our research shows that a large app size is a key driver of uninstalls. At I/O we launched a new publishing format, the Android App Bundle, helping developers to deliver smaller and more efficient apps with a simplified release process, and with features on demand - saving on average 35% in download size! On devices using Android M and above, app bundles can reduce app size even further, by automatically supporting uncompressed native libraries, thereby eliminating duplication on devices.

You can build app bundles in the Android Studio 3.2 stable release and in Unity 2018.3 beta, and upload larger bundles with installed APK sizes of up to 500MB without using expansion files, through an early access feature soon to be available to all developers.

Richer experiences and discovery

Discovery of your apps and games is important, so we launched Google Play Instant and increased the size limit to 10MB to enable TRY NOW on the Play Store, and removed the URL requirement for Instant apps. Android Studio 3.3 beta release, lets you publish a single app bundle and classify it or a particular module to be instant enabled (without maintaining separate code).

For game developers, Unity introduced the Google Play Instant plug-in and instant app support is built into the new Cocos Creator. Our app pre-registration program, has seen nearly 250 million app pre-registrations, helping drive app downloads through richer discovery.

Optimizing for quality and performance

Android vitals are now more actionable, with a dashboard highlighting core vitals, peer benchmarks, start-up time and permission denials vitals, anomaly detection and alerts, and linking pre-launch reports - all so that you can better optimize and prioritize issues for improved quality and performance.

There are more opportunities to get feedback and fix issues before launch. The Google Play Console expanded the functionality of automated device testing with a pre-launch report for games, and the launch of the internal and closed test tracks lets you push your app to up to 100 internal testers, before releasing them to production.

Insights for your business, now and in the long term

Metrics are critical to optimize your business and we've added new customizable tools in the Play Console, with downloadable reports to help you evaluate core metrics. Including cumulative data, 30-day rolling averages, and roll-ups for different time periods to better match the cadence of your business.

You can now configure the statistics report to show how your instant apps are performing, analyze different dimensions and identify how many install the final app on their device. The acquisition report shows users discovery journey through to conversion - with average revenue per user and retention benchmarks against similar apps. You can also find the best performing search terms for your store listing with organic breakdown - helping to optimize efforts to grow and retain a valuable audience.

Increasingly developers are adopting subscriptions as their core monetization model. The dedicated new subscriptions center means you can easily change subscription prices, offer partial refunds for in-app products and subscriptions, and also make plan changes in Play Billing Library version 1.2. Learn how to keep subscribers engaged; users can pause plans, giving you more control with order management and the cancellation survey.

Discover how to use all the new features and best practices on the Academy for App Success, our interactive free e-learning platform, offering bite-sized courses that help you make the most of Play Console and improve your app quality.

Make sure you follow @googleplaydev and sign up to our newsletter to stay ahead of all our updates in 2019! We hope these features and tools will enable us to continue a successful partnership with you in the New Year - follow our countdown for a daily highlight. From all of us at Google Play - happy holidays.

How useful did you find this blog post?

Playtime 2017: Find success on Google Play and grow your business with new Play Console features


Posted by Vineet Buch, Director of Product Management, Google Play Apps & Games
Today we kicked off our annual global Playtime series with back-to-back events in Berlin and San Francisco. Over the next month, we’ll be hearing from many app and game developers in cities around the world. It has been an amazing 2017 for developers on Google Play, there are now more than 8 billion new installs per month globally.

To help you continue to take advantage of this opportunity, we're announcing innovations on Google Play and new features in the Play Console. Follow us on Medium where presenters will be posting their strategies, best practices, and examples to help you achieve your business objectives. As Google Play continues to grow rapidly, we want to help people understand our business. That's why we're also publishing the State of Play 2017 report that will be updated annually to help you stay informed about our progress and how we’re helping developers succeed.

Apps and games on Google Play bring your devices to life, whether they're phones and tablets, Wear devices, TVs, Daydream, or Chromebooks like the new Google Pixelbook. We're making it even easier for people to discover and re-engage with great content on the Play Store.


Recognizing the best

We're investing in curation and editorial to showcase the highest quality apps and games we love. The revamped Editors' Choice is now live in 17 countries and Android Excellence recently welcomed new apps and games. We also continue to celebrate and support indie games, recently announcing winners of the Indie Games Festival in San Francisco and opening the second Indie Games Contest in Europe for nominations.


Discovering great games

We've launched an improved home for games with trailers and screenshots of gameplay and two new browse destinations are coming soon, 'New' (for upcoming and trending games) and 'Premium' (for paid games).


Going beyond installs

We’re showing reminders to try games you’ve recently installed and we’re expanding our successful ‘live operations’ banners on the Play Store, telling you about major in-game events in popular games you’ve got on your device. We're also excited to integrate Android Instant Apps with a 'Try it Now' button on store listings. With a single tap, people can jump right into the app experience without installing.

The new games experience on Google Play

The Google Play Console offers tools which help you and your team members at every step of an app’s lifecycle. Use the Play Console to improve app quality, manage releases with confidence, and increase business performance.


Focus on quality

Android vitals were introduced at I/O 2017 and already 65% of top developers are using the dashboard to understand their app's performance. We're adding five new Android vitals and increasing device coverage to help you address issues relating to battery consumption, crashes, and render time. Better performing apps are favored by Google Play's search and discovery algorithms.
We're improving pre-launch reports and enabling them for all developers with no need to opt-in. When you upload an alpha or beta APK, we'll automatically install and test your app on physical, popular devices powered by Firebase Test Lab. The report will tell you about crashes, display issues, security vulnerabilities, and now, performance issues encountered.
When you install a new app, you expect it to open and perform normally. To ensure people installing apps and games from Google Play have a positive experience and developers benefit from being part of a trusted ecosystem, we are introducing a policy to disallow apps which consistently exhibit broken experiences on the majority of devices such as​ crashing,​ closing,​ ​freezing,​ ​or​ ​otherwise​ ​functioning​ ​abnormally. Learn more in the policy center.


Release with confidence

Beta testing lets trusted users try your app or game before it goes to production so you can iterate on your ideas and gather feedback. You can now target alpha and beta tests to specific countries. This allows you to, for example, beta test in a country you're about to launch in, while people in other countries receive your production app. We'll be bringing country-targeting to staged rollouts soon.
We've also made improvements to the device catalog. Over 66% of top developers are using the catalog to ensure they provide a great user experience on the widest range of devices. You can now save device searches and see why a specific device doesn't support your app. Navigate to the device catalog and review the terms of service to get started.


Grow your subscriptions business

At I/O 2017 we announced that both the number of subscribers on Play and the subscriptions business revenue doubled in the preceding year. We're making it easier to setup and manage your subscription service with the Play Billing Library and, soon, new test instruments to simplify testing your flows for successful and unsuccessful payments.
We're helping you acquire and retain more subscribers. You can offer shorter free trials, at a minimum of three days, and we will now enforce one free trial at the app level to reduce the potential for abuse. You can opt-in to receive notifications when someone cancels their subscription and we're making it easier for people to restore a canceled subscription. Account hold is now generally available, where you can block access to your service while we get a user to fix a renewal payment issue. Finally, from January 2018 we're also updating our transaction fee for subscribers who are retained for more than 12 months.


Announcing the Google Play Security Reward Program

At Google, we have long enjoyed a close relationship with the security research community. Today we're introducing the Google Play Security Reward Program to incentivize security research into popular Android apps, including Google's own apps. The program will help us find vulnerabilities and notify developers via security recommendations on how to fix them. We hope to bring the success we have with our other reward programs, and we invite developers and the research community to work together with us on proactively improving Google Play ecosystem's security.


Stay up to date with Google Play news and tips


How useful did you find this blogpost?

How we’re helping people find quality apps and games on Google Play

Posted by Andrew Ahn, Product Manager, Google Play

People enjoy using apps and games which meet their performance and quality expectations. Excessive battery usage, slow render times, and crashes, on the other hand, can be a source of frustration. In fact, in an internal analysis of app reviews on Google Play, we noticed that half of 1-star reviews mentioned app stability. Developers who focus on app quality can see improvements in their rating, and ultimately their retention and monetization.

As part of our continued effort to deliver the best possible Google Play experience, we recently enhanced our search and discovery algorithms to reflect app quality. This results in higher quality apps being surfaced in the Play Store more than similar apps of lower quality (eg: apps that exhibit more frequent crashes). The change has had a positive impact on engagement -- we've seen that people go on to use higher quality apps more and uninstall them less.

Developers focusing on performance can use the Play Console to help find and fix a number of quality issues. Android vitals identifies key performance issues, reported by opted-in devices which have your app installed, so you can address them. The pre-launch report shows you the result of testing your alpha or beta app on popular physical devices so you can catch issues before launching updates. Also, ratings and reviews can provide additional insights related to app quality, directly from people using your app. To see the positive effect this can have, find out how Busuu increased their rating from 4.1☆ to 4.5☆ by focusing on app performance.

Google Play strives to help people find and discover safe, high quality, useful, and relevant apps. By focusing on the quality and performance of your app, you'll find more success on Google Play. For more tips and best practices to grow your app or game business, get the Playbook app.

How useful did you find this blogpost?

Android vitals: Increase engagement and installs through improved app performance

Posted by Fergus Hurley, Product Manager, Google Play

Poor app performance is something that many users have experienced. Think about that last time you experienced an app crashing, failing to respond, or rendering slowly. Consider your reaction when checking the battery usage on your own device, and seeing an app using excessive battery. When an app performs badly, users notice. In fact, in an internal analysis of app reviews on Google Play, we noticed that half of the 1-star reviews mentioned app stability.

Conversely, people consistently reward the best performing apps with better ratings and reviews. This leads to better rankings on Google Play, which helps increase installs. Not only that, but users stay more engaged, and are willing to spend more time and money.

At Google I/O 2017, we announced the new Android vitals dashboard in the Google Play Console. Android vitals is designed to help you understand and analyze bad app behaviors, so you can improve your app's performance and reap the benefits of better performance.

Android vitals in the Google Play Console

Android vitals helps identify opportunities to improve your app's performance. The dashboards are useful for engineers and business owners alike, offering quick reference performance metrics to monitor your app so you can analyze the data and dedicate the right resources to make improvements.

You'll see the following data collected from Android devices whose users have opted in to automatically share usage and diagnostics data:

  • Stability: ANR rate & crash rate
  • Render time: slow rendering (16ms) and frozen UI frames (700ms)
  • Battery usage: stuck wake locks and excessive wakeups

See how Busuu increased their rating from 4.1☆ to 4.5☆ by focusing on app performance

Busuu is one of the world's largest language learning apps. Hear from Antoine Sakho, Head of Product about how Busuu increased user ratings.

Learn more about engineering for high performance with tools from Android and Google Play

Read our best practice article on Android vitals to understand the data shown in the dashboards, and how you can improve your app's performance and stability. Watch the I/O session to learn about more tools from Android and Google Play that you can use to identify and fix bad behaviors:

Learn more about other Play Console features, and stay up to date with news and tips to succeed on Google Play, with the Playbook app. Join the beta and install it today.

How useful did you find this blogpost?

I/O 2017: Everything new in the Google Play Console


Posted by Vineet Buch, Director of Product Management, Google Play Apps & Games


Google Play continues to grow rapidly around the world, thanks to our ecosystem of developers building high quality and engaging app experiences. There are now 2 billion monthly active Android devices. People in 190 countries downloaded 82 billion apps from the Play Store in the last year and the number of developers with more than 1 million monthly installs grew by 35 percent year on year. We've made huge investments to make purchasing quick and easy by offering direct carrier billing with 140 operators that reach 900M devices every month. These, and other efforts, have made the number of buyers on Google Play grow by almost 30 percent in the last year.
Since we launched the Google Play Console in 2012, we've continued to add features to help you do much more than just publish apps. People in a variety of roles at app and game companies, large and small, carry out tasks like running beta tests, analyzing crashes, responding to customer reviews, evaluating A/B experiments on store listings, pulling financial reports, and more.
Today at Google I/O, we're announcing new and improved features to help you improve your app's performance and quality, and grow your business on Google Play.

Statistics

UPDATED The statistics page for your app now gives you quicker, more flexible access to important data about your business. Compare two different metrics and break them down by a dimension. Select any date range you want, view a breakdown of your data, and even access hourly stats.


Android vitals

NEW Understand your app's Android vitals so you can fix bad behaviors, improve your app experience, and increase your star rating. View aggregated, anonymized device data from people who have opted in their devices to understand three crucial aspects of your app's performance: stability (crash rates and App Not Responding [ANR] rates), battery usage (stuck wake locks and excessive wakeups), and render time (slow rendering and frozen UI frames). Learn more about Android vitals.


UPDATED The ANRs & crashes page has also been updated with larger crash coverage and now benefits from a higher volume of data.


Release management

NEW Use the new release dashboard to track a release as it happens. By monitoring how your release is affecting important metrics, you can be confident that everything is going as planned or you can quickly halt your rollout if anything looks out of the ordinary.


NEW Publish Android Instant Apps with the same release management flow you're familiar with from publishing apps on Google Play. Iterate quickly with a development track, gather feedback from trusted testers on a pre-release track, and when you're ready, release to production. Get started with Android Instant Apps.


NEW The new device catalog will help ensure you're offering a great user experience on the widest range of devices. Search and filter across rich device data for thousands of devices certified by Google. The catalog even shows you your installs, rating, and revenue contributed by device type to help you make the right decisions. You can now also set device exclusion rules by performance indicators like RAM and system on chip. With more granular controls you can exclude fewer devices and offer the best experience on all devices your app supports. Learn more about the device catalog.


NEW For something as important as your app signing key, there's no room for error. With app signing in the Play Console, you now have the option to securely transfer your key to Google to manage on your behalf. You'll benefit from Google's industry leading security and be able to opt-in for upcoming assistive services like app optimizations for APK size. Once opted-in to this service, the Play Store will deliver versions of your APK optimized for the screen density and native architecture of each target device type, saving data and device storage for your users. Learn more about app signing.


UPDATED The pre-launch report, powered by Firebase Test Lab, shows you the results of testing your alpha or beta app on real devices in the lab so you can spot and fix issues before you launch, so they won't affect your rating. The report has been updated with more device test coverage including Android O devices, and new controls, like being able to provide credentials so your app can be tested behind a login.


User acquisition

NEW The acquisition report helps you understand where visitors to your store listing are coming from and whether they go on to install and buy things in your app. The report now includes retained installer data. This reveals which channels and geographies drive valuable users who keep your app installed over periods of up-to 30 days, helping you optimize your marketing efforts.


Financial reports

NEW Subscriptions are the fastest growing business on Google Play – the number of active subscribers has doubled in the last year. With the subscriptions dashboard, see how your subscriptions are performing and make better decisions to grow your business. Understand and analyze total subscribers, revenue, retention, and churn across multiple dimensions.


User feedback

UPDATED Reviews are a valuable channel you can use to engage with people who have your app installed directly. Reviews analysis now covers more languages to help you gather insights from reviews to improve your app. Updated ratings summarizes how users have updated their ratings and reviews, including the effect any replies you made had on those updates. Reviews history shows you the history of your conversation with a user. Finally, we are rolling out the ability to report reviews which do not meet the posting policy guidelines.


Watch us introduce the new Play Console features live at I/O 2017

Tune in live to watch the 'What's new in Google Play at I/O 2017' session, which starts at 12:30pm PT on Thursday, May 18. The team is excited to share all the features we've been working on.
We're also presenting deeper dives into all of our new features and sharing best practices to help you succeed on Google Play. Watch all the Google Play I/O sessions live or afterwards on YouTube:

Day 1, May 17

Day 2, May 18

Day 3, May 19

And be sure to watch the Google Play Awards on day two, which will once again recognize outstanding developers that continue to set the bar for quality apps and games.


How useful did you find this blogpost?