gVisor is a sandboxing technology that provides a secure environment for running untrusted code. In our previous blog post, we discussed how gVisor performance improves with a root filesystem overlay. In this post, we'll dive into another filesystem optimization that was recently launched: directfs. It gives gVisor’s application kernel (the Sentry) secure direct access to the container filesystem, avoiding expensive round trips to the filesystem gofer.
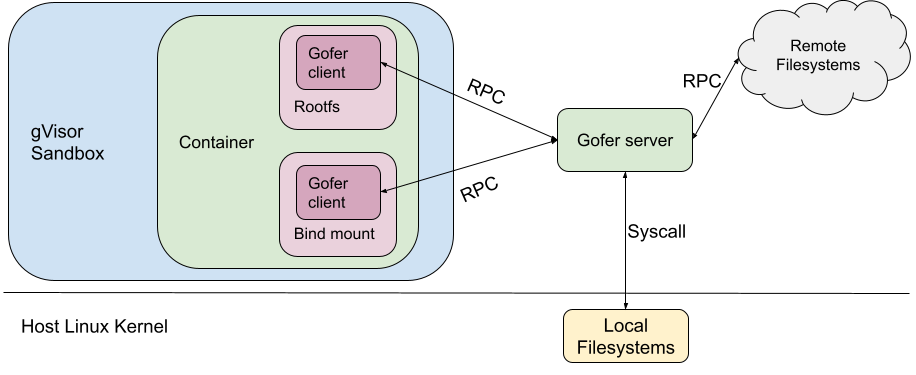
Origins of the Gofer
gVisor is used internally at Google to run a variety of services and workloads. One of the challenges we faced while building gVisor was providing remote filesystem access securely to the sandbox. gVisor’s strict security model and defense in depth approach assumes that the sandbox may get compromised because it shares the same execution context as the untrusted application. Hence the sandbox cannot be given sensitive keys and credentials to access Google-internal remote filesystems.
To address this challenge, we added a trusted filesystem proxy called a "gofer". The gofer runs outside the sandbox, and provides a secure interface for untrusted containers to access such remote filesystems. For architectural simplicity, gofers were also used to serve local filesystems as well as remote.
Isolating the Container Filesystem in runsc
When gVisor was open sourced as runsc, the same gofer model was copied over to maintain the same security guarantees. runsc was configured to start one gofer process per container which serves the container filesystem to the sandbox over a predetermined protocol (now LISAFS). However, a gofer adds a layer of indirection with significant overhead.
This gofer model (built for remote filesystems) brings very few advantages for the runsc use-case, where all the filesystems served by the gofer (like rootfs and bind mounts) are mounted locally on the host. The gofer directly accesses them using filesystem syscalls.
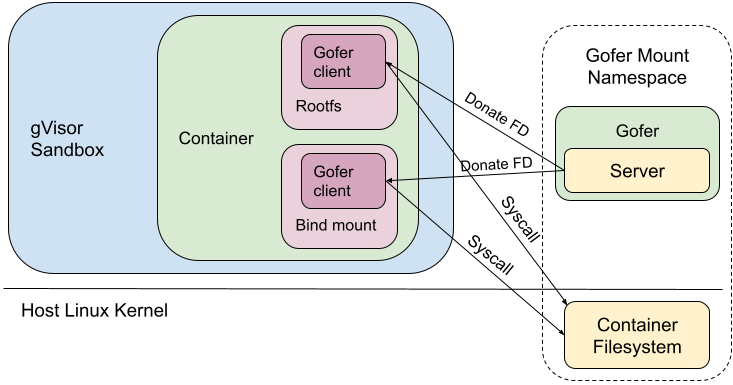
Linux provides some security primitives to effectively isolate local filesystems. These include, mount namespaces, pivot_root and detached bind mounts1. Directfs is a new filesystem access mode that uses these primitives to expose the container filesystem to the sandbox in a secure manner. The sandbox’s view of the filesystem tree is limited to just the container filesystem. The sandbox process is not given access to anything mounted on the broader host filesystem. Even if the sandbox gets compromised, these mechanisms provide additional barriers to prevent broader system compromise.
Directfs
In directfs mode, the gofer still exists as a cooperative process outside the sandbox. As usual, the gofer enters a new mount namespace, sets up appropriate bind mounts to create the container filesystem in a new directory and then pivot_root(2)s into that directory. Similarly, the sandbox process enters new user and mount namespaces and then pivot_root(2)s into an empty directory to ensure it cannot access anything via path traversal. But instead of making RPCs to the gofer to access the container filesystem, the sandbox requests the gofer to provide file descriptors to all the mount points via SCM_RIGHTS messages. The sandbox then directly makes file-descriptor-relative syscalls (e.g. fstatat(2), openat(2), mkdirat(2), etc) to perform filesystem operations.
Earlier when the gofer performed all filesystem operations, we could deny all these syscalls in the sandbox process using seccomp. But with directfs enabled, the sandbox process's seccomp filters need to allow the usage of these syscalls. Most notably, the sandbox can now make openat(2) syscalls (which allow path traversal), but with certain restrictions: O_NOFOLLOW is required, no access to procfs and no directory FDs from the host. We also had to give the sandbox the same privileges as the gofer (for example CAP_DAC_OVERRIDE and CAP_DAC_READ_SEARCH), so it can perform the same filesystem operations.
It is noteworthy that only the trusted gofer provides FDs (of the container filesystem) to the sandbox. The sandbox cannot walk backwards (using ‘..’) or follow a malicious symlink to escape out of the container filesystem. In effect, we've decreased our dependence on the syscall filters to catch bad behavior, but correspondingly increased our dependence on Linux's filesystem isolation protections.
Performance
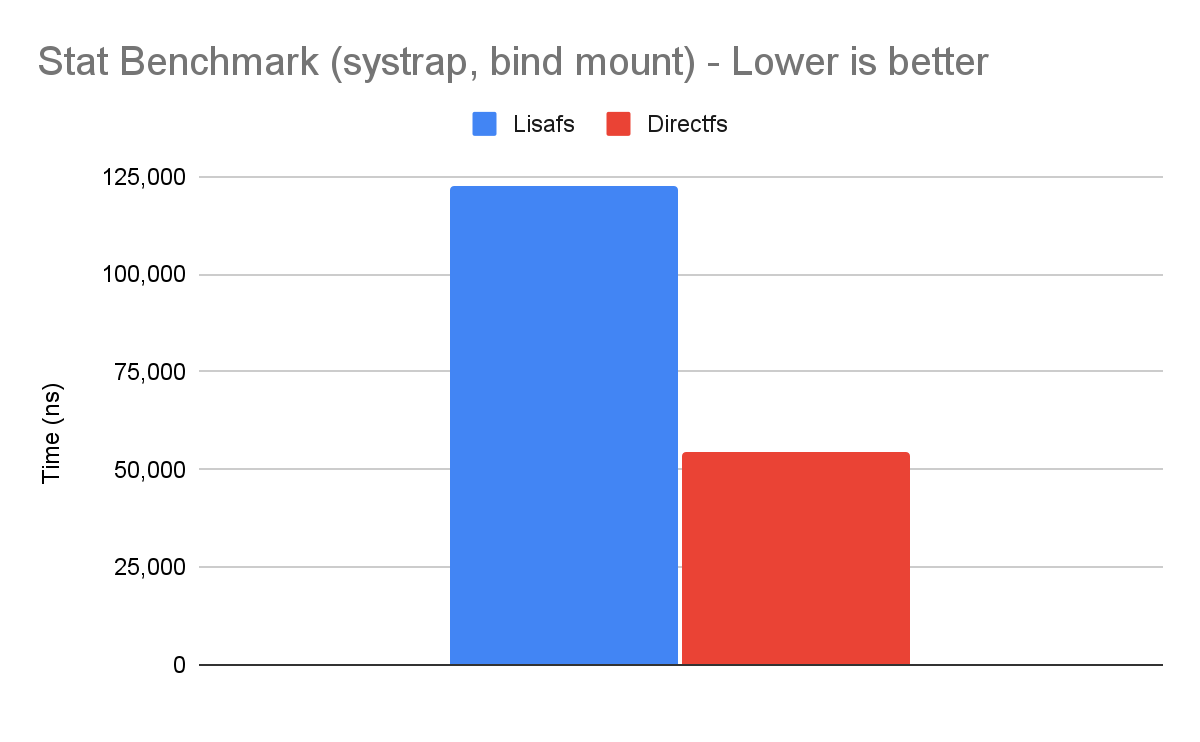
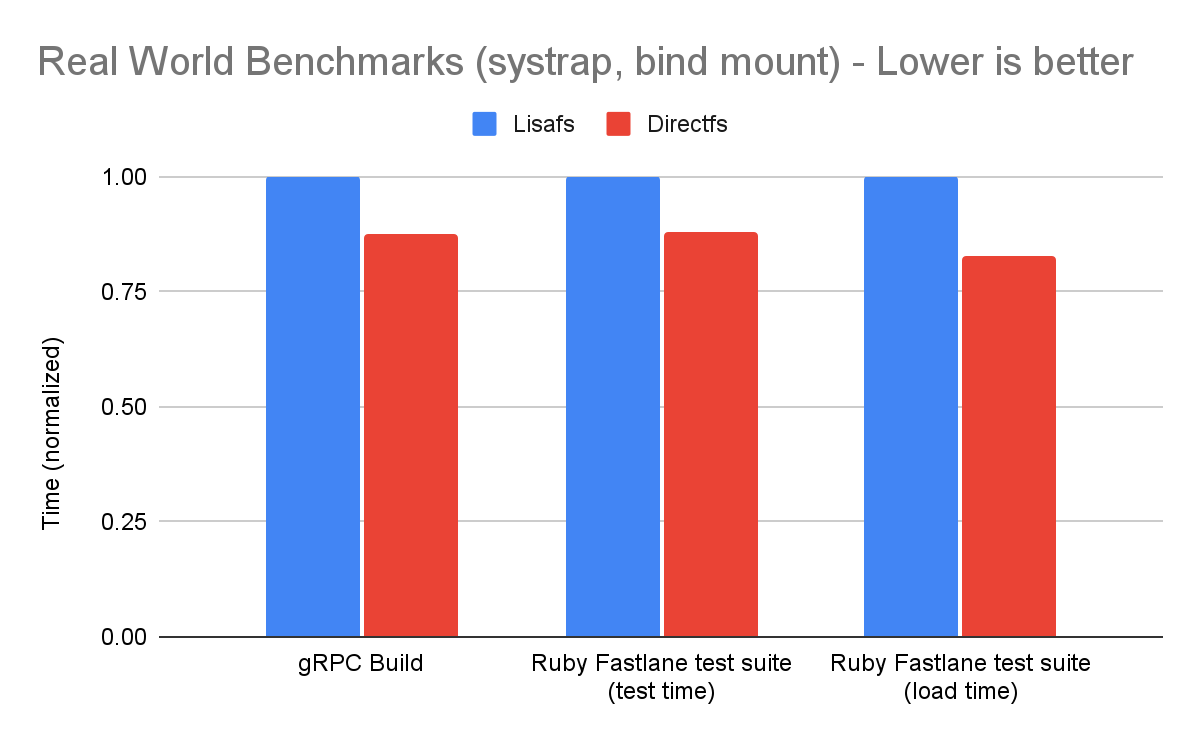
Making RPCs to the gofer for every filesystem operation adds a lot of overhead to runsc. Hence, avoiding gofer round trips significantly improves performance. Let's find out what this means for some of our benchmarks. We will run the benchmarks using our newly released systrap platform on bind mounts (as opposed to rootfs). This would simulate more realistic use cases because bind mounts are extensively used while configuring filesystems in containers. Bind mounts also do not have an overlay (like the rootfs mount), so all operations go through goferfs / directfs mount.
The stat(2) syscall is more than 2x faster! However, since this is not representative of real-world applications, we should not extrapolate these results. So let's look at some real-world benchmarks.
We see a 12% reduction in the absolute time to run these workloads and 17% reduction in Ruby load time!
Conclusion
The gofer model in runsc was overly restrictive for accessing host files. We were able to leverage existing filesystem isolation mechanisms in Linux to bypass the gofer without compromising security. Directfs significantly improves performance for certain workloads. This is part of our ongoing efforts to improve gVisor performance. You can learn more about gVisor at gvisor.dev. You can also use gVisor in GKE with GKE Sandbox. Happy sandboxing!
1Detached bind mounts can be created by first creating a bind mount using mount(MS_BIND) and then detaching it from the filesystem tree using umount(MNT_DETACH).
Posted by Amanda Alexander, Product Manager, Android
Android Jetpack is a key pillar of Modern Android Development. It is a suite of over 100 libraries, tools and guidance to help developers follow best practices, reduce boilerplate code, and write code that works consistently across Android versions and devices so that you can focus on building unique features for your app. The majority of apps on Google Play rely on Jetpack, in fact over 90% of the top 1000 apps use Jetpack.
Below we’ll cover highlights of recent updates in three major areas of Jetpack:
Architecture Libraries and Guidance
Performance Optimization of Applications
User Interface Libraries and Guidance
And then conclude with some additional key updates.
1. Architecture Libraries and Guidance
App architecture libraries and components ensure that apps are robust, testable, and maintainable.
Data Persistence
Most applications need to persist local state - whether it be caching results, managing local lists of user enter data, or powering data returned in the UI. Room is the recommended data persistence layer which provides an abstraction layer over SQLite, allowing for increased usability and safety over the platform.
In Room, we have added many brand-new features, such as the Upsert operation, which attempts to insert an entity when there is no uniqueness conflict or update the entity if there is a conflict, and support for using Kotlin value classes for KSP. These new features are available in Room 2.6-alpha with all library sources written in Kotlin and supports both the Java programming language and Kotlin code generation.
Managing tasks with WorkManager
The WorkManager library makes it easy to schedule deferrable, asynchronous tasks that must be run reliably for instance uploading backups or analytics. These APIs let you create a task and hand it off to WorkManager to run when the work constraints are met.
Now, WorkManager allows you to update a WorkRequest after you have already enqueued it. This is often necessary in larger apps that frequently change constraints or need to update their workers on the fly. As of WorkManager 2.8.0, the updateWork() API is the means of doing this without having to go through the process of manually canceling and enqueuing a new WorkRequest. This greatly simplifies the development process.
DataStore
The DataStore library is a robust data storage solution that addresses issues with SharedPreferences and provides a modern coroutines based API.
In DataStore 1.1 alpha we added a widely requested feature: multi-process support which allows you to access the DataStore from multiple processes while providing data consistency guarantees between them. Additional features include a new storage interface that enables the underlying storage mechanism for Datastore to be switched out (we have provided implementations for java.io and okio), and we have also added support for Kotlin Multiplatform.
Lifecycle management
Lifecycle-aware components perform actions in response to a change in the lifecycle status of another component, such as activities and fragments. These components help you produce better-organized, and often lighter-weight code, that is easier to maintain.
We released a stable version of Lifecycle 2.6.0 that includes more Compose integration. We added a new extension method on Flow, collectAsStateWithLifecycle(), that collects from flows and represents its latest value as Compose State in a lifecycle-aware manner. Additionally, a large number of classes are converted to Kotlin and still retain their binary compatibility with previous versions.
Predictive Back Gesture
In Android 13, we introduced a predictive back gesture for Android devices such as phones, large screens, and foldables. It is part of a multi-year release; when fully implemented, this feature will let users preview the destination or other result of a back gesture before fully completing it, allowing them to decide whether to continue or stay in the current view.
The Activity APIs for Predictive Back for Android are stable and we have updated the best practices for using the supported system back callbacks; BackHandler (for Compose), OnBackPressedCallback, or OnBackInvokedCallback. We are excited to see Google apps adopt Predictive Back including PlayStore, Calendar, News, and TV!
In the Activity 1.8 alpha releases, The OnBackPressedCallback class now contains new Predictive Back progress callbacks for handling the back gesture starting, progress throughout the gesture, and the back gesture being canceled in addition to the previous handleOnBackPressed() callback for when the back gesture is committed. We also added ComponentActivity.setUpEdgeToEdge() to easily set up the edge-to-edge display in a backward-compatible manner.
Activity updates for more consistent Photo Picker experience
The Android photo picker is a browsable interface that presents the user with their media library. In Activity 1.7.0, the Photo Picker activity contracts have been updated to contain an additional fallback that allows OEMs and system apps, such as Google Play services, to provide a consistent Photo Picker experience on a wider range of Android devices and API levels by implementing the fallback action. Read more in the Photo Picker Everywhere blog.
Incremental Data Fetching
The Paging library allows you to load and display small chunks of data to improve network and system resource consumption. App data can be loaded gradually and gracefully within RecyclerViews or Compose lazy lists.
In Paging Compose 1.0.0-alpha19, there is support for all lazy layouts including custom layouts provided by the Wear and TV libraries. To support more lazy layouts, Paging Compose now provides slightly lower level extension methods on LazyPagingItems in itemKey and itemContentType. These APIs focus on helping you implement the key and contentType parameters to the standard items APIs that already exist for LazyColumn, LazyVerticalGrid as well as their equivalents in APIs like HorizontalPager. While these changes do make the LazyColumn and LazyRow examples a few lines longer, it provides consistency across all lazy layouts.
2. Performance Optimization of Applications
Using performance libraries allows you to build performant apps and identify optimizations to maintain high performance, resulting in better end-user experiences.
Improving Start-up Times
Baseline Profiles allow you to partially compile your app at install time to improve runtime and launch performance, and are getting big improvements in new tooling and libraries:
Jetpack provides a new Baseline Profile Gradle Plugin in alpha, which supports AGP 8.0+, and can be easily added to your project in Studio Hedgehog (now in canary). The plugin lets you automate the task of running generation tasks, and pulling profiles from the device and integrating them into your build either periodically, or as part of your release process.
The plugin also allows you to easily automate the new Dex Layout Optimization feature in AGP 8.1, which lets you define BaselineProfileRule tests that collect classes used during startup, and move them to the primary dex file in a multidex app to increase locality. In a large app, this can improve cold startup time by 30% on top of Baseline Profiles!
Macrobenchmark 1.2 has shipped a lot of new features in alpha, such as Power metrics and Custom trace metrics, generation of Baseline Profiles without root on Android 13, and recompilation without clearing app data on Android 14.
Several changes have been made to our UI libraries to provide better support for large-screen compatibility, foldables, and emojis.
Jetpack Compose
Jetpack Compose, Android’s modern toolkit for building native UI, recently had its May 2023 release which includes new features for text and layouts, continued performance improvements, enhanced tooling support, increased support for large screens, and updated guidance. You can read more in the What’s New in Jetpack Compose I/O blog to learn more.
Glance
The Glance library, now in 1.0-beta, lets you develop app widgets optimized for Android phone, tablet, and foldable homescreens using Jetpack Compose. The library gives you the latest Android widget improvements out of the box, using Kotlin and Compose.
Compose for TV
With the alpha release of the TV library, you can now build experiences for Android TV using components optimized for the living room experience. Compose for TV unlocks all the benefits of Jetpack Compose for your TV apps, allowing you to build apps with less code, easier maintenance and a modern Material 3 look straight out of the box. See the Compose for TV blog for details.
Material 3 for Compose
Material Design 3 is the next evolution of Material Design, enabling you to build expressive, spirited and personal apps. It is the recommended design system for Android apps and the 1.1 stable release brings exciting new features such as bottom sheets, date and time pickers, search bars, tooltips, and added more motion and interaction support. Read more in the release blog.
Understanding Window State
The new WindowManager library helps developers adapt their apps to support multi-window environments and new device form factors by providing a common API surface with support back to API level 14.
In 1.1.0-beta01, new features and capabilities have been added to activity embedding and window layout that enables you to optimize your multi-activity apps for large screens. With the 1.1 release of Jetpack WindowManager, activity embedding APIs are no longer experimental and are recommended for multi-activity applications to provide improved large screen layouts. Check out the What’s new in WindowManager 1.1.0-beta01 blog for details and migration steps.
This was a look at all the changes in Jetpack over the past few months to help you build apps more productively. For more details on each Jetpack library, check out the AndroidX release notes, quickly find relevant libraries with the API picker and watch the Google I/O talks for additional highlights.
Java is a trademark or registered trademark of Oracle and/or its affiliates.
Container technology is an integral part of modern application ecosystems, making container security an increasingly important topic. Since containers are often used to run untrusted, potentially malicious code it is imperative to secure the host machine from the container.
A container's security depends on its security boundaries, such as user namespaces (which isolate security-related identifiers and attributes), seccomp rules (which restrict the syscalls available), and Linux Security Module configuration. Popular container management products like Docker and Kubernetes relax these and other security boundaries to increase usability, which means that users need additional container security tools to provide a much stronger isolation boundary between the container and the host.
The gVisoropen source project, developed by Google, provides an OCI compatible container runtime called runsc. It is used in production at Google to run untrusted workloads securely. Runsc (run sandbox container) is compatible with Docker and Kubernetes and runs containers in a gVisor sandbox. gVisor sandbox has an application kernel, written in Golang, that implements a substantial portion of the Linux system call interface. All application syscalls are intercepted by the sandbox and handled in the user space kernel.
Although gVisor does not introduce large fixed overheads, sandboxing does add some performance overhead to certain workloads. gVisor has made several improvements recently that help containerized applications run faster inside the sandbox, including an improvement to the container root filesystem, which we will dive deeper into.
Costly Filesystem Access in gVisor
gVisor uses a trusted filesystem proxy process (“gofer”) to access the filesystem on behalf of the sandbox. The sandbox process is considered untrusted in gVisor’s security model. As a result, it is not given direct access to the container filesystem and its seccomp filters do not allow filesystem syscalls.
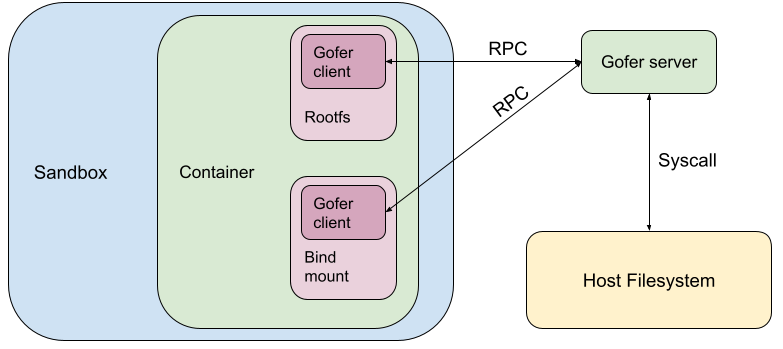
In gVisor, the container rootfs and bind mounts are configured to be served by a gofer.
When the container needs to perform a filesystem operation, it makes an RPC to the gofer which makes host system calls and services the RPC. This is quite expensive due to:
RPC cost: This is the cost of communicating with the gofer process, including process scheduling, message serialization and IPC system calls.
To ameliorate this, gVisor recently developed a purpose-built protocol called LISAFS which is much more efficient than its predecessor.
gVisor is also experimenting with giving the sandbox direct access to the container filesystem in a secure manner. This would essentially nullify RPC costs as it avoids the gofer being in the critical path of filesystem operations.
Syscall cost: This is the cost of making the host syscall which actually accesses/modifies the container filesystem. Syscalls are expensive, because they perform context switches into the kernel and back into userspace.
To help with this, gVisor heavily caches the filesystem tree in memory. So operations like stat(2) on cached files are serviced quickly. But other operations like mkdir(2) or rename(2) still need to make host syscalls.
Container Root Filesystem
In Docker and Kubernetes, the container’s root filesystem (rootfs) is based on the filesystem packaged with the image. The image’s filesystem is immutable. Any change a container makes to the rootfs is stored separately and is destroyed with the container. This way, the image’s filesystem can be shared efficiently with all containers running the same image. This is different from bind mounts, which allow containers to access the bound host filesystem tree. Changes to bind mounts are always propagated to the host and persist after the container exits.
Docker and Kubernetes both use the overlay filesystem by default to configure container rootfs. Overlayfs mounts are composed of one upper layer and multiple lower layers. The overlay filesystem presents a merged view of all these filesystem layers at its mount location and ensures that lower layers are read-only while all changes are held in the upper layer. The lower layer(s) constitute the “image layer” and the upper layer is the “container layer”. When the container is destroyed, the upper layer mount is destroyed as well, discarding the root filesystem changes the container may have made. Docker’s overlayfs driver documentation has a good explanation.
Rootfs Configuration Before
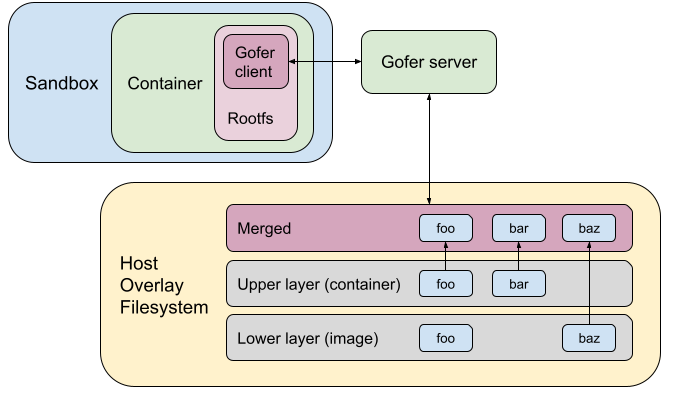
Let’s consider an example where the image has files foo and baz. The container overwrites foo and creates a new file bar. The diagram below shows how the root filesystem used to be configured in gVisor earlier. We used to go through the gofer and access/mutate the overlaid directory on the host. It also shows the state of the host overlay filesystem.
Opportunity! Sandbox Internal Overlay
Given that the upper layer is destroyed with the container and that it is expensive to access/mutate a host filesystem from the sandbox, why keep the upper layer on the host at all? Instead we can move the upper layer into the sandbox.
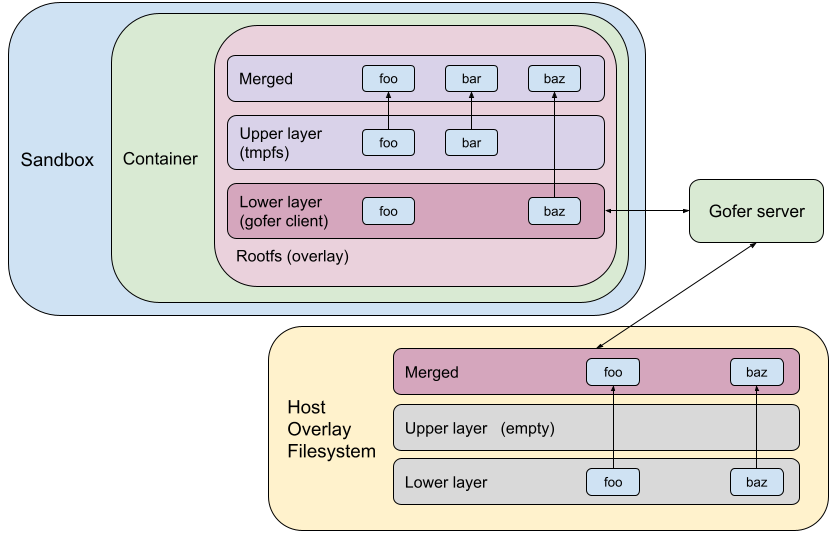
The idea is to overlay the rootfs using a sandbox-internal overlay mount. We can use a tmpfs upper (container) layer and a read-only lower layer served by the gofer client. Any changes to rootfs would be held in tmpfs (in-memory). Accessing/mutating the upper layer would not require any gofer RPCs or syscalls to the host. This really speeds up filesystem operations on the upper layer, which contains newly created or copied-up files and directories.
Using the same example as above, the following diagram shows what the rootfs configuration would look like using a sandbox-internal overlay.
Host-Backed Overlay
The tmpfs mount by default will use the sandbox process’s memory to back all the file data in the mount. This can cause sandbox memory usage to blow up and exhaust the container’s memory limits, so it’s important to store all file data from tmpfs upper layer on disk. We need to have a tmpfs-backing “filestore” on the host filesystem. Using the example from above, this filestore on the host will store file data for foo and bar.
This would essentially flatten all regular files in tmpfs into one host file. The sandbox can mmap(2) the filestore into its address space. This allows it to access and mutate the filestore very efficiently, without incurring gofer RPCs or syscalls overheads.
Self-Backed Overlay
In Kubernetes, you can set local ephemeral storage limits. The upper layer of the rootfs overlay (writeable container layer) on the host contributes towards this limit. The kubelet enforces this limit by traversing the entire upper layer, stat(2)-ing all files and summing up their stat.st_blocks*block_size. If we move the upper layer into the sandbox, then the host upper layer is empty and the kubelet will not be able to enforce these limits.
To address this issue, we introduced “self-backed” overlays, which create the filestore in the host upper layer. This way, when the kubelet scans the host upper layer, the filestore will be detected and its stat.st_blocks should be representative of the total file usage in the sandbox-internal upper layer. It is also important to hide this filestore from the containerized application to avoid confusing it. We do so by creating a whiteout in the sandbox-internal upper layer, which blocks this file from appearing in the merged directory.
The following diagram shows what rootfs configuration would finally look like today in gVisor.
Performance Gains
Let’s look at some filesystem-intensive workloads to see how rootfs overlay impacts performance. These benchmarks were run on a gLinux desktop with KVM platform.
Micro Benchmark
Linux Test Project provides a fsstress binary. This program performs a large number of filesystem operations concurrently, creating and modifying a large filesystem tree of all sorts of files. We ran this program on the container's root filesystem. The exact usage was:
sh -c "mkdir /test && time fsstress -d /test -n 500 -p 20 -s 1680153482 -X -l 10"
You can use the -v flag (verbose mode) to see what filesystem operations are being performed.
The results were astounding! Rootfs overlay reduced the time to run this fsstress program from 262.79 seconds to 3.18 seconds! However, note that such microbenchmarks are not representative of real-world applications and we should not extrapolate these results to real-world performance.
Real-world Benchmark
Build jobs are very filesystem intensive workloads. They read a lot of source files, compile and write out binaries and object files. Let’s consider building the abseil-cpp project with bazel. Bazel performs a lot of filesystem operations in rootfs; in bazel’s cache located at ~/.cache/bazel/.
This is representative of the real-world because many other applications also use the container root filesystem as scratch space due to the handy property that it disappears on container exit.
To make this more realistic, the abseil-cpp repo was attached to the container using a bind mount, which does not have an overlay.
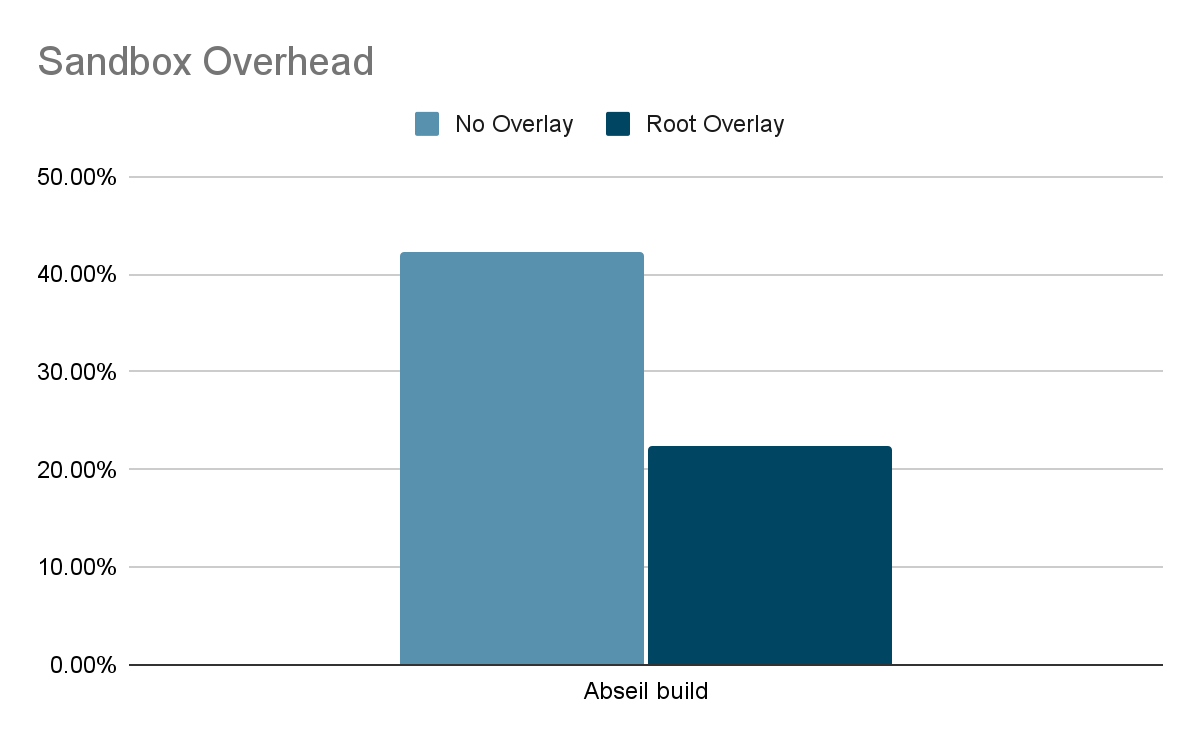
When measuring performance, we care about reducing the sandboxing overhead and bringing gVisor performance as close as possible to unsandboxed performance. Sandboxing overhead can be calculated using the formula overhead = (s-n)/nwhere ‘s’ is the amount of time taken to run a workload inside gVisor sandbox and ‘n’ is the time taken to run the same workload natively (unsandboxed). The following graph shows that rootfs overlay halved the sandboxing overhead for abseil build!
Conclusion
Rootfs overlay in gVisor substantially improves performance for many filesystem-intensive workloads, so that developers no longer have to make large tradeoffs between performance and security. We recently made this optimization the default in runsc. This is part of our ongoing efforts to improve gVisor performance. You can learn more about gVisor at gvisor.dev. You can also use gVisor in GKE with GKE Sandbox. Happy sandboxing!
Posted by Rebecca Gutteridge, Senior Developer Relations Engineer
Hey there! I’m Rebecca Gutteridge, Senior Developer Relations Engineer at Google. As someone who has been working closely with developers to understand how we can make the Android platform better, I’m passionate about helping developers improve their app quality to create amazing experiences for users. In 2022 we announced Android Studio’s App Quality Insights (AQI) window which enables developers to discover, investigate, and reproduce issues reported by Firebase Crashlytics, directly within the context of your local Android Studio project. This is a big step in how Android developers can improve their app stability, and I wanted to learn more about the evolution of how mobile developers have managed crashes throughout the years. You can watch the behind the Scenes video on AQI here, and within the latest episode of #TheAndroidShow.
Early Days of Crash Management
I first chatted with Annyce Davis, VP of Engineering at Meetup and Android GDE. She has been in the mobile development space since 2010 and had a lot of hands on experience helping debug user experiences.
“In the early days, developers cared deeply about user crashes, but they didn’t have the tools to replicate or debug the issue, or to understand which users were being impacted. I remember spending lots of time trying to reproduce issues based on minimal information from bug reports.
One time I remember attempting to debug an experience only happening in a specific country, and no matter how many times I tried, I was unable to reproduce it. It wasn’t until I traveled there in person, I realized people were often using 2G. It never dawned on me to check the connection type!” -Annyce Davis
Firebase Crashlytics Changes the Game
Crashlytics was introduced in 2011 and it has helped developers track, prioritize, and fix app crashes faster. Annyce told me this was a game changer for crash management.
“We could now know which devices were experiencing issues, could be notified of trending issues, and finally we were able to show non-technical stakeholders crashes visually, to create buy-in for urgent work.
My team received crash reports for a particular screen of the Meetup app, but we could never reproduce the issue given how inconsistent it was. First, Crashlytics helped us narrow down which feature to examine. We found a crash that was due to a null pointer exception on data that we never expected to be null, so it didn’t seem like the crash could even be possible! An engineer on my team was able to use this data from Crashlytics to uncover that the source was a race condition that would lead to the null, and then he was able to fix it.” -Annyce Davis
What a tricky bug, how fascinating!
Behind the Scenes of AQI
I wanted to learn more about the idea behind AQI, so I chatted with David Motsonashvili, a software engineer on the Firebase team who worked on the initial prototype.
“The original idea for the integration came from a quarterly Hackweek, where we were able to experiment on our own projects. We know Android developers use both Firebase console and Android Studio, so I had an idea to integrate Firebase into Android Studio to reduce their need to switch between the two.
The first prototype for this project was actually an integration with Firebase Performance Monitoring and Android Studio, but we realized Crashlytics would have a much bigger impact on developer workflow as an integration in Android Studio, so we pivoted in that direction instead, and the rest is history!” -David Motsonashvili
I loved that the idea came from wanting to help developers and make our tools easier for them to use! I asked David if he had any fun stories about the project.
“We had to be really scrappy about showing our test app's Crashlytics crash data in the IDE because of limitations we had with the API. It was a really fun project to figure out how to work around this during Hackweek!” -David Motsonashvili
I wanted to better understand how AQI evolved from being an idea during Hackweek, to where it is today.
“Once we launched the early developer preview we tested this with a few internal Google teams, and they loved it! We also started testing this with Android developers as part of an early access program. Some of the companies we talked to were Adobe, Luno, and Meetup. They had really valuable feedback that directly contributed to the roadmap. One example is when we learned many teams needed a place to collaborate within AQI, so we of course moved forward with adding the Crashlytics notes feature into AQI.” -David Motsonashvili
Modern Crash Management
Annyce and her team were early testers of AQI, and it was fun to learn about what they thought of the feature.
“I was truly happy to be able to go directly from a link in the stacktrace to the code. It was the feature in Android Studio that you never knew you needed! I especially like that you can filter issues based on the different variants in your app. Every engineer that I know and work with is passionate about delivering performant, quality code. App Quality Insights is the next step in the evolution of crash management, it can help engineers have more agency over addressing crashes while they also work on exciting new features.” -Annyce Davis
We’ve certainly come a long way with the tools developers have to manage bugs and crashes.
Get started with AQI
If you’re ready to try AQI out for yourself, download the latest version of Android Studio. You can also view the documentation, guide on medium, and our demo video to learn more about how to use it.
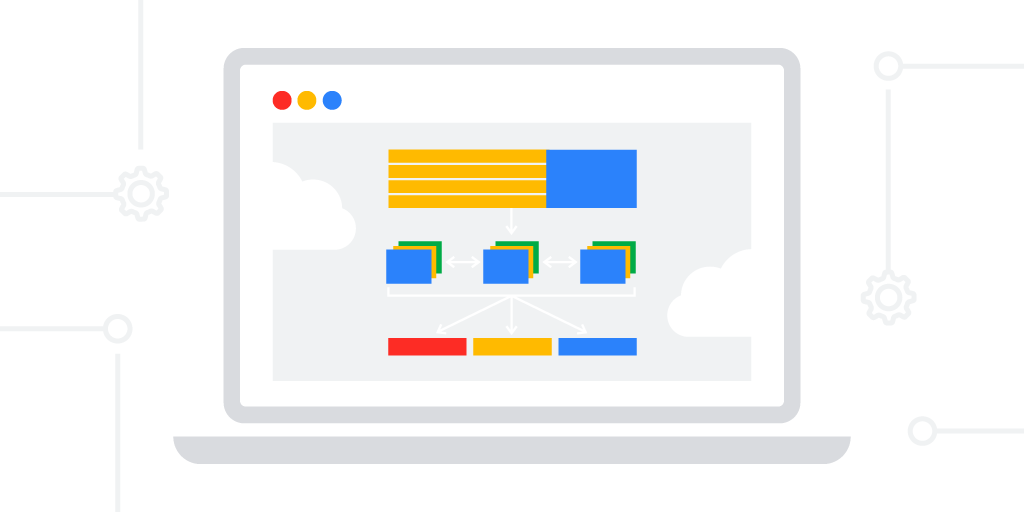
We are excited to introduce Service Weaver, an open source framework for building and deploying distributed applications. Service Weaver allows you to write your application as a modular monolith and deploy it as a set of microservices.
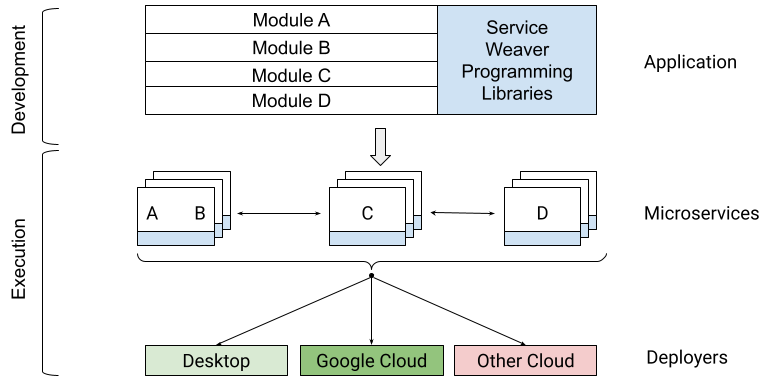
More concretely, Service Weaver consists of two core pieces:
A set of programming libraries, which let you write your application as a single modular binary, using only native data structures and method calls, and
A set of deployers, which let you configure the runtime topology of your application and deploy it as a set of microservices, either locally or on the cloud of your choosing.
By decoupling the process of writing the application from runtime considerations such as how the application is split into microservices, what data serialization formats are used, and how services are discovered, Service Weaver aims to improve distributed application development velocity and performance.
Motivation for Building Service Weaver
While writing microservices-based applications, we found that the overhead of maintaining multipledifferent microservice binaries—with their own configuration files, network endpoints, and serializable data formats—significantly slowed our development velocity.
More importantly, microservices severely impacted our ability to make cross-binary changes. It made us do things like flag-gate new features in each binary, evolve our data formats carefully, and maintain intimate knowledge of our rollout processes. Finally, having a predetermined number of specific microservices effectively froze our APIs; they became so difficult to change that it was easier to squeeze all of our changes into the existing APIs rather than evolve them.
As a result, we wished we had a single monolithic binary to work with. Monolithic binaries are easy to write: they use only language-native types and method calls. They are also easy to update: just edit the source code and re-deploy. They are easy to run locally or in a VM: simply execute the binary.
Service Weaver, is a framework that has the best of both worlds: the development velocity of a monolith, with the scalability, security, and fault-tolerance of microservices.
Service Weaver Overview
The core idea of Service Weaver is its modular monolith model. You write a single binary, using only language-native data structures and method calls. You organize your binary as a set of modules, called components, which are native types in the programming language. For example, here is a simple application written in Go using Service Weaver. It consists of a main() function and a single Adder component:
type Adder interface { Add(context.Context, int, int) (int, error) } type adder struct{ weaver.Implements[Adder] } func(adder) Add(_ context.Context, x, y int) (int, error) { return x + y, nil} funcmain() { ctx := context.Background() root := weaver.Init(ctx) adder, err := weaver.Get[Adder](root) sum, err := adder.Add(ctx, 1, 2) }
When running the above application, you can make a trivial configuration choice of whether to place the Adder component together with the main() function or to place it separately. When the Adder component is separate, the Service Weaver framework automatically translates the Add call into a cross-machine RPC; otherwise, the Add call remains a local method call.
To make a change to the above application, such as adding an unbounded number of arguments to the Add method, all you have to do is change the signature of Add, change its call-sites, and re-deploy your application. Service Weaver makes sure that the new version of main() communicates only with the new version of Adder, regardless of whether they are co-located or not. This behavior, combined with using language-native data structures and method calls, allows you to focus exclusively on writing your application logic, without worrying about the deployment topology and inter-service communication (e.g., there are no protos, stubs, or RPC channels in the code).
When it is time to run your application, Service Weaver allows you to run it anywhere—on your local desktop environment or on your local rack of machines or in the cloud—without any changes to your application code. This level of portability is achieved by a clear separation of concerns built into the Service Weaver framework. On one end, we have the programming framework, used for application development. On the other end, we have various deployer implementations, one per deployment environment.
This separation of concerns allows you to run your application locally in a single process via go run .; or run it on Google Cloud via weaver gke deploy;or enable and run it on other platforms. In all of these cases, you get the same application behavior without the need to modify or re-compile your application.
A number of deployers used for running your applications locally or on GKE.
A set of APIs that allow you to write your own deployers for any other platform.
All of the libraries are released under the Apache 2.0 license. Please be aware that we are likely to introduce breaking changesuntil version v1.0 is released.
Get Started and Get Involved
While Service Weaver is still in an early development stage, we would like to invite you to use it and share your feedback, thoughts, and contributions.
The easiest way to get started using Service Weaver is to follow the Step-By-Step instructions on our website. If you would like to contribute, please follow our contributor guidelines. To post a question or contact the team directly, use the Service Weaver mailing list.
The team is excited to host a Twitter Space with Kelsey Hightower on March 2nd, at 10am PST. Keep an eye out on the Service Weaver blog for the latest news, updates, and details on future events.
More Resources
Visit us at serviceweaver.dev to get the latest information about the project, such as getting started, tutorials, and blog posts.
Access one of our Service Weaver repositories on GitHub.
By Srdjan Petrovic and Garv Sawhney, on behalf of the Service Weaver team
Posted by Niharika Arora, Developer Relations Engineer
Building for Android Go involves paying special attention to performance optimizations and resource usage.
In part-1 of this blog, we discussed why developers should consider building for Android Go, some tips on optimizing the app memory and identified the standard approach to follow while fixing performance issues. In this blog, we will talk about the other vitals to pay attention to while building apps for Android Go.
Optimize your apps for Android Go
Improve startup latency
Improving app startup time requires a deep understanding of things that affect it.
Avoid eager initialization: Avoid doing eager work that may not be needed in your app’s startup sequence. The user launching your app is the most well-known reason a process starts, but WorkManager, JobScheduler, BroadcastReceiver, bound Services, and ContentProviders can also start your app process in the background. Avoid initializing things eagerly in your Application class like ContentProviders, or androidx initializers if possible (If they are not needed for any possible reason for your app process to start).
Move the tasks from UI thread to background thread
Identify operations which occupy large time frames and can be optimized.
Identify operations that consume more time than expected.
Identify operations which cause the main thread to be blocked.
If there are tasks which are taking longer and blocking the main thread, try to move them to a background thread or prefer using WorkManager.
Check third party library initialization
Lazy load third party libraries. A lot of libraries do have on demand initialization or disabling auto init options.
Check if any layouts are invisible, but still spend time for the images to be loaded.
Explore using a low resolution image according to the memory capabilities of the device.
Remove unnecessary backgrounds/alpha from views.
Avoid synchronous IPCs on UI thread: Check for binder transactions keeping the main thread busy: Often there are multiple Inter process communication happening within the app. These could be anything like image / asset loading, third party libs loading, heavy work on application’s main thread like disk or network access etc. StrictMode is a useful developer tool to detect such accident usage.
Identify and measure these transactions to understand :
How much time does this take and if it is expected & necessary ?
Is the main thread sleeping / idle / blocked during this time ? If yes, this could be a performance bottleneck.
Can this be delayed ?
Wisely use XML and Json parsing: The Gboard app optimized file list parsing by using Java code instead of XML parsing as they were parsing them out into memory as Java objects at runtime. So, GBoard did a work to convert all the XML into Java code at compile time, the latency then become time of class loading, which is much more faster, almost ⅕ of previous. Benchmarking both XML and Json parsing for your app to identify the appropriate library to be used.
Analyze and fix severe disk read contention: To capture this, use StrictMode in your development environment.
Detects accidental disk or network access on the application's main thread, where UI operations are received and animations take place.
Can automatically terminate the app (or log it to logcat), when a violation has occurred by adding different penalties.
Optimize app size
Users often avoid downloading apps that seem too large, particularly in emerging markets where devices connect to spotty 2G and 3G networks with low bandwidth speed or work on pay-by-the-byte plans.
Remove unnecessary layouts: Gboard and Camera from Google teams validated the layouts which were unused or could be merged with small UI changes and removed the unnecessary layouts reducing overall app code size.
Migrate to dynamic layouts/views when appropriate: The apps deep dive and find out the layouts and views which can be dynamically rendered. They used merge and viewstub to further optimize their views and layouts.
Revaluate features with low DAU. Try to disable features which take more memory and make the app less performant: The team further analyzed their apps to specifically optimize for Android Go and disabled features on go devices which were not of much usage but were taking a lot of memory. They removed complex animations, large GIFs etc. to make space for parts of the app.
Try combine native binaries with common dependencies into one: If the app has different JNI implementations with a lot of common underlying dependencies - all the different binaries add up to the apk size with redundant components. Camera from Google app benefited from combining several JNI binaries into a single JNI binary while keeping the Java and JNI files separate. This helped the app reduce the apk size by several Mbs.
Try to reduce dalvik code size: Check for code that is never used at runtime, eg) large classes and auto-generated code.
Code optimizers like ProGuard () could help optimize and shrink code size, but they can't deal with codes guarded by runtime-constants. Replacing the check/flags with compile-time constants to make most usage of the optimization tools.
Reduce translatable strings size :
a. Don’t translate internal-only UI strings. Mark them as translatable = “false”.
b.Remove unused alternative resources: You can use the Android Gradle plugin's resConfigs property to remove alternative resource files that your app does not need. if you are using a library that includes language resources (such as AppCompat or Google Play Services), then your app includes all translated language strings for the messages in those libraries whether the rest of your app is translated to the same languages or not. If you'd like to keep only the languages that your app officially supports, you can specify those languages using the resConfig property. Any resources for languages not specified are removed.
The following snippet shows how to limit your language resources to just English and French
c. Don’t translate what doesn’t need translation: If the string does not participate in a UI, it should not be translated. Strings for the purpose of debugging, exception messages, URLs and so on should be string literals in code, not resources.
i.Don’t translate what’s not shown to the user anyway
It’s possible to have a String resource that’s practically never shown to the user, but is still strongly referenced. One example is in your <activity>, if you have an android:label set and referencing a String resource but the Activity’s label is never actually shown (e.g. it’s not a launcher Activity and it doesn’t have an app bar that shows its own label).
You may recognize < and > - these are escape characters for “<” and “>”. They’re needed here because if you were to put an <a> tag inside a <string> tag, then the Android resource compiler would just drop them (as it does with all tags it doesn’t recognize).
However, this means that you’re translating the HTML tags and the URL to 78 languages. Totally unnecessary.
Note we don’t define a separate string for “Learn more”, because it’s a common string. To produce the HTML snippet for the link, we define "<a href="https://support.google.com/androidauto/answer/6395843>%s</a>" as a string literals in code, and then drop the value of “Learn more” from resources into the format specifier.
e. Inline untranslated strings: By specifying strings in strings.xml you can leverage the Android framework to automatically change the actual value used at runtime based on the current configuration (e.g. based on the current locale, show a localized value for the string).
f. Remove duplicate strings: If you have the same string multiple times as a literal in code (“Hello World”), it will be shared across all instances. But resources don’t work this way - if you have an identical string under a different name then unless both are translated identically across 78 languages (unlikely) you’ll end up with duplicates.
Don’t have duplicate strings!
g. Don’t have separate strings for ALL CAPS or Title Case: Android has built-in support for case mutations.
Use android:capitalize (since API level 1). If set, specifies that this TextView has a textual input method and should automatically capitalize what the user types. The default is "none".
Reducing asset size: Be mindful of different target device form factors that your app supports and adjust your assets accordingly.
Upload your app with Android app bundles: The easiest way to gain immediate app size savings when publishing to Google Play is by uploading your app as an Android App Bundle, which is a new upload format that includes all your app’s compiled code and resources, but defers APK generation and signing to Google Play. Read more here.
Utilize dynamic delivery feature if applicable: Play Feature Delivery uses advanced capabilities of app bundles, allowing certain features of your app to be delivered conditionally or downloaded on demand. You can use feature modules for custom delivery. A unique benefit of feature modules is the ability to customize how and when different features of your app are downloaded onto devices running Android 5.0 (API level 21) or higher. Learn more here.
Recap
This part of the blog captures some best practices, recommendations and learnings from Google apps to optimize your app size, startup latency and improve go app experience that helps drive user engagement and adoption for your Android app. In part-3, you will get to know the tools that helped the Google apps identify and fix such performance issues in their app!
The Android operating system brings the power of computing to everyone. This vision applies to all users, including those on entry-level phones that face real constraints across data, storage, memory, and more. This was especially important for us to get right because, when we first announced Android (Go edition) back in 2017, people using low-end phones accounted for 57% of all device shipments globally (IDC Mobile Phone Tracker).
What is Android (Go edition)?
Android (Go edition) is a mobile operating system built for entry-level smartphones with less RAM. Android (Go edition) runs lighter and saves data, enabling Original Equipment Manufacturers (OEMs) to build affordable, entry-level devices that empower people with possibility. RAM requirements are listed below, and for full Android (Go edition) device capability specifications, see this page on our site.
Year
2018
2019
2020
2021
2022
2023
Release
Android 8
Android 9
Android 10
Android 11
Android 12
Android 13
Min RAM
512MB
512MB
512MB
1GB
1GB
2GB
Android (Go edition) provides an optimized experience for low-RAM devices. By tailoring the configuration and making key trade-offs, we’re able to improve speed and performance for low-end devices and offer a quality phone experience for more than 250M people around the world.
Recent Updates
We are constantly making phones powered by Android (Go edition) more accessible with additional performance optimizations and features designed specifically for new & novice internet users, like translation, app switching, and data saving.
Below are the recent improvements we made for Android 12:
Faster App Launches
Longer Battery Life
Easier App Sharing
More Privacy Control
Why build for Android (Go edition)?
With the fast growing & easily accessible internet, and all the features available at low cost, OEMs and developers are aiming & building their apps specifically for Android (Go edition) devices.
Fast forward to today — over 250 million+ people worldwide actively use an Android (Go edition) phone. And also considering the big OEMs like Jio, Samsung, Oppo, Realme etc. building Android (Go edition) devices, there is a need for developers to build apps that perform well especially on Go devices.
But the markets with the fast growing internet and smartphone penetration can have some challenging issues, such as:
Your app is not starting within the required time limit.
A lot of features/required capabilities increases your app size
How to handle memory pressure while working on Go apps?
Optimize your apps for Android (Go edition)
To help your app succeed and deliver the best possible experience in developing markets, we have put together some best practices based on experience building our own Google apps Gboard & Camera from Google.
Before starting any optimization effort, it’s important to define the goals. Key Performance Indicators (KPIs) have to be defined for the app.
KPIs can be common across different apps and some can be very specific. Some examples of KPIs can be
KPI
Category
App Startup Latency
Common to all apps
App Crash Rate
Common to all apps
End to end latency for CUJ - Camera Shot
Specific to Camera app
App Not Responding Rate
Common to all apps
Once KPIs are defined the team should agree on the target thresholds. This can be derived from the minimum user experience/benchmarks in mind.
KPIs should ideally be defined from the perspective of balancing User Experience and technical complexity.
Breakdown
Once KPIs are defined, the next steps could be to break down a given KPI into individual signal metrics.
For example → End to end latency for CUJ (shots in Camera) can be divided into → Frame capture latency, image processing latency, time spent on saving a processed image to disk etc.
Similarly, App Crash Rate can be bucketed into → Crash due to unhandled errors, Crash due to high memory usage, Crash due to ANR etc.
Benchmark
Benchmark or measure the KPI values and individual metrics to identify current performance. If KPI targets are met, things are good. If not → identify the bottlenecks by looking at the individual breakdowns.
Repeat the process
After optimizing a certain bottleneck go back and benchmark the metrics again to see if the KPI targets are met. If not, repeat the process. If yes, great job!
Add Regular regression test
That either runs for every change or in some frequency to identify regressions in KPIs. It is more difficult to debug and find sources of regressions or bugs than to not allow them to get into the codebase. Don’t allow the changes that fail the KPI goals unless the decision is to update the KPI targets.
Try to invest in building a regression infrastructure to deal with such issues in early stages.
Decide on how often tests should run? What should be the optimal frequency for your app?
Optimize App Memory
Release cache-like memory in onTrimMemory(): onTrimMemory() has always proven useful for an app to trim unneeded memory from its process. To best know an app's current trim level, you can use ActivityManager.getMyMemoryState(RunningAppProcessInfo) and then try to optimize/trim the resources which are not needed.
GBoard used the onTrimMemory() signal to trim unneeded memory while it goes in the background and there is not enough memory to keep as many background processes running as desired, for example, trimming unneeded memory usage from expressions, search, view cache or openable extensions in background. It helped them reduce the number of times being low memory killed and the average background RSS. Resident Set Size(RSS) is basically the portion of memory occupied by your app process that is held in main memory (RAM). To know more about RSS, please refer here.
Check if malloc can be replaced with mmap when accessing read-only & large files: mmap is only recommended for reading a large file onto memory ('read-only memory mapped file'). The kernel has some special optimizations for read-only memory mapped files, such as unloading unused pages.
Typically this is useful for loading large assets or ML models.
Scheduling tasks which require similar resources(CPU, IO, Memory) appropriately: Concurrent scheduling could lead to multiple memory intensive operations to run in parallel and leading to them competing for resources and exceeding the peak memory usage of the app. The Camera from Google app found multiple problems, ensured a cap to peak memory and further optimized their app by appropriately allocating resources, separating tasks into CPU intensive, low latency tasks(tasks that need to be finished fast for Good UX) & IO tasks. Schedule tasks in right thread pools / executors so they can run on resource constrained devices in a balanced fashion.
Find & fix memory leaks: Fighting leaks is difficult but there are tools like Android Studio Memory Profiler/Perfetto specifically available to reduce the effort to find and fix memory leaks.
Google apps used the tools to identify and fix memory issues which helped reduce the memory usage/footprint of the app. This reduction allowed other components of the app to run without adding additional memory pressure on the system.
if ClassA allocates native resources underneath and doesn't cleanup automatically on finalize(..) and requires caller to call some release(..) method, it needs to be like this
ClassA obj = new ClassA("x"); // ... something // Explicit cleanup. obj.release(); obj = new ClassB("y");
else it will leak native heap memory.
Optimize your bitmaps: Large images/drawables usually consume more memory in the app. Google apps identified and optimized large bitmaps that are used in their apps.
Lessons learned :
Prefer Lazy/on-demand initializations of big drawables.
Release view when necessary.
Avoid using full colored bitmaps when possible.
For example:Gboard’s glide typing feature needs to show an overlay view with a bitmap of trails, which can only has the alpha channel and apply a color filter for rendering.
Check and only set the alpha channel for the bitmap for complex custom views used in the app. This saved them a couple of MBs (per screen size/density).
While using Glide,
The ARGB_8888 format has 4 bytes/pixel consumption while RGB_565 has 2 bytes/pixel. Memory footprint gets reduced to half when RGB_565 format is used but using lower bitmap quality comes with a price too. Whether you need alpha values or not, try to fit your case accordingly.
Configure and use cache wisely when using a 3P lib like Glide for image rendering.
Try to choose other options for GIFs in your app when building for Android (Go edition) as GIFs take a lot of memory.
The aapt tool can optimize the image resources placed in res/drawable/ with lossless compression during the build process. For example, the aapt tool can convert a true-color PNG that does not require more than 256 colors to an 8-bit PNG with a color palette. Doing so results in an image of equal quality but a smaller memory footprint. Read more here.
You can reduce PNG file sizes without losing image quality using tools like pngcrush, pngquant, or zopflipng. All of these tools can reduce PNG file size while preserving the perceptive image quality.
You could use resizable bitmaps. The Draw 9-patch tool is a WYSIWYG editor included in Android Studio that allows you to create bitmap images that automatically resize to accommodate the contents of the view and the size of the screen. Learn more about the tool here.
Recap
This part of the blog outlines why developers should consider building for Android (Go edition), a standard approach to follow while optimizing their apps and some recommendations & learnings from Google apps to improve their app memory and appropriately allocate resources.
In the next part of this blog, we will talk about the best practices on Startup latency, app size and the tools used by Google apps to identify and fix performance issues.
TikTok serves a wide range of user groups. With users around the world, it’s inevitable that some of them experience network issues such as slow, intermittent, or expensive connectivity. Other users are using entry level devices with limited memory and storage. Ensuring an excellent app experience in all these scenarios is paramount. TikTok's team was able to significantly improve their overall performance by following Android’s performance guidance, and employing their deep understanding of development tools such as Android Gradle Plugin and Jetpack libraries. If you want to learn how the TikTok team improved their app experience to achieve better business performance, please read our business article here.
Intro
TikTok is one of the most popular community-driven entertainment platforms with 1 billion people across the globe publishing and browsing video content every day.
A diverse user base naturally means diverse network bandwidth conditions and devices with different screen sizes, available memory and processing power. All users want a smooth, responsive app experience, no matter which device they use. If the app is slow to load, or playback gets stuck, users will feel frustrated and might abandon the app altogether. To avoid issues like these, the TikTok team continuously tracks the overall app performance through ongoing data monitoring, peer benchmarks, and user surveys.
TikTok is constantly introducing new features. But a rapid increase in functionality sometimes leads to an upsurge in technical requirements. The engineering team identified three reasons that slowed down the app : janky frames, video playback lag, and network issues. To solve these issues, the TikTok team looked to Android tools to start their app improvement journey.
From Discovery to Solution
Reducing app startup time, a smoother user experience with reduced jank and better video playback experience were three major goals that the team prioritized. They also discussed how to measure the effects of performance optimization to prevent the occurrence of regression.
1. Faster startup: refactor startup framework
App startup time is one of the metrics in Android Vitals. Making sure the app startup time is no longer than the Android Vital’s recommendation is the best way to ensure the app loads and starts responding to user activity as quickly as possible. The App Startup library is an Android Jetpack library to help developers initialize app components simply and efficiently.
The team studied the App Startup library in depth and refactored the app's startup framework to achieve on-demand loading and meticulous scheduling of components. In order to further reduce the execution time of creating Views on the main thread, the team even used a background thread to load View components asynchronously, thus improving the overall speed of app startup.
TikTok used Simpleperf to analyze the code execution time, and Android Studio's Profiler to monitor the usage of resources such as memory, CPU, and network to optimize I/O, threads, and resource locks.
2. Smoother user interface
To ensure a smoother user interface, the team needed to tackle two challenges: 1) simplify the View hierarchy, so that the app only renders what is necessary on screen, and 2) reduce the number of task executions in each frame so that the app can have a steady frame rate.
The TikTok team used the Layout Inspector in Android Studio to pinpoint the unnecessary layout contents. The layout boundaries of each View are clearly visible in the inspector, so the team can easily simplify the View hierarchy of the interface and reduce excessive and unnecessary content drawing.
In many cases, TikTok used doFrame() to perform frame-by-frame tasks. Trying to fit too much work in a single frame will inevitably cause a jank. TikTok's approach was to use allocation algorithms to distribute tasks into different frames to ensure that the application has a steady frame rate.
3. Better video playback experience: reuse resources
TikTok users can create audio and video content in various ways, and different codecs are used to play different types of content. Android provides the MediaCodec class to help access the underlying codec. To further improve the speed of video playback, it is good practice to provide different media player instances for different codecs. The TikTok team created a pool of media player instances throughout the application to neatly provide for various media contents. They even run each media player instance in different threads to minimize interference between one another
Network connection speed is another contributor to video lag . The team tested different solutions, including optimizing connections and reusing sockets, and developed algorithms to dynamically adjust buffer length when streaming content to reduce lag during playback.
They also used on-device video super-resolution to generate high-resolution frames based on low-resolution video content, further improving the quality of video playback without increasing network pressure.
Preloading (loading the next video ahead of time) and pre-rendering (rendering the first frame of the video ahead of time) are critical components to ensure that users have a smooth experience when playing multiple videos in succession. TikTok drew a Surface in advance only adding it into the screen when it is actually needed, to reduce the pressure of drawing it on the spot.
4. Avoid regressions
The team continues to maintain a detailed understanding of performance and works to fine-tune elements when necessary. Luckily, Android has tools in place for this exact purpose, like Systrace to capture traces so developers can export system activities (including CPU scheduling, disk activities, and app threads) for detailed analysis. The team also relies heavily on tools like Perfetto and Android Studio CPU profiler to track the execution time of various events, especially for I/O and class loading.
Better Performance, Better Experience
TikTok creatively leveraged the Android toolchain to track, quantify, and optimize their app’s performance for its business priorities, resulting in improved user experience and an increase in user satisfaction
The app startup time was reduced by 45%, and the smoothness (the chance of the frame rate being lower than the target value) has been optimized by 49%. When playing a video, the first frame of the video appeared 41% faster, and the chance of video lag was reduced by 27%.
Users are now more willing to use TikTok: active days per user in 30 days increased by 1%as did the average of session duration. User surveys and TikTok’s rating in Google Play also show a significant increase in user satisfaction.
The Next Stage for TikTok
By constantly optimizing app performance and adapting to the latest Android 13 platform, TikTok has created a more seamless app experience, encouraging more users to discover, create, and share the content they love.
With more than 250 million active large-screen Android devices globally, the team has also been focusing on large-screen devices, including foldable devices. By adopting the app to large screens, the team has brought a more immersive experience to TikTok users.
To learn more about how TikTok optimized its Android app to improve user experience and business performance, read the article here.
Get Guidance on Performance
To learn how you can get started to inspect, improve and monitor your app's performance visit our developer guide. The fastest way to improve your app's launch speed is by adding a baseline profile to your next release.
Posted by Amanda Alexander, Product Manager, Android
Android Jetpack is a key pillar of Modern Android Development. It is a suite of over 100 libraries, tools and guidance to help developers follow best practices, reduce boilerplate code, and write code that works consistently across Android versions and devices so that you can focus on building unique features for your app.
Most apps in Google Play use Jetpack for app architecture. Today, over 90% of the top 1000 apps use Jetpack.
Below we’ll cover updates in three major areas of Jetpack:
Architecture Libraries and Guidance
Performance Optimization of Applications
User Interface Libraries and Guidance
And then conclude with some additional key updates.
1. Architecture Libraries and Guidance
App architecture libraries and components ensure that apps are robust, testable, and maintainable.
Data Persistence
Room is the recommended data persistence layer which provides an abstraction layer over SQLite, allowing for increased usability and safety over the platform.
In Room 2.4, support for Kotlin Symbol Processing (KSP) moved to stable. KSP showed a 2x speed improvement over KAPT in our benchmarks of Kotlin code. Room 2.4 also adds built-in support for enums and RxJava3 and fully supports Kotlin 1.6.
Room 2.5 includes the beginning of a full Kotlin rewrite. This change sets the foundation for future Kotlin-related improvements while still being binary compatible with the previous version written in the Java programming language. There is also built-in support for Paging 3.0 via the room-paging artifact which allows Room queries to return PagingSource objects. Additionally, developers can now perform JOIN queries without the need to define additional data structures since Room now supports relational query methods using multimap (nested map and array) return types.
@Query("SELECT * FROM Artist
JOIN Song ON Artist.artistName =
Song.songArtistName")
fun getArtistToSongs(): Map<Artist, List<Song>>
Relational query methods using multimap return types
Database migrations are now simplified with updates to AutoMigrations, with added support for additional annotations and properties. A new AutoMigration property on the @Database annotation can be used to declare which versions to auto migrate to and from. And when Room needs additional information regarding table and column modifications, the @AutoMigration annotation can be used to specify the inputs.
Database(
version = MyDb.LATEST_VERSION,
autoMigrations = {
@AutoMigration(from = 1, to = 2,
spec = MyDb.MyMigration.class),
@AutoMigration(from = 2, to = 3)
}
)
public abstract class MyDb
extends RoomDatabase {
...
DataStore
The DataStore library is a robust data storage solution that addresses issues with SharedPreferences. To better understand how to use this powerful replacement for many SharedPreferences use cases, you can check out a series of videos and articles in Modern Android Development Skills: DataStore which includes guidance on testing your app’s usage of the library, using it with dependency injection, and migrating from SharedPreference to Proto DataStore.
Incremental Data Fetching
The Paging library allows you to load and display small chunks of data to improve network and system resource consumption. App data can be loaded gradually and gracefully within RecyclerViews or Compose lazy lists.
Paging 3.1 provides stable support for Rx and Guava integrations, which provide Java alternatives to Paging’s native use of Kotlin coroutines. This version also has improved handling of invalidation race conditions with a new return type, LoadResult.Invalid, to represent invalid or stale data. There is also improved handling of no-op loads and operations on empty pages with the new onPagesPresented and addOnPagesUpdatedListener APIs.
The Navigation library is a framework for moving between destinations in an app.
The Navigation component is now integrated into Jetpack Compose via the new navigation-compose artifact which allows for composable functions to be used as destinations in your app.
The Multiple Back Stacks feature has improved to make it easier to remember state. NavigationUI now automatically saves and restores the state of popped destinations, meaning developers can support multiple back stacks without any code changes.
Large screen support was enhanced with the navigation-fragment artifact providing a prebuilt implementation of a two-pane layout in AbstractListDetailFragment. This fragment uses a SlidingPaneLayout to manage a list pane – managed by your subclass – and a detail pane, which uses a NavHostFragment.
All Navigation artifacts have been rewritten in Kotlin and feature improved nullability of classes using generics – such as NavType subclasses.
Opinionated Architecture Guidance
To learn more about how our key architecture libraries work together, you can view a collection of videos and articles covering best practices for modern Android development in a series called Modern Android Development Skills: Architecture.
2. Performance Optimization of Applications
Using performance libraries allows you to build performant apps and identify optimizations to maintain high performance, resulting in better end-user experiences.
Improving Start-up Times
App speed can have a big impact on a user’s experience, particularly when using apps right after installation. To improve that first time experience, we created Baseline Profiles. Baseline Profiles allow apps and libraries to provide the Android run-time with metadata about code path usage, which it uses to prioritize ahead-of-time compilation. This profile data is aggregated across libraries and lands in an app’s APK as a baseline.prof file, which is then used at install time to partially pre-compile the app and its statically-linked library code. This can make your apps load faster and reduce dropped frames the first time a user interacts with an app.
We’ve already started leveraging Baseline Profiles at Google. The Play Store app saw a decrease in initial page rendering time on its search results page of 40% after adopting Baseline Profiles. Baseline profiles have also been added to popular libraries, such as Fragments and Compose, to help provide a better end-user experience. To create your own baseline profile, you need to use the Macrobenchmark library.
Instrumenting Your Application
The Macrobenchmark library helps developers better understand app performance by extending Jetpack’s benchmarking coverage to more complex use-cases, including app startup and integrated UI operations such as scrolling a RecyclerView or running animations. Macrobenchmark can also be used to generate Baseline Profiles.
Macrobenchmark has been updated to increase testing speed and has several new experimental features. It also now supports Custom trace-based timing measurements using TraceSectionMetric, which allows developers to benchmark specific sections of code. Additionally, the AudioUnderrunMetric now enables detection of audio buffer underruns to help understand audible jank.
BaselineProfileRule generates profiles to help with runtime optimizations. BaselineProfileRule works similarly to other macro benchmarks, where you represent user actions as code within lambdas. In the example below, the critical user journey that the compiler should optimize ahead of time is a cold start: opening the app’s landing activity from the launcher.
@ExperimentalBaselineProfilesApi
@RunWith(AndroidJUnit4::class)
class BaselineProfileGenerator {
@get:Rule
val baselineProfileRule = BaselineProfileRule()
@Test
fun startup() = baselineProfileRule.collectBaselineProfile(
packageName = "com.example.app"
) {
pressHome()
// This block defines the app's critical user journey. Here we are
// interested in optimizing for app startup, but you can also navigate
// and scroll through your most important UI.
startActivityAndWait()
}
}
For more details and a full guide on generating and using baseline profiles with Macrobenchmark, check our guidance on the Android Developers site.
Avoiding UI Stuttering / Jank
The new JankStats library helps you track and analyze performance problems in your app’s UI, including reports on dropped rendering frames – commonly referred to as “jank.” JankStats builds on top of existing Android platform APIs, such as FrameMetrics, but can be used back to API level 16.
The library also offers additional capabilities beyond those built into the platform: heuristics that help pinpoint causes of dropped frames, UI state that provides additional context in reports, and reporting callbacks that can be used to upload data for analysis.
Here’s a closer look at the three major aspects of JankStats:
Identifying Jank: This library uses internal heuristics to determine when jank has occurred, and uses that information to know when to issue jank reports so that developers have information on those problems to help analyze and fix the issues.
Providing UI Context: To make the jank reports more useful and actionable, the library provides a mechanism to help track the current state of the UI and user. This information is provided whenever reports are logged, so that developers can understand not only when problems occurred, but also what the user was doing at the time. This helps to identify problem areas in the application that can then be addressed. Some of this state is provided automatically by various Jetpack libraries, but developers are encouraged to provide their own app-specific state as well.
Reporting Results: On every frame, the JankStats client is notified via a listener with information about that frame, including how long the frame took to complete, whether it was considered jank, and what the UI context was during that frame. Clients are encouraged to aggregate and upload the data as they see fit for analysis that can help debug overall performance problems.
Adding Logging to your App
The Tracing library enables profiling of app performance by writing trace events to the system buffer. Tracing 1.1 supports profiling in non-debug builds back to API level 14, similar to the <profileable> manifest tag which was added in API level 29.
3. User Interface Libraries and Guidance
Several changes have been made to our UI libraries to provide better support for large-screen compatibility, foldables, and emojis.
Jetpack Compose
Jetpack Compose, Android’s modern toolkit for building native UI, has reached 1.2 beta today which has added several features to support more advanced use cases, including support for downloadable fonts, lazy layouts, and nested scrolling interoperability. Check out the What’s New in Jetpack Compose blog post to learn more.
Understanding Window State
The new WindowManager library helps developers adapt their apps to support multi-window environments and new device form factors by providing a common API surface with support back to API level 14.
The initial release targets foldable device use cases, including querying physical properties that affect how content should be displayed.
Jetpack’s SlidingPaneLayout component has been updated to use WindowManager’s smart layout APIs to avoid placing content in occluded areas, such as across a physical hinge.
Drag and Drop
The new DragAndDrop library also helps with new form factors and windowing modes by enabling developers to accept drag-and-drop data – both from inside and outside their app. DrapAndDrop includes a consistent drop target affordance and it supports back to API level 24.
Backporting New APIs to Older API Levels
The AppCompat library allows access to new APIs on older API versions of the platform, including backports of UI features such as dark mode.
AppCompat 1.4 integrates the Emoji2 library to bring default support for new emoji to all text-based views supported by AppCompat on API level 14 and above.
Custom locale selection is now supported back to API level 14. This feature enables manual persistence of locale settings across app starts, and supports automatic persistence via a service metadata flag. This tells the library to load the locales synchronously and recreate any running Activity as needed. On API level 33 and above, persistence is managed by the platform with no additional overhead.
Other key updates
Annotation
The Annotation library exposes metadata that helps tools and other developers understand your app's code. It provides familiar annotations like @NonNull that pair with lint checks to improve the correctness and usability of your code.
Annotation is migrating to Kotlin, so now developers using Kotlin will see more appropriate annotation targets, including @file.
Several highly-requested annotations have been added with corresponding lint checks. This includes annotations concerning method or function overrides, and the @DeprecatedSinceApi annotation which provides a corollary to @RequiresApi and discourages use beyond a certain API level.
Github
We now have over 100 projects in our GitHub! Several modules are open for developer contributions using the standard GitHub-based workflow:
Activity
AppCompat
Biometric
Collection
Compose Compiler
Compose Runtime
Core
DataStore
Fragment
Lifecycle
Navigation
Paging
Room
WorkManager
Check the landing page for more information on how we handle pull requests, and to get started building with Jetpack libraries.
This was a brief tour of all the changes in Jetpack over the past few months. For more details on each Jetpack library, check out the AndroidX release notes, quickly find relevant libraries with the API picker and watch the Google I/O talks for additional highlights.
Java is a trademark or registered trademark of Oracle and/or its affiliates.
Today we’re pushing the source to the Android Open Source Project (AOSP) and officially releasing the latest version of Android. Keep an eye out for Android 12 coming to a device near you starting with Pixel in the next few weeks and Samsung Galaxy, OnePlus, Oppo, Realme, Tecno, Vivo, and Xiaomi devices later this year.
As always, thank you for your feedback during Android 12 Beta! More than 225,000 of you tested our early releases on Pixel and devices from our partners, and you sent us nearly 50,000 issue reports to help improve the quality of the release. We also appreciate the many articles, discussions, surveys, and in-person meetings where you voiced your thoughts, as well as the work you’ve done to make your apps compatible in time for today’s release. Your support and contributions are what make Android such a great platform for everyone.
We’ll also be talking about Android 12 in more detail at this year’s Android Dev Summit, coming up on October 27-28. We’ve just released more information on the event, including a snapshot of the technical Android sessions; read on for more details later in the post.
What’s in Android 12 for developers?
Here’s a look at some of what’s new in Android 12 for developers. Make sure to check out the Android 12 developer site for details on all of the new features.
A new UI for Android
Material You - Android 12 introduces a new design language called Material You, helping you to build more personalized, beautiful apps. To bring all of the latest Material Design 3 updates into your apps, try an alpha version of Material Design Components and watch for support for Jetpack Compose coming soon.
Redesigned widgets - We refreshed app widgets to make them more useful, beautiful, and discoverable. Try them with new interactive controls, responsive layouts for any device, and dynamic colors to create a personalized but consistent look. More here.
Notification UI updates - We also refreshed notification designs to make them more modern and useful. Android 12 also decorates custom notifications with standard affordances to make them consistent with all other notifications. More here.
Stretch overscroll - To make scrolling your app’s content more smooth, Android 12 adds a new “stretch” overscroll effect to all scrolling containers. It’s a natural scroll-stop indicator that’s common across the system and apps. More here.
App launch splash screens - Android 12 also introduces splash screens for all apps. Apps can customize the splash screen in a number of ways to meet their unique branding needs. More here.
Performance
Faster, more efficient system performance - We reduced the CPU time used by core system services by 22% and the use of big cores by 15%. We’ve also improved app startup times and optimized I/O for faster app loading, and for database queries we’ve improved CursorWindow by as much as 49x for large windows.
Optimized foreground services - To provide a better experience for users, Android 12 prevents apps from starting foreground services while in the background. Apps can use a new expedited job in JobScheduler instead. More here.
More responsive notifications - Android 12’s restriction on notification trampolines helps reduce latency for apps started from a notification. For example, the Google Photos app now launches 34% faster after moving away from notification trampolines. More here.
Performance class - Performance Class is a set of device capabilities that together support demanding use-cases and higher quality content on Android 12 devices. Apps can check for a device’s performance class at runtime and take full advantage of the device’s performance. More here.
Faster machine learning - Android 12 helps you make the most of ML accelerators and always get the best possible performance through the Neural Networks API. ML accelerator drivers are also now updatable outside of platform releases, through Google Play services, so you can take advantage of the latest drivers on any compatible device.
Privacy
Privacy Dashboard - A new dashboard in Settings gives users better visibility over when your app accesses microphone, camera, and location data. More here.
Approximate location - Users have even more control over their location data, and they can grant your app access to approximate location even if it requests precise location. More here.
Microphone and camera indicators - Indicators in the status bar let users know when your app is using the device camera or microphone. More here.
Microphone and camera toggles - On supported devices, new toggles in Quick Settings make it easy for users to instantly disable app access to the microphone and camera. More here.
Nearby device permissions - Your app can use new permissions to scan for and pair with nearby devices without needing location permission. More here.
Better user experience tools
Rich content insertion - A new unified API lets you receive rich content in your UI from any source: clipboard, keyboard, or drag-and-drop. For back-compatibility, we’ve added the unified API to AndroidX. More here.
Support for rounded screen corners - Many modern devices use screens with rounded corners. To deliver a great UX on these devices, you can use new APIs to query for corner details and then manage your UI elements as needed. More here.
AVIF image support - Android 12 adds platform support for AV1 Image File Format (AVIF). AVIF takes advantage of the intra-frame encoded content from video compression to dramatically improve image quality for the same file size when compared to older image formats, such as JPEG.
Compatible media transcoding - For video, HEVC format offers significant improvements in quality and compression and we recommend that all apps support it. For apps that can’t, the compatible media transcoding feature lets your app request files in AVC and have the system handle the transcoding. More here.
Easier blurs, color filters and other effects - new APIs make it easier to apply common graphics effects to your Views and rendering hierarchies. You can use RenderEffect to apply blurs, color filters, and more to RenderNodes or Views. You can also create a frosted glass effect for your window background using a new Window.setBackgroundBlurRadius() API, or use blurBehindRadius to blur all of the content behind a window.
Enhanced haptic experiences - Android 12 expands the tools you can use to create informative haptic feedback for UI events, immersive and delightful effects for gaming, and attentional haptics for productivity. More here.
New camera effects and sensor capabilities - New vendor extensions let your apps take advantage of the custom camera effects built by device manufacturers—bokeh, HDR, night mode, and others. You can also use new APIs to take full advantage of ultra high-resolution camera sensors that use Quad / Nona Bayer patterns. More here.
Better debugging for native crashes - Android 12 gives you more actionable diagnostic information to make debugging NDK-related crashes easier. Apps can now access detailed crash dump files called tombstones through the App Exit Reasons API.
Android 12 for Games - With Game Mode APIs, you can react to the players' performance profile selection for your game - like better battery life for a long commute, or performance mode to get peak frame rates. Play as you download will allow game assets to be fetched in the background during install, getting your players into gameplay faster.
Get your apps ready for Android 12
Now with today’s public release of Android 12, we’re asking all Android developers to finish your compatibility testing and publish your updates as soon as possible, to give your users a smooth transition to Android 12.
To test your app for compatibility, just install it on a device running Android 12 and work through the app flows looking for any functional or UI issues. Review the Android 12 behavior changes for all apps to focus on areas where your app could be affected. Here are some of the top changes to test:
Privacy dashboard — Use this new dashboard in Settings to check your app’s accesses to microphone, location, and other sensitive data, and consider providing details to users on the reasons. More here.
Microphone & camera indicators — Android 12 shows an indicator in the status bar when an app is using the camera or microphone. Make sure this doesn’t affect your app’s UI. More here.
Microphone & camera toggles — Try using the new toggles in Quick Settings to disable microphone and camera access for apps and ensure that your app handles the change properly. More here.
Clipboard read notification — Watch for toast notifications when your app reads data from the clipboard unexpectedly. Remove unintended accesses. More here.
Stretch overscroll — Try your scrolling content with the new “stretch” overscroll effect and ensure that it displays as expected. More here.
App splash screens — Launch your app from various flows to test the new splash screen animation. If necessary, you can customize it. More here.
Keygen changes — Several deprecated BouncyCastle cryptographic algorithms are removed in favor of Conscrypt versions. If your app uses a 512-bit key with AES, you’ll need to use one of the standard sizes supported by Conscrypt. More here.
Remember to test the libraries and SDKs in your app for compatibility. If you find any SDK issues, try updating to the latest version of the SDK or reaching out to the developer for help.
Tune in to Android Dev Summit to learn about Android 12 and more!
The #AndroidDevSummit is back! Join us October 27-28 to hear about the latest updates in Android development, including Android 12. This year’s theme is excellent apps, across devices; tune in later this month to learn more about the development tools, APIs and technology to help you be more productive and create better apps that run across billions of devices, including tablets, foldables, wearables, and more.
We’ve just released more information on the event, including a snapshot of the 30+ technical Android sessions; you can take a look at some of those sessions here, and start planning which talks you want to check out. Over the coming weeks, we’ll be asking you to share your top #AskAndroid questions, to be answered live by the team during the event.
The show kicks off at 10 AM PT on October 27 with The Android Show, a 50-minute technical keynote where you’ll hear all the latest news and updates for Android developers. You can learn more and sign up for updates here.