Tag Archives: statistics

AutoBNN: Probabilistic time series forecasting with compositional bayesian neural networks

Time series problems are ubiquitous, from forecasting weather and traffic patterns to understanding economic trends. Bayesian approaches start with an assumption about the data's patterns (prior probability), collecting evidence (e.g., new time series data), and continuously updating that assumption to form a posterior probability distribution. Traditional Bayesian approaches like Gaussian processes (GPs) and Structural Time Series are extensively used for modeling time series data, e.g., the commonly used Mauna Loa CO2 dataset. However, they often rely on domain experts to painstakingly select appropriate model components and may be computationally expensive. Alternatives such as neural networks lack interpretability, making it difficult to understand how they generate forecasts, and don't produce reliable confidence intervals.

To that end, we introduce AutoBNN, a new open-source package written in JAX. AutoBNN automates the discovery of interpretable time series forecasting models, provides high-quality uncertainty estimates, and scales effectively for use on large datasets. We describe how AutoBNN combines the interpretability of traditional probabilistic approaches with the scalability and flexibility of neural networks.


AutoBNN

AutoBNN is based on a line of research that over the past decade has yielded improved predictive accuracy by modeling time series using GPs with learned kernel structures. The kernel function of a GP encodes assumptions about the function being modeled, such as the presence of trends, periodicity or noise. With learned GP kernels, the kernel function is defined compositionally: it is either a base kernel (such as Linear, Quadratic, Periodic, Matérn or ExponentiatedQuadratic) or a composite that combines two or more kernel functions using operators such as Addition, Multiplication, or ChangePoint. This compositional kernel structure serves two related purposes. First, it is simple enough that a user who is an expert about their data, but not necessarily about GPs, can construct a reasonable prior for their time series. Second, techniques like Sequential Monte Carlo can be used for discrete searches over small structures and can output interpretable results.

AutoBNN improves upon these ideas, replacing the GP with Bayesian neural networks (BNNs) while retaining the compositional kernel structure. A BNN is a neural network with a probability distribution over weights rather than a fixed set of weights. This induces a distribution over outputs, capturing uncertainty in the predictions. BNNs bring the following advantages over GPs: First, training large GPs is computationally expensive, and traditional training algorithms scale as the cube of the number of data points in the time series. In contrast, for a fixed width, training a BNN will often be approximately linear in the number of data points. Second, BNNs lend themselves better to GPU and TPU hardware acceleration than GP training operations. Third, compositional BNNs can be easily combined with traditional deep BNNs, which have the ability to do feature discovery. One could imagine "hybrid" architectures, in which users specify a top-level structure of Add(Linear, Periodic, Deep), and the deep BNN is left to learn the contributions from potentially high-dimensional covariate information.

How might one translate a GP with compositional kernels into a BNN then? A single layer neural network will typically converge to a GP as the number of neurons (or "width") goes to infinity. More recently, researchers have discovered a correspondence in the other direction — many popular GP kernels (such as Matern, ExponentiatedQuadratic, Polynomial or Periodic) can be obtained as infinite-width BNNs with appropriately chosen activation functions and weight distributions. Furthermore, these BNNs remain close to the corresponding GP even when the width is very much less than infinite. For example, the figures below show the difference in the covariance between pairs of observations, and regression results of the true GPs and their corresponding width-10 neural network versions.

Comparison of Gram matrices between true GP kernels (top row) and their width 10 neural network approximations (bottom row).
Comparison of regression results between true GP kernels (top row) and their width 10 neural network approximations (bottom row).

Finally, the translation is completed with BNN analogues of the Addition and Multiplication operators over GPs, and input warping to produce periodic kernels. BNN addition is straightforwardly given by adding the outputs of the component BNNs. BNN multiplication is achieved by multiplying the activations of the hidden layers of the BNNs and then applying a shared dense layer. We are therefore limited to only multiplying BNNs with the same hidden width.


Using AutoBNN

The AutoBNN package is available within Tensorflow Probability. It is implemented in JAX and uses the flax.linen neural network library. It implements all of the base kernels and operators discussed so far (Linear, Quadratic, Matern, ExponentiatedQuadratic, Periodic, Addition, Multiplication) plus one new kernel and three new operators:

  • a OneLayer kernel, a single hidden layer ReLU BNN,
  • a ChangePoint operator that allows smoothly switching between two kernels,
  • a LearnableChangePoint operator which is the same as ChangePoint except position and slope are given prior distributions and can be learnt from the data, and
  • a WeightedSum operator.

WeightedSum combines two or more BNNs with learnable mixing weights, where the learnable weights follow a Dirichlet prior. By default, a flat Dirichlet distribution with concentration 1.0 is used.

WeightedSums allow a "soft" version of structure discovery, i.e., training a linear combination of many possible models at once. In contrast to structure discovery with discrete structures, such as in AutoGP, this allows us to use standard gradient methods to learn structures, rather than using expensive discrete optimization. Instead of evaluating potential combinatorial structures in series, WeightedSum allows us to evaluate them in parallel.

To easily enable exploration, AutoBNN defines a number of model structures that contain either top-level or internal WeightedSums. The names of these models can be used as the first parameter in any of the estimator constructors, and include things like sum_of_stumps (the WeightedSum over all the base kernels) and sum_of_shallow (which adds all possible combinations of base kernels with all operators).

Illustration of the sum_of_stumps model. The bars in the top row show the amount by which each base kernel contributes, and the bottom row shows the function represented by the base kernel. The resulting weighted sum is shown on the right.

The figure below demonstrates the technique of structure discovery on the N374 (a time series of yearly financial data starting from 1949) from the M3 dataset. The six base structures were ExponentiatedQuadratic (which is the same as the Radial Basis Function kernel, or RBF for short), Matern, Linear, Quadratic, OneLayer and Periodic kernels. The figure shows the MAP estimates of their weights over an ensemble of 32 particles. All of the high likelihood particles gave a large weight to the Periodic component, low weights to Linear, Quadratic and OneLayer, and a large weight to either RBF or Matern.

Parallel coordinates plot of the MAP estimates of the base kernel weights over 32 particles. The sum_of_stumps model was trained on the N374 series from the M3 dataset (insert in blue). Darker lines correspond to particles with higher likelihoods.

By using WeightedSums as the inputs to other operators, it is possible to express rich combinatorial structures, while keeping models compact and the number of learnable weights small. As an example, we include the sum_of_products model (illustrated in the figure below) which first creates a pairwise product of two WeightedSums, and then a sum of the two products. By setting some of the weights to zero, we can create many different discrete structures. The total number of possible structures in this model is 216, since there are 16 base kernels that can be turned on or off. All these structures are explored implicitly by training just this one model.

Illustration of the "sum_of_products" model. Each of the four WeightedSums have the same structure as the "sum_of_stumps" model.

We have found, however, that certain combinations of kernels (e.g., the product of Periodic and either the Matern or ExponentiatedQuadratic) lead to overfitting on many datasets. To prevent this, we have defined model classes like sum_of_safe_shallow that exclude such products when performing structure discovery with WeightedSums.

For training, AutoBNN provides AutoBnnMapEstimator and AutoBnnMCMCEstimator to perform MAP and MCMC inference, respectively. Either estimator can be combined with any of the six likelihood functions, including four based on normal distributions with different noise characteristics for continuous data and two based on the negative binomial distribution for count data.

Result from running AutoBNN on the Mauna Loa CO2 dataset in our example colab. The model captures the trend and seasonal component in the data. Extrapolating into the future, the mean prediction slightly underestimates the actual trend, while the 95% confidence interval gradually increases.

To fit a model like in the figure above, all it takes is the following 10 lines of code, using the scikit-learn–inspired estimator interface:

import autobnn as ab

model = ab.operators.Add(
    bnns=(ab.kernels.PeriodicBNN(width=50),
          ab.kernels.LinearBNN(width=50),
          ab.kernels.MaternBNN(width=50)))

estimator = ab.estimators.AutoBnnMapEstimator(
    model, 'normal_likelihood_logistic_noise', jax.random.PRNGKey(42),
    periods=[12])

estimator.fit(my_training_data_xs, my_training_data_ys)
low, mid, high = estimator.predict_quantiles(my_training_data_xs)


Conclusion

AutoBNN provides a powerful and flexible framework for building sophisticated time series prediction models. By combining the strengths of BNNs and GPs with compositional kernels, AutoBNN opens a world of possibilities for understanding and forecasting complex data. We invite the community to try the colab, and leverage this library to innovate and solve real-world challenges.


Acknowledgements

AutoBNN was written by Colin Carroll, Thomas Colthurst, Urs Köster and Srinivas Vasudevan. We would like to thank Kevin Murphy, Brian Patton and Feras Saad for their advice and feedback.

Source: Google AI Blog


RLiable: Towards Reliable Evaluation & Reporting in Reinforcement Learning

Reinforcement learning (RL) is an area of machine learning that focuses on learning from experiences to solve decision making tasks. While the field of RL has made great progress, resulting in impressive empirical results on complex tasks, such as playing video games, flying stratospheric balloons and designing hardware chips, it is becoming increasingly apparent that the current standards for empirical evaluation might give a false sense of fast scientific progress while slowing it down.

To that end, in “Deep RL at the Edge of the Statistical Precipice”, accepted as an oral presentation at NeurIPS 2021, we discuss how statistical uncertainty of results needs to be considered, especially when using only a few training runs, in order for evaluation in deep RL to be reliable. Specifically, the predominant practice of reporting point estimates ignores this uncertainty and hinders reproducibility of results. Related to this, tables with per-task scores, as are commonly reported, can be overwhelming beyond a few tasks and often omit standard deviations. Furthermore, simple performance metrics like the mean can be dominated by a few outlier tasks, while the median score would remain unaffected even if up to half of the tasks had performance scores of zero. Thus, to increase the field's confidence in reported results with a handful of runs, we propose various statistical tools, including stratified bootstrap confidence intervals, performance profiles, and better metrics, such as interquartile mean and probability of improvement. To help researchers incorporate these tools, we also release an easy-to-use Python library RLiable with a quickstart colab.

Statistical Uncertainty in RL Evaluation
Empirical research in RL relies on evaluating performance on a diverse suite of tasks, such as Atari 2600 video games, to assess progress. Published results on deep RL benchmarks typically compare point estimates of the mean and median scores aggregated across tasks. These scores are typically relative to some defined baseline and optimal performance (e.g., random agent and “average” human performance on Atari games, respectively) so as to make scores comparable across different tasks.

In most RL experiments, there is randomness in the scores obtained from different training runs, so reporting only point estimates does not reveal whether similar results would be obtained with new independent runs. A small number of training runs, coupled with the high variability in performance of deep RL algorithms, often leads to large statistical uncertainty in such point estimates.

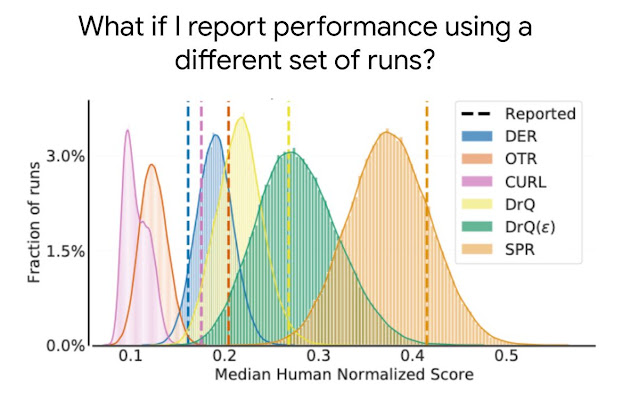
The distribution of median human normalized scores on the Atari 100k benchmark, which contains 26 games, for five recently published algorithms, DER, OTR, CURL, two variants of DrQ, and SPR. The reported point estimates of median scores based on a few runs in publications, as shown by dashed lines, do not provide information about the variability in median scores and typically overestimate (e.g., CURL, SPR, DrQ) or underestimate (e.g., DER) the expected median, which can result in erroneous conclusions.

As benchmarks become increasingly more complex, evaluating more than a few runs will be increasingly demanding due to the increased compute and data needed to solve such tasks. For example, five runs on 50 Atari games for 200 million frames takes 1000+ GPU days. Thus, evaluating more runs is not a feasible solution for reducing statistical uncertainty on computationally demanding benchmarks. While prior work has recommended statistical significance tests as a solution, such tests are dichotomous in nature (either “significant” or “not significant”), so they often lack the granularity needed to yield meaningful insights and are widely misinterpreted.

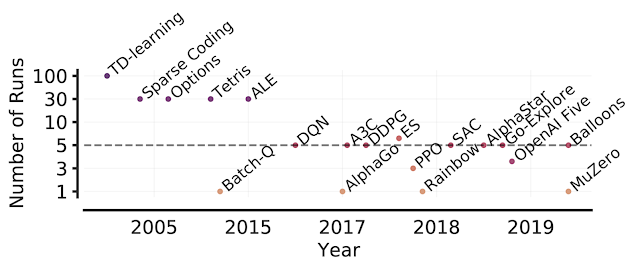
Number of runs in RL papers over the years. Beginning with the Arcade Learning Environment (ALE), the shift toward computationally-demanding benchmarks has led to the practice of evaluating only a handful of runs per task, increasing the statistical uncertainty in point estimates.

Tools for Reliable Evaluation
Any aggregate metric based on a finite number of runs is a random variable, so to take this into account, we advocate for reporting stratified bootstrap confidence intervals (CIs), which predict the likely values of aggregate metrics if the same experiment were repeated with different runs. These CIs allow us to understand the statistical uncertainty and reproducibility of results. Such CIs use the scores on combined runs across tasks. For example, evaluating 3 runs each on Atari 100k, which contains 26 tasks, results in 78 sample scores for uncertainty estimation.

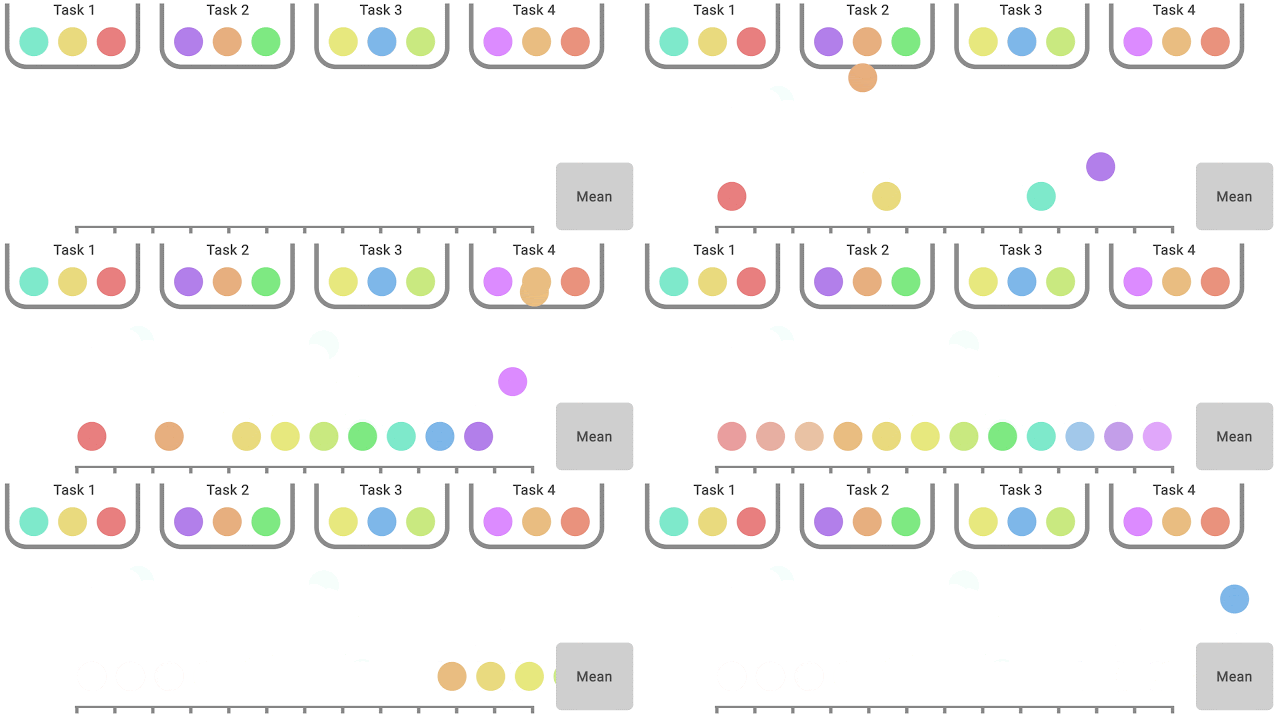
In each task, colored balls denote scores on different runs. To compute statified bootstrap CIs using the percentile method, bootstrap samples are created by randomly sampling scores with replacement proportionately from each task. Then, the distribution of aggregate scores on these samples is the bootstrapping distribution, whose spread around the center gives us the confidence interval.

Most deep RL algorithms often perform better on some tasks and training runs, but aggregate performance metrics can conceal this variability, as shown below.

Data with varied appearance but identical aggregate statistics. Source: Same Stats, Different Graphs.

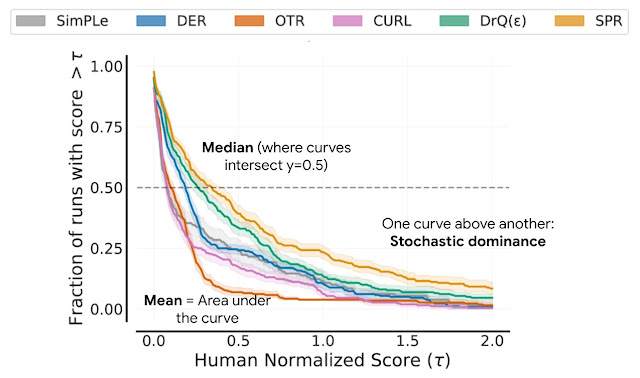
Instead, we recommend performance profiles, which are typically used for comparing solve times of optimization software. These profiles plot the score distribution across all runs and tasks with uncertainty estimates using stratified bootstrap confidence bands. These plots show the total runs across all tasks that obtain a score above a threshold (?) as a function of the threshold.

Performance profiles correspond to the empirical tail distribution of scores on runs combined across all tasks. Shaded regions show 95% stratified bootstrap confidence bands.

Such profiles allow for qualitative comparisons at a glance. For example, the curve for one algorithm above another means that one algorithm is better than the other. We can also read any score percentile, e.g., the profiles intersect y = 0.5 (dotted line above) at the median score. Furthermore, the area under the profile corresponds to the mean score.

While performance profiles are useful for qualitative comparisons, algorithms rarely outperform other algorithms on all tasks and thus their profiles often intersect, so finer quantitative comparisons require aggregate performance metrics. However, existing metrics have limitations: (1) a single high performing task may dominate the task mean score, while (2) the task median is unaffected by zero scores on nearly half of the tasks and requires a large number of training runs for small statistical uncertainty. To address the above limitations, we recommend two alternatives based on robust statistics: the interquartile mean (IQM) and the optimality gap, both of which can be read as areas under the performance profile, below.

IQM (red) corresponds to the area under the performance profile, shown in blue, between the 25 and 75 percentile scores on the x-axis. Optimality gap (yellow) corresponds to the area between the profile and horizontal line at y = 1 (human performance), for scores less than 1.

As an alternative to median and mean, IQM corresponds to the mean score of the middle 50% of the runs combined across all tasks. It is more robust to outliers than mean, a better indicator of overall performance than median, and results in smaller CIs, and so, requires fewer runs to claim improvements. Another alternative to mean, optimality gap measures how far an algorithm is from optimal performance.

IQM discards the lowest 25% and highest 25% of the combined scores (colored balls) and computes the mean of the remaining 50% scores.

For directly comparing two algorithms, another metric to consider is the average probability of improvement, which describes how likely an improvement over baseline is, regardless of its size. This metric is computed using the Mann-Whitney U-statistic, averaged across tasks.

Re-evaluating Evaluation
Using the above tools for evaluation, we revisit performance evaluations of existing algorithms on widely used RL benchmarks, revealing inconsistencies in prior evaluation. For example, in the Arcade Learning Environment (ALE), a widely recognized RL benchmark, the performance ranking of algorithms changes depending on the choice of aggregate metric. Since performance profiles capture the full picture, they often illustrate why such inconsistencies exist.

Median (left) and IQM (right) human normalized scores on the ALE as a function of the number of environment frames seen during training. IQM results in significantly smaller CIs than median scores.

On DM Control, a popular continuous control benchmark, there are large overlaps in 95% CIs of mean normalized scores for most algorithms.

DM Control Suite results, averaged across six tasks, on the 100k and 500k step benchmark. Since scores are normalized using maximum performance, mean scores correspond to one minus the optimality gap. The ordering of the algorithms is based on their claimed relative performance — all algorithms except Dreamer claimed improvement over at least one algorithm placed below them. Shaded regions show 95% CIs.

Finally, on Procgen, a benchmark for evaluating generalization in RL, the average probability of improvement shows that some claimed improvements are only 50-70% likely, suggesting that some reported improvements could be spurious.

Each row shows the probability that the algorithm X on the left outperforms algorithm Y on the right, given that X was claimed to be better than Y. Shaded region denotes 95% stratified bootstrap CIs.

Conclusion
Our findings on widely-used deep RL benchmarks show that statistical issues can have a large influence on previously reported results. In this work, we take a fresh look at evaluation to improve the interpretation of reported results and standardize experimental reporting. We’d like to emphasize the importance of published papers providing results for all runs to allow for future statistical analyses. To build confidence in your results, please check out our open-source library RLiable and the quickstart colab.

Acknowledgments
This work was done in collaboration with Max Schwarzer, Aaron Courville and Marc G. Bellemare. We’d like to thank Tom Small for an animated figure used in this post. We are also grateful for feedback by several members of the Google Research, Brain Team and DeepMind.

Source: Google AI Blog


Metrics, spikes, and uncertainty: Open source contribution during a global pandemic

Welcome to the second edition of our Open Source Programs Office’s (OSPO) annual open source transparency report. In last year's report on 2019 open source activity, we focused on discovering baselines and trends for Alphabet’s open source activities. However, this past year was unlike any other in recent history. While many continue to investigate the impact of the global pandemic on work, productivity, and behavior, we wanted to understand the pandemic’s impact on Alphabet’s participation in open source.

Our mission within OSPO is to bring the value of open source to Google and the resources of Google to open source. While open source software remains a critical component of our infrastructure, products, and services, in 2020 we increased our focus on connecting with peers and supporting our extended communities across open source ecosystems. In addition to numerous Alphabet-led initiatives and programs, our open source community provided resources, funding, and technical support for projects and communities impacted by the global pandemic.

Before we jump into the data, we want to acknowledge that broad generalizations will never capture the complete context or complexities of personal experience. With these limitations in mind, we will attempt to aggregate what we learned from this past year and explore how our priorities, programs, and adjustments may have affected our measurements and reporting. For more details on the data source and methodology, see the “about this data” section below.

Open source engagement increased as employees moved to their homes

In March 2020, Alphabet closed our offices and required most employees to work from home. In addition to changing workplaces, we adapted our internship program for virtual participation, focusing many technical projects on open source. This inflection point directly impacted our open source contributor behavior, as observed by monthly active user trends—defined as users that logged any activity in a given month:
  • Before March 2020, our GitHub monthly active user counts were relatively stable: In any given month during 2019, about 45% of our yearly active contributing population logged activity on GitHub. Per month in 2019, this value was fairly consistent, with a relative standard deviation of 3%.
  • More GitHub users were active after March 2020: Starting in March 2020, our monthly active users grew by more than 20% and then continued to grow into April through July with the arrival of our interns. In addition to growth, activity fluctuated more dramatically with a relative standard deviation of 19%. Removing interns, this value dropped to 13%—still significantly higher than 2019.
  • Git-on-borg user patterns remained stable: On git-on-borg—our internal production Git service (more details below), more than 50% of users counted in this analysis were active per month. Activity levels were fairly stable in 2020 with a relative standard deviation of 3%, indicating that our behavior on git-on-borg was less impacted by pandemic-related changes. Note that less than 10% of our 2020 open source interns were active on git-on-borg as most worked on GitHub.
To identify more context behind this change in behavior, we explored our population, projects, and programs, in and around open source.
This chart of monthly active GitHub users shows a bump of activity starting in March 2020 and then continuing April through July with the arrival of interns.
This chart shows Alphabet’s monthly active users on GitHub, split by total, full-time employees, and interns.

Population: Our population of contributors grew as our composition shifted

In 2020, more than 10% of Alphabet full-time employees (FTEs) actively contributed to open source projects. This percentage has remained roughly consistent over the last five years, indicating that our open source contribution has scaled with the growth of Alphabet.

In addition to our FTEs, some of Alphabet's vendors, independent contractors, temporary staff, and interns have also contributed to open source during their tenures. From 2015-2019, this group represented about 3-5% of our total population of open source contributors. In 2020, this ratio doubled to 10% as many interns shifted to focus on open source. As a result, interns represented about 9% of our overall open source contributing population in 2020.
In 2020, more than 10% of Alphabet full-time employees (FTEs) actively contributed to open source projects. In addition to our FTEs, Alphabet's vendors, independent contractors, temporary staff, and interns have also contributed to open source during their tenures. From 2015-2019, this group represented about 3-5% of our total population of open source contributors. However in 2020, this ratio doubled to 10%.
This chart shows the aggregate per year counts of Alphabet employees, vendors, contractors, temps, and interns contributing to open source.

Scope: We created and interacted with more repositories and projects

Within Google-managed organizations, we created more than 2,000 new public repositories on GitHub, bringing our total active public repositories to over 9,000 on GitHub and over 1,500 on git-on-borg. While many of these new repositories were created within existing projects or to extend functionality of our products, more than 20% of our new GitHub repositories were created to host our interns’ open source projects. Moving forward, we anticipate that our total public repositories under management will stabilize or even shrink as we refine our depreciation and archival policies. In addition to supporting our own projects:
  • We engaged with more repositories on GitHub: In 2020, contributors at Alphabet interacted with more than 90,000 repositories on GitHub, pushing commits and/or opening pull requests on over 50,000 repositories. Removing passive interactions (WatchEvents or “stars”), we actively engaged with over 75,000 repositories in 2020.
  • We surpassed our growth rates from 2019. Across all metrics listed above, we engaged with 25% more repositories than in 2019—a growth rate significantly higher than last year’s growth rate of 15%-18%. These rates are not impacted by removing the repositories that supported our interns.
  • We continue to invest time in projects outside of Google: Consistent with our 2019 report, on GitHub more than 75% of repositories with pull requests opened by Alphabet contributors were outside of Google-managed organizations.

Behavior: Contribution activities increased, elevated by our interns

To take a closer look at our behavior, we explored all event types across GitHub Archive, grouping events into the following categories:

Category groups

GitHub Event Types

Code

PushEvent, PullRequestEvent, ForkEvent

Code Review

PullRequestReviewEvent, PullRequestReviewCommentEvent, CommitCommentEvent

Issue

IssuesEvent, IssueCommentEvent

Maintenance and administration

MemberEvent, CreateEvent, DeleteEvent, ReleaseEvent, PublicEvent

Wiki/Doc

GollumEvent

Star

WatchEvent

Exploring trends across event types, we found that:
  • GitHub activity grew across all event types: This is not surprising given our growth in the contributing population and repository counts described above. More specifically, in 2020, contributors at Alphabet created more than 780,000 issue comments, and opened over 240,000 pull requests on GitHub. Compared to 2019, we generated 32% more issue comments and opened 50% more pull requests in 2020. Removing WatchEvents, in 2020 our overall activity on GitHub grew by more than 35%.
  • Interns bolstered our growth on GitHub: While in previous years, full-time Alphabet employees were responsible for over 97% of all reported activity on GitHub, in 2020 interns opened more than 10% of Alphabet’s total pull requests on this platform.
  • git-on-borg’s growth rate was consistent with 2019: Where our GitHub activity growth rates increased, our submitted and reviewed changes on git-on-borg grew by 17%, consistent with our 2018-2019 year-over-year growth on this platform and on GitHub. This consistent trajectory once again implies that individuals working on git-on-borg did not significantly change their behavior as a result of the global pandemic. Please note, that the activity pulled from git-on-borg for this analysis was only from Google managed projects where GitHub logs also included non-Google organizations and personal activity.
This chart of grouped GitHub events shows spikes of activity in July 2020 and October 2020, with the largest concentration of activity around code creation.
This chart shows per-month counts of activities initiated by the Alphabet community on GitHub.
Note: not showing “PullRequestReviewEvent”, which GitHub Archive started collecting in August 2020.

Changes: What drove this change in behavior?

While 2020 behavior cannot be separated from the impact of the global pandemic, we were curious if we could isolate specific programs and externalities that would explain the uptick in monthly active users and spikes in logged activities. Again, acknowledging the limitations of aggregate analysis, we found evidence that these measurements were impacted by:
  • Intern hosts: In May-Sept, we welcomed more than 1000 interns and set them to work on open source projects. In addition to intern-driven activities, teams that hosted interns had to interact with these projects in public channels, which contributed to additional individuals logging actions on GitHub between April and September.
  • Tenured employees. To investigate other drivers of the March 2020 uplift in GitHub monthly active users, we filtered out interns and individuals that were new to Alphabet in 2020, which led us to believe that this increase could mostly be attributed to existing employees increasing their time on GitHub.
  • Hacktoberfest: During Hacktoberfest (October 2020), we saw a significant spike in activity with the largest uptick concentrated in issue-related activities, as open source contributors at Alphabet responded to activities initiated during this event.
We also interviewed open source contributors around the organization to understand how their professional and personal open source activity may have been impacted due to COVID-19. Although each case was unique, common themes were:
  • Remote work: With most teams working remotely, some reported that they relied more heavily on asynchronous tooling for collaboration and code review, which would yield additional logged activities on hosting platforms.
  • Open source as a personal outlet: For others, open source provided a place to create and socialize outside of work. This trend was also reported in GitHub’s Octoberverse report on productivity which showed an uptick in open source activity outside of traditional work hours.
Please note, that Alphabet’s aggregate experience does not translate to behavioral or productivity trends in specific projects that we work on. For example, leading up to Kubernetes’ 1.19 release in May 2020, community leaders reported declining engagement, measured by a 15% decline in daily pull request reviews across Kubernetes organizations compared to the 2019 average.

Beyond code: We continue to invest in all aspects of open source

Alphabet relies on the health and availability of open source projects, and as such we continue to invest in security and sustainability across the supply chain, from respectful language updates in our own projects to:
  • Mentorship and community engagement: In its 16th year of the program, Google’s 2020 Summer of Code program had 1,106 students from 65 countries successfully complete the program under the guidance of over 2,000 mentors. In its second year, Season of Docs sponsored 87 technical writers working on 48 projects with the support of over 100 mentors. And with in-person events postponed until further notice, we launched the Google Open Source Live monthly series to connect with our extended community, hosting 5 events last year, 7 so far in 2021, and more planned in the final quarters of 2021.
  • Improving open source stability and security: Security challenges are never going to disappear, and we must work together to maintain the security of the open source software we collectively depend on. In 2020, Google co-founded the OpenSSF to collaborate on tools and frameworks to improve open source security. As part of this community, we released Criticality Score and provided significant contributions to project Scorecards to help users, contributors, companies, and communities generate relative criticality metrics for projects that they depend on. Additionally, in 2020 the OSS-Fuzz project nearly doubled the number of supported projects to more than 400 projects, and identified more than 25,000 bugs. In addition to the main effort, the Fuzz team hosted interns, launched the Atheris Python Fuzzer, and ramped up a FuzzBench service to help academic researchers run large scale experiments on their fuzzing tools.
Despite perpetual uncertainty, we will continue to invest in the open source ecosystem as we value the connection, collaboration and community even when we are kept apart by a global pandemic. Learn more about our open source initiatives at opensource.google.

About the data:

  • Data source: These data represent activities on repositories hosted on GitHub and our internal production Git service git-on-borg. These sources represent a subset of open source activity currently tracked by our OSPO.
    • GitHub: We continue to use GitHub Archive as the primary source for GitHub data, which is available as a public dataset on BigQuery. Alphabet activity within GitHub is identified by self-registered accounts, which we estimate underreports actual activity. This year we decided to generate this report from Monthly Tables instead of Yearly Tables in order to explore contribution patterns within the year.
    • git-on-borg: This is our primary platform for internal projects and some of our larger, long running public projects like Android and Chromium. While we continue to develop on this platform, most of our open source activity has moved to GitHub to increase exposure and encourage community growth.
    • Distinct event types: Note that git-on-borg and GitHub APIs produce distinct sets of events—as such we will report activity metrics per platform. Where GitHub Event logs capture a wide range of activity from code creation and review to issue creation and comments, the Gerrit Event stream (used by git-on-borg) only captures code changes and reviews.
  • Driven by humans: We have created many automated bots and systems that can propose changes on various hosting platforms. We have intentionally filtered these data to focus on human-initiated activities.
  • Business and personal: Activity on GitHub reflects a mixture of Alphabet projects, third party projects, experimental efforts, and personal projects. Our metrics report on all of the above unless otherwise specified.
  • Alphabet contributors: Please note that unless additional detail is specified, activity counts attributed to Alphabet open source contributors will include our full-time employees as well as our extended Alphabet community (temps, vendors, contractors, and interns).
  • Active counts: Where possible, we will show ‘active users’ defined by logged activity within a specified timeframe (i.e. in month, year, etc) and ‘active repositories’ as those that have not been archived.
  • Activity types: This year we explore GitHub activity types in more detail. Note that in some cases we have removed “Watch Events” or articulated this as passive engagement. Additionally, GitHub added an event type “PullRequestReviewEvent” that started logging activity in August 2020, but we chose to remove this from our charts and aggregate counts as it invalidates year over year comparisons.
By Sophia Vargas, Research Analyst – Google Open Source Programs Office

The Importance of A/B Testing in Robotics

Disciplines in the natural sciences, social sciences, and medicine all have to grapple with how to evaluate and compare results within the context of the continually changing real world. In contrast, a significant body of machine learning (ML) research uses a different method that relies on the assumption of a fixed world: measure the performance of a baseline model on fixed data sets, then build a new model aimed at improving on the baseline, and evaluate its performance (on the same fixed data) by comparing its performance to the baseline.

Research into robotics systems and their applications to the real world requires a rethinking of this experiment design. Even in controlled robotic lab environments, it is possible that real-world changes cause the baseline model to perform inconsistently over time, making it unclear whether new models’ performance is an improvement compared to the baseline, or just the result of unintentional, random changes in the experiment setup. As robotics research advances into more complex and challenging real-world scenarios, there is a growing need for both understanding the impact of the ever-changing world on baselines and developing systematic methods to generate informative and clear results.

In this post, we demonstrate how robotics research, even in the relatively controlled environment of a lab, is meaningfully affected by changes in the environment, and discuss how to address this fundamental challenge using random assignment and A/B testing. Although these are classical research methods, they are not generally employed by default in robotics research — yet, they are critical to producing meaningful and measurable scientific results for robotics in real-world scenarios. Additionally, we cover the costs, benefits, and other considerations of using these methods.

The Ever-Changing Real World in Robotics
Even in a robotics lab environment, which is designed to minimize all changes that are not experimental conditions, it is notoriously difficult to set up a perfectly reproducible experiment. Robots get bumped and are subject to wear and tear, lighting changes affect perception, battery charge influences the torque applied to motors — all things that can affect results in ways large and small.

To illustrate this on real robot data, we collected success rate data on one of our simplest setups — moving identical foam dice from one bin to another. For this task, we ran about 33k task trials on two robots over more than five months with the same software and ML model, and took the overall success rate of the last two weeks as baseline. We then measured the historic performance over time in this “very well controlled” environment.

Video of a real robot completing the task: moving identical foam dice from one bin to another.

Given that we did not purposefully change anything during data collection, one would expect the success rate to be statistically similar over time. And yet, this is not what was observed.

The y-axis represents the 95% confidence interval of % change in success rate relative to baseline. If the confidence intervals contain zero, that indicates the success rate is statistically similar to the success rate of baseline. Confidence intervals were computed using Jackknife, with Cochran-Mantel-Haenszel correction to remove operator bias.

Using the sequential data from the plot above, one might conclude that the model ran during weeks 13-14 performed best and that ran during weeks 9-10 performed the worst. One might also expect most, if not all, of the confidence intervals above to contain 0, but only one did. Because no changes were made at any time during these trials, this example effectively demonstrates the impact of unintentional, random real-world changes on even very simple setups. It’s also worth noting that having more trials per experiment wouldn’t remove these differences, instead they will more likely produce a narrower confidence interval making the impact more obvious.

However, what happens when one uses random assignment to compare results, grouping the data randomly rather than sequentially? To answer this, we randomly assigned the above data to the same number of groups for comparison with the baseline. This is equivalent to performing A/B testing where all groups receive the same treatment.

Looking at the chart, we observe that the confidence intervals include zero, indicating success similar to the baseline, as expected.

We performed similar studies with a few other robotics tasks, comparing between sequential and random assignments. They all yielded similar results.

We see that even with no intentional changes, there are statistically significant differences observed for sequential assignment, while random assignment shows the expected result of no statistically significant differences.

Considerations for A/B testing in robotics
While it’s clear based on the above that A/B testing with random assignment is an effective way to control for the unexplainable variance of the real world in robotics, there are some considerations when adopting this approach. Here are several, along with their accompanying pros, cons, and solutions:

  • Absolute vs relative performance: Each experiment needs to be measured against a baseline that is run concurrently. The relative performance metric between baseline and experiment is published with a confidence interval. The absolute performance metric (in baseline or experiment) is less informative, because it depends to an unknown degree on the state of the world when the measurement was taken. However, the statistical differences we’ve measured between the experiment and baseline are sound and robust to reproduction.
  • Data efficiency: With this approach, the baseline always needs to run in parallel with the experimental conditions so they can be compared against each other. Although this may seem wasteful, it is worth the cost when compared against the drawbacks of making an invalid inference against a stale baseline. Furthermore, as the number of random assignment experiments scale up, we can use a single baseline arm with multiple simultaneous experiment arms across independent factors leveraging Google’s overlapping experiment infrastructure. Data efficiency improves with scale.
  • Environmental biases: If there’s any external factor affecting performance overall (lighting, slicker surfaces, etc.), both the baseline and all experiment arms will encounter this factor with similar probability, so its effect will cancel if there’s no relative impact. If there is a correlation between environmental factors and experiment arms, this will show up as differences over time (each environmental factor accumulates in the episodes collected). This can substantially reduce or eliminate the need for effortful environmental resets, and lets us run lifelong experiments and still measure improvements across experimental arms.
  • Human biases: One advantage of random assignment is a reduction in biases introduced by humans. Since human operators cannot know which data sample gets routed to which arm of the experiment, it is harder to have biased experimenters influence any particular outcome.

The Path Forward
The A/B testing experiment framework has been successfully used for a long time in many scientific disciplines to measure performance against changing, unpredictable real-world environments. In this blog post, we show that robotics research can benefit from using this same methodology: it improves the quality and confidence of research results, and avoids the impossible task of perfectly controlling all elements of a fundamentally changing environment. Doing this well requires infrastructure to continuously operate robots, collect data, and tools to make the statistical framework easily accessible to researchers.

Acknowledgements
Arnab Bose, Tuna Toksoz, Yuheng Kuang, Anthony Brohan, Razvan Sudulescu developed the experiment infrastructure and conducted the research. Matthieu Devin suggested the A/A analysis to showcase the differences using existing data. Special thanks to Bill Heavlin, Chris Harris, Vincent Vanhoucke who provided invaluable feedback and support to the work.

Source: Google AI Blog


Google Summer of Code 2020 Statistics: Part 2

With the program nearing the end of the summer, it’s time for another round of updates!

Universities

The 1,198 students accepted into the GSoC 2020 program came from 550 universities, of which, 114 have students participating for the first time in GSoC.

Schools with the most accepted students for GSoC 2020:
University# of Accepted Students
Indian Institute of Technology, Roorkee48
Indian Institute of Technology, Kanpur27
International Institute of Information Technology, Hyderabad24
National Institute of Technology Karnataka, Surathkal23
Birla Institute of Technology and Science, Pilani (BITS Pilani)13
Indian Institute of Technology, Kharagpur13
Indian Institute of Technology (BHU), Varanasi11
University of Moratuwa11
National Institute of Technology, Hamirpur10
Amrita Vishwa Vidyapeetham, Amritapuri Campus10
University of Tokyo10
University Of Colombo School Of Computing (UCSC)10

Mentors

Each year we pore over gobs of data to extract some interesting statistics about the GSoC mentors. Here’s a quick synopsis of our 2020 crew:
  • Registered mentors: 3,592
  • Mentors with assigned student projects: 2,156
  • Mentors who have participated in GSoC for 10 or more years: 78
  • Mentors who have been a part of GSoC for 5 years or more: 199
  • Mentors that are former GSoC students: 533 (24.7%)
  • Mentors that have also been involved in the Google Code-in program: 405 (18.8%)
  • Percentage of new mentors: 34.18%
GSoC 2020 had an international representation with mentors from 67 countries around the world!

The global pandemic, COVID-19, brought additional challenges to this year’s GSoC program. Whether living with the virus, adjusting to shifting school and work schedules, or pivoting to a remote lifestyle, students and mentors have had to prioritize their safety and delicately balance their new way of life. Despite these unprecedented times, our students continue to push on and our mentors fully support our students by sharing their passion for open source, listening to their concerns and providing them with valuable advice. For that commitment, we would like to acknowledge and give thanks to all students and mentors in the GSoC 2020 program. Not even a pandemic can dampen your enthusiasm and tireless contributions to the open source community!

By Stephanie Taylor – Program Manager, Google Open Source Programs Office

Open source by the numbers at Google

At Google, open source is at the core of our infrastructure, processes, and culture. As such, participation in these communities is vital to our productivity. Within OSPO (Open Source Programs Office), our mission is to bring the value of open source to Google and the resources of Google to open source. To ensure our actions match our commitment, in this post we will explore a variety of metrics intended to increase context, transparency, and accountability across all of the communities we engage with.

Why we contribute: Open source has become a pervasive component in modern software development, and Google is no exception. We use thousands of open source projects across our internal infrastructure and products. As participants in the ecosystem, our intentions are twofold: give back to the communities we depend on as well as expand support for open source overall. We firmly believe in open source and its ability to bring together users, contributors, and companies alike to deliver better software.

The majority of Google’s open source work is done within one of two hosting platforms: GitHub and git-on-borg, Google’s production Git service which integrates with Gerrit for code review and access control. While we also allow individual usage of Bitbucket, GitLab, Launchpad, and other platforms, this analysis will focus on GitHub and git-on-borg. We will continue to explore how best to incorporate activity across additional channels.

A little context about the numbers you’ll read below:
  • Business and personal: While git-on-borg hosts both internal and external Google created repos, GitHub is a mixture of Google projects, experimental efforts and personal projects created by Googlers.
  • Driven by humans: We have created many automated bots and systems that can propose changes on both hosting platforms. We have intentionally filtered these data to ensure we are only showing human initiated activities.
  • GitHub data: We are using GH Archive as the primary source for GitHub data, which is currently available as a public dataset on BigQuery. Google activity within GitHub is identified by self registered accounts, which we anticipate under reports actual usage as employees acclimate to our policies.
  • Active counts: Where possible, we will show ‘active users’ and ‘active repositories’ defined by logged activity within each specified timeframe (for GH archive data, that’s any event type logged in the public GitHub event stream).
As numbers mean nothing without scale, let’s start by defining our applicable community: In 2019, more than 9% of Alphabet’s full time employees actively contributed to public repositories on git-on-borg and GitHub. While single digit, this percentage represents a portion of all full time Alphabet employees—from engineers to marketers to admins, across every business unit in Alphabet—and does not include those who contribute to open source projects outside of code. As our population has grown, so has our registered contributor base:
This chart shows the aggregate per year counts of Googlers active on public repositories hosted on GitHub and git-on-borg

What we create: As mentioned above, our contributing population works across a variety of Google, personal, and external repositories. Over the years, Google has released thousands of open source projects (many of which span multiple repositories) and ~2,600 are still active. Today, Google hosts over 8,000 public repositories on GitHub and more than 1,000 public repositories on git-on-borg. Over the last five years, we have doubled the number of public repos, growing our footprint by an average of 25% per year.

What we work on: In addition to our own repositories, we contribute to a wide pool of external projects. In 2019, Googlers were active in over 70,000 repositories on GitHub, pushing commits and/or opening pull requests on over 40,000 repositories. Note that more than 75% of the repos with Googler-opened pull requests were outside of Google-managed organizations (on GitHub).
This charts shows per year counts of activities initiated by Googlers on GitHub

What we contribute: For contribution volume on GitHub, we chose to focus on push events, opened, and merged pull requests instead of commits as this metric on its own is difficult to contextualize. Note that push events and pull requests typically include one or more commits per event. In 2019, Googlers created over 570,000 issues, opened over 150,000 pull requests, and created more than 36,000 push events on GitHub. Since 2015, we have doubled our annual counts of issues created and push events, and more than tripled the number of opened pull requests. Over the last five years, more than 80% of pull requests opened by Googlers have been closed and merged into active repositories.

How we spend our time: Combining these two classes of metrics—contributions and repos—provides context on how our contributors focus their time. On GitHub: in 2015, about 40% of our opened pull requests were concentrated in just 25 repositories. However, over the next four years, our activity became more distributed across a larger set of projects, with the top 25 repos claiming about 20% of opened pull requests in 2019. For us, this indicates a healthy expansion and diversification of interests, especially given that this activity represents both Google, as well as a community of contributors that happen to work at Google.
This chart splits the total per year counts of Googler created pull requests on GitHub by Top 25 repos vs the remainder ranked by number of opened pull requests per repo per year.

Open source contribution is about more than code

Every day, Google relies on the health and continuing availability of open source, and as such we actively invest in the security and sustainability of open source and its supply chain in three key areas:
  • Security: In addition to building security projects like OpenTitan and gVisor, Google’s OSS-Fuzz project aims to help other projects identify programming errors in software. As of the end of 2019, OSS-Fuzz had over 250 projects using the project, filed over 16,000 bugs, including 3,500 security vulnerabilities.
  • Community: Open source projects depend on communities of diverse individuals. We are committed to improving community sustainability and growth with programs like Google Summer of Code and Season of Docs. Over the last 15 years, about 15,000 students from over 105 countries have participated in Google Summer of Code, along with 25,000 mentors in more than 115 countries working on more than 680 open source projects.
  • Research: At the end of 2019, Google invested $1 million in open source research, partnering with researchers at UVM, with the goal to deepen understanding of how people, teams and organizations thrive in technology-rich settings, especially in open-source projects and communities.
Learn more about our open source initiatives at opensource.google.

By Sophia Vargas – Researcher, Google Open Source Programs Office

Exploring Faster Screening with Fewer Tests via Bayesian Group Testing


How does one find a needle in a haystack? At the turn of World War II, that question took on a very concrete form when doctors wondered how to efficiently detect diseases among those who had been drafted into the war effort. Inspired by this challenge, Robert Dorfman, a young statistician at that time (later to become Harvard professor of economics), proposed in a seminal paper a 2-stage approach to detect infected individuals, whereby individual blood samples first are pooled in groups of four before being tested for the presence or absence of a pathogen. If a group is negative, then it is safe to assume that everyone in the group is free of the pathogen. In that case, the reduction in the number of required tests is substantial: an entire group of four people has been cleared with a single test. On the other hand, if a group tests positive, which is expected to happen rarely if the pathogen’s prevalence is small, at least one or more people within that group must be positive; therefore, a few more tests to determine the infected individuals are needed.
Left: Sixteen individual tests are required to screen 16 people — only one person’s test is positive, while 15 return negative. Right: Following Dorfman’s procedure, samples are pooled into four groups of four individuals, and tests are executed on the pooled samples. Because only the second group tests positive, 12 individuals are cleared and only those four belonging to the positive group need to be retested. This approach requires only eight tests, instead of the 16 needed for an exhaustive testing campaign.
Dorfman’s proposal triggered many follow-up works with connections to several areas in computer science, such as information theory, combinatorics or compressive sensing, and several variants of his approach have been proposed, notably those leveraging binary splitting or side knowledge on individual infection probability rates. The field has grown to the extent that several sub-problems are recognized and deserving of an entire literature on their own. Some algorithms are tailored for the noiseless case in which tests are perfectly reliable, whereas some consider instead the more realistic case where tests are noisy and may produce false negatives or positives. Finally, some strategies are adaptive, proposing groups based on test results already observed (including Dorfman’s, since it proposes to re-test individuals that appeared in positive groups), whereas others stick to a non-adaptive setting in which groups are known beforehand or drawn at random.

In “Noisy Adaptive Group Testing using Bayesian Sequential Experimental Design”, we present an approach to group testing that can operate in a noisy setting (i.e., where tests can be mistaken) to decide adaptively by looking at past results which groups to test next, with the goal to converge on a reliable detection as quickly, and with as few tests, as possible. Large scale simulations suggest that this approach may result in significant improvements over both adaptive and non-adaptive baselines, and are far more efficient than individual tests when disease prevalence is low. As such, this approach is particularly well suited for situations that require large numbers of tests to be conducted with limited resources, as may be the case for pandemics, such as that corresponding to the spread of COVID-19. We have open-sourced the code to the community through our GitHub repo.

Noisy and Adaptive Group Testing in a Non-Asymptotic Regime
A group testing strategy is an algorithm that is tasked with guessing who, among a list of n people, carries a particular pathogen. To do so, the strategy provides instructions for pooling individuals into groups. Assuming a laboratory can execute k tests at a time, the strategy will form a kn pooling matrix that defines these groups. Once the tests are carried out, the results are used to decide whether sufficient information has been gathered to determine who is or is not infected, and if not, how to form new groups for another round of testing.

We designed a group testing approach for the realistic setting where the testing strategy can be adaptive and where tests are noisy — the probability that the test of an infected sample is positive (sensitivity) is less than 100%, as is the specificity, the probability that a non-infected sample returns negative.

Screening More People with Fewer Tests Using Bayesian Optimal Experimental Design
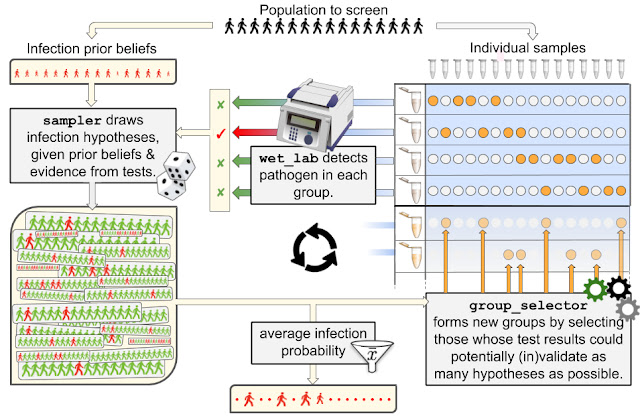
The strategy we propose proceeds the way a detective would investigate a case. They first form several hypotheses about who may or may not be infected, using evidence from all tests (if any) that have been carried out so far and prior information on the infection rate (a). Using these hypotheses, our detectives produce an actionable item to continue the investigation, namely a next wave of groups that may help in validating or invalidating as many hypotheses as possible (b), and then loop back to (a) until the set of plausible hypotheses is small enough to unambiguously identify the target of the search. More precisely,
  1. Given a population of n people, an infection state is a binary vector of length n that describes who is infected (marked with a 1), and who is not (marked with a 0). At a certain time, a population is in a given state (most likely a few 1’s and mostly 0’s). The goal of group testing is to identify that state using as few tests as possible. Given a prior belief on the infection rate (the disease is rare) and test results observed so far (if any), we expect that only a small share of those infection states will be plausible. Rather than evaluating the plausibility of all 2n possible states (an extremely large number even for small n), we resort to a more efficient method to sample plausible hypotheses using a sequential Monte Carlo (SMC) sampler. Although quite costly by common standards (a few minutes using a GPU in our experimental setup), we show in this work that SMC samplers remain tractable even for large n, opening new possibilities for group testing. In short, in return for a few minutes of computations, our detectives get an extensive list of thousands of relevant hypotheses that may explain tests observed so far.

  2. Equipped with a relevant list of hypotheses, our strategy proceeds, as detectives would, by selectively gathering additional evidence. If k tests can be carried out at the next iteration, our strategy will propose to test k new groups, which are computed using the framework of Bayesian optimal experimental design. Intuitively, if k=1 and one can only propose a single new group to test, there would be clear advantage in building that group such that its test outcome is as uncertain as possible, i.e., with a probability that it returns positive as close to 50% as possible, given the current set of hypotheses. Indeed, to progress in an investigation, it is best to maximize the surprise factor (or information gain) provided by new test results, as opposed to using them to confirm further what we already hold to be very likely. To generalize that idea to a set of k>1 new groups, we score this surprise factor by computing the mutual information of these “virtual” group tests vs. the distribution of hypotheses. We also consider a more involved approach that computes the expected area under the ROC curve (AUC) one would obtain from testing these new groups using the distribution of hypotheses. The maximization of these two criteria is carried out using a greedy approach, resulting in two group selectors, GMIMAX and GAUCMAX (greedy maximization of mutual information or AUC, respectively).
The interaction between a laboratory (wet_lab) carrying out testing, and our strategy, composed of a sampler and a group selector, is summarized in the following drawing, which uses names of classes implemented in our open source package.
Our group testing framework describes an interaction between a testing environment, the wet_lab, whose pooled test results are used by the sampler to draw thousands of plausible hypotheses on the infection status of all individuals. These hypotheses are then used by an optimization procedure, group_selector, that figures out what groups may be the most relevant to test in order to narrow down on the true infection status. Once formed, these new groups are then tested again, closing the loop. At any point in the procedure, the hypotheses formed by the sampler can be averaged to obtain the average probability of infection for each patient. From these probabilities, a decision on whether a patient is infected or not can be done by thresholding these probabilities at a certain confidence level.
Benchmarking
We benchmarked our two strategies GMIMAX and GAUCMAX against various baselines in a wide variety of settings (infection rates, test noise levels), reporting performance as the number of tests increases. In addition to simple Dorfman strategies, the baselines we considered included a mix of non-adaptive strategies (origami assays, random designs) complemented at later stages with the so-called informative Dorfman approach. Our approaches significantly outperform the others in all settings.
We executed 5000 simulations on a sample population of 70 individuals with an infection rate of 2%. We have assumed sensitivity/specificity values of 85% / 97% for tests with groups of maximal size 10, which are representative of current PCR machines. This figure demonstrates that our approach outperforms the other baselines with as few as 24 tests (up to 8 tests used in 3 cycles), including both adaptive and non-adaptive varieties, and performs significantly better than individual tests (plotted in the sensitivity/specificity plane as a hexagon, requiring 70 tests), highlighting the savings potential offered by group testing. See preprint for other setups.
Conclusion
Screening a population for a pathogen is a fundamental problem, one that we currently face during the current COVID-19 epidemic. Seventy years ago, Dorfman proposed a simple approach currently adopted by various institutions. Here, we have proposed a method to extend the basic group testing approach in several ways. Our first contribution is to adopt a probabilistic perspective, and form thousands of plausible hypotheses of infection distributions given test outcomes, rather than trust test results to be 100% reliable as Dorfman did. This perspective allows us to seamlessly incorporate additional prior knowledge on infection, such as when we suspect some individuals to be more likely than others to carry the pathogen, based for instance on contact tracing data or answers to a questionnaire. This provides our algorithms, which can be compared to detectives investigating a case, the advantage of knowing what are the most likely infection hypotheses that agree with prior beliefs and tests carried out so far. Our second contribution is to propose algorithms that can take advantage of these hypotheses to form new groups, and therefore direct the gathering of new evidence, to narrow down as quickly as possible to the "true" infection hypothesis, and close the case with as little testing effort as possible.

Acknowledgements
We would like to thank our collaborators on this work, Olivier Teboul, in particular, for his help preparing figures, as well as Arnaud Doucet and Quentin Berthet. We also thank Kevin Murphy and Olivier Bousquet (Google) for their suggestions at the earliest stages of this project, as well as Dan Popovici for his unwavering support pushing this forward; Ignacio Anegon, Jeremie Poschmann and Laurent Tesson (INSERM) for providing us background information on RT-PCR tests and Nicolas Chopin (CREST) for giving guidance on his work to define SMCs for binary spaces.

Source: Google AI Blog


Google Summer of Code 2019 (Statistics Part 2)

2019 has been an epic year for Google Summer of Code as we celebrated 15 years of connecting university students from around the globe with 201 open source organizations big and small.

We want to congratulate our 1,134 students that complete GSoC 2019. Great work everyone!

Now that GSoC 2019 is over we would like to wrap up the program with some more statistics to round out the year.

Student Registrations

We had 30,922 students from 148 countries register for GSoC 2019 (that’s a 19.5% increase in registrations over last year, the previous record). Interest in GSoC clearly continues to grow and we’re excited to see it growing in all parts of the world.

For the first time ever we had students register from Bhutan, Fiji, Grenada, Papua New Guinea, South Sudan, and Swaziland.

Universities

The 1,276 students accepted into the GSoC 2019 program hailed from 6586 universities, of which, 164 have students participating for the first time in GSoC.

Schools with the most accepted students for GSoC 2019:

University # of Accepted Students
Indian Institute of Technology, Roorkee48
International Institute of Information Technology - Hyderabad29
Birla Institute of Technology and Science, Pilani (BITS Pilani)27
Guru Gobind Singh Indraprastha University (GGSIPU Dwarka)20
Indian Institute of Technology, Kanpur19
Indian Institute of Technology, Kharagpur19
Amrita University / Amrita Vishwa Vidyapeetham14
Delhi Technological University11
Indian Institute of Technology, Bombay11
Indraprastha Institute of Information and Technology, New Delhi11

Mentors

Each year we pore over gobs of data to extract some interesting statistics about the GSoC mentors. Here’s a quick synopsis of our 2019 crew:
  • Registered mentors: 2,815
  • Mentors with assigned student projects: 2,066
  • Mentors who have participated in GSoC for 10 or more years: 70
  • Mentors who have been a part of GSoC for 5 years or more: 307
  • Mentors that are former GSoC students: 691
  • Mentors that have also been involved in the Google Code-in program: 498
  • Percentage of new mentors: 35.84%
GSoC 2019 mentors are from all parts of the world, representing 81 countries!

Every year thousands of GSoC mentors help introduce the next generation to the world of open source software development—for that we are forever grateful. We can not stress enough that without our invaluable mentors the GSoC program would not exist. Mentorship is why GSoC has remained strong for 15 years, the relationships built between students and mentors have helped sustain the program and many of these communities. Sharing their passion for open source, our mentors have paved the road for generations of contributors to enter open source development.

Thank you to all of our mentors, organization administrators, and all of the “unofficial” mentors that help in our open source organization’s communities. Google Summer of Code is a community effort and we appreciate each and every one of you.

By Stephanie Taylor, Google Open Source

Reflecting on Google Code-in 2018

Google Code-in (GCI), our contest introducing 13-17 year olds to open source software development, wrapped up last December with impressive numbers: 3,124 students from 77 countries completed an impressive 15,323 tasks!

These students spent 7 weeks working online with 27 open source organizations, writing code, writing and editing documentation, designing UI elements and logos, conducting research, developing videos teaching others about open source software, as well as finding (and fixing!) hundreds of bugs.

Overview

  • 2,164 students completed three or more tasks (earning a Google Code-in 2018 t-shirt)
  • 17% of students were girls
  • 23% of the participants from the USA were girls
  • 79% of students were first time participants in GCI
  • We saw very large increases in the number of students from Austria, Indonesia, Malaysia, Pakistan, and Taiwan

Student Age

Participating Schools

Students from 1,673 schools competed in this year’s contest. Many students learn about GCI from their friends or teachers and continue to spread the word to their classmates. This year the 5 schools with the most students completing tasks in the contest were:
School Name Number of Student Participants Country
Dunman High School 110 Singapore
Indus E.M High School 73 India
Sacred Heart Convent Senior Secondary School 69 India
Amity International School Sec-46 Gurgaon 36 India
Bhartiya Vidya Bhavan Vidyashram Pratap Nagar 27 India

Countries

We are pleased to have 9 countries with first time Winners and Finalists. Winners from Georgia, Macedonia, Philippines, South Africa and Spain, and Finalists from Israel, Luxembourg, Nepal and Pakistan.

The chart below displays the 10 countries with the most students completing at least 1 task.

What's Next

In June we will welcome all 54 grand prize winners to the San Francisco Bay Area for a fun-filled trip. The trip includes the opportunity for students to meet with one of the mentors they worked with during the contest. Students will also take part in an awards ceremony, meet with Google engineers to hear about new and exciting projects, tours of the Google campuses and a fun day exploring San Francisco.

We are thrilled that Google Code-in was so popular this year. We hope to continue to grow and expand this contest in the future to introduce even more teenagers to the world of open source software development.

Thank you again to the heroes of this program: the 789 mentors from 57 countries that guided students through the program and welcomed them into their open source communities.

By Saranya Sampat, Google Open Source

Magnificent mentors of Google Summer of Code 2018

Mentors are the heart and soul of the Google Summer of Code (GSoC) program and have been for the last 14 years. Without their hard work and dedication, there would be no Google Summer of Code. These volunteers spend 4+ months guiding their students to create the best quality project possible while welcoming them into their communities – answering questions and providing help at all hours of the day, including weekends and holidays.

Thank you mentors and organization administrators! 

Each year we pore over heaps of data to extract some interesting statistics about the GSoC mentors. Here’s a quick synopsis of our 2018 crew:
  • Registered mentors: 2,819
  • Mentors with assigned student projects: 1,996
  • Mentors who have participated in GSoC for 10 or more years: 46
  • Mentors who have been a part of GSoC for 5 years or more: 272
  • Mentors that are former GSoC students: 627
  • Mentors that have also been involved in the Google Code-in program: 474
  • Percentage of new mentors: 36.5%
GSoC 2018 mentors are from all parts of the world, hailing from 75 countries!

If you want to see the stats for all 75 countries check out this list.


Another fun fact about our 2018 mentors: they range in age from 15-80 years old!
  • Average mentor age: 34
  • Median mentor age: 33
  • Mentors under 18 years old: 26*
GSoC mentors help introduce the next generation to the world of open source software development – for that we are very grateful. To show our appreciation, we invite two mentors from each of the 206 participating organizations to attend our annual mentor summit at the Google campus in Sunnyvale, California. It’s three days of community building, lively debate, learning best practices from one another, working to strengthen open source communities, good food, and lots and lots of chocolate.

Thank you to all of our mentors, organization administrators, and all of the “unofficial” mentors that help in the various open source organization’s communities. Google Summer of Code is a community effort and we appreciate each and every one of you.

Cheers to yet another great year!

By Stephanie Taylor, Google Open Source

* Most of these 26 young GSoC mentors started their journey in Google Code-in, our contest for 13-17 year olds that introduces young students to open source software development.