Tag Archives: report card

Finding Stability in Open Source Work

At Google, open source is at the core of our infrastructure, processes, and culture. For the last 19 years, Google’s Open Source Programs Office (OSPO) has enabled our organization to support open source ecosystems through funding, training, mentorship and direct contribution. Every year for the last 5 years, roughly 10% of our workforce has contributed to open source projects as part of their work as well as in their personal time. We’re focused on investing in and protecting open source communities and infrastructure, as well as expanding access to open source opportunities around the world. Every day we seek to promote open and connected ecosystems as the foundation of technological advancement.

For the last four years, researchers in Google's Open Source Programs Office (OSPO) have analyzed our open source contribution activity annually to identify trends and changes in behavior. The goal of this effort has been to increase transparency and accountability across all of the communities we engage with, as well as provide feedback indicators for Alphabet’s internal tools, processes, and policies. In this iteration, our 2022 open source contribution metrics were remarkably consistent with what we found in 2021, which gives us confidence that what we're measuring is a good representation of open source behavior, especially after the extreme outlier year of 2020.


Security remains a priority

At Alphabet, open source software remains a critical component of our infrastructure, products, and services and we continue to rely on the health and availability of open source projects. Through internal efforts and collaboration with industry-led efforts such as OpenSSF, Alphabet is committed to bolstering the security posture of projects, users, and developers of open source software.

In 2021, Google began funding two Linux Foundation contractors to focus exclusively on security, and in 2022 we've continued to sponsor their work to eliminate fragile C language features and APIs in the kernel. We also continue to support the Rust-in-Linux project, with the goal of improving memory safety, strengthening APIs, and reducing the number of bugs overall in the project. In late 2022, Rust infrastructure support landed in the upstream kernel.

The deps.dev project released a public BigQuery dataset, allowing anyone to explore and analyze the dependencies, advisories, ownership, license, and other metadata of open source packages across supported ecosystems, and explore how this metadata has changed over time.

In 2022 we announced:

  • The OSV-Scanner, a free tool enabling open source developers and users to identify and remediate known vulnerabilities in their project's OSS dependencies. The OSV-Scanner provides a supported frontend to the OSV database which connects a project’s list of dependencies with the vulnerabilities that affect them.
  • The GOSST Upstream Team, a dedicated staff of Google open source security engineers who spend 100% of their time working closely with upstream maintainers to improve the security of critical open source projects.
  • Graph for Understanding Artifact Composition (GUAC) which aggregates software security metadata into a high fidelity graph database–normalizing entity identities and mapping standard relationships between them.

Our contributions continue to scale with our growing workforce

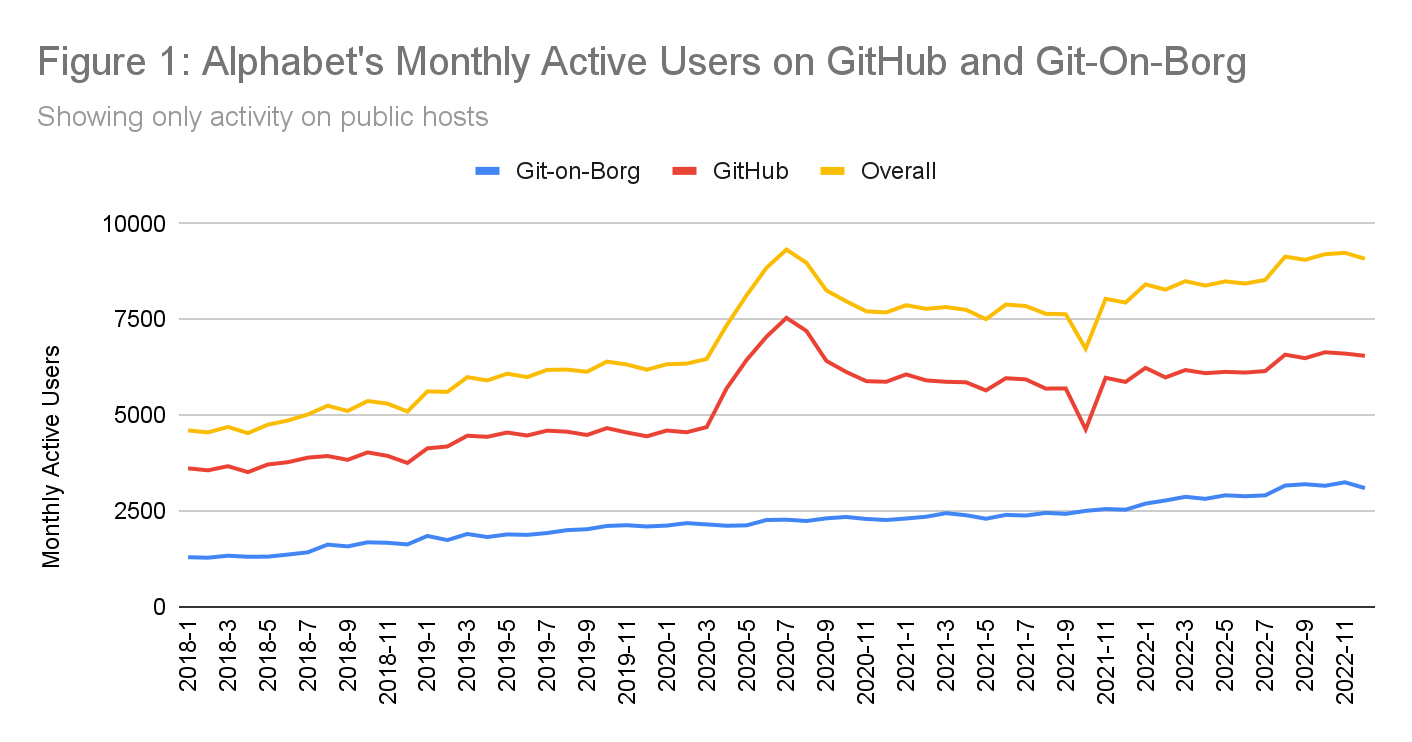
In 2022, roughly 10% of Alphabet's full-time workforce contributed to open source projects hosted on GitHub or Git-on-Borg - our internal production Git service (more details below). This percentage has remained roughly consistent over the last five years, indicating that our open source contribution has continued to scale with the growth of Alphabet. Similar to last year, FTEs represented over 95% of our open source workers, while the remainder includes vendors, independent contractors, temporary staff, and interns who contributed to open source projects during their tenure at Alphabet.

As open source work is core to our ongoing operations, we continue to track engagement over time, helping to compare continuous and sporadic participation. On average, over 45% of our active* contributing population for the year logged an activity on GitHub or Git-on-Borg in an average month. (see Figure 1)
This chart shows Alphabet's monthly active users on GitHub and Git-on-Borg. Over the last five years, the trajectory of monthly active users has continued to increase on both GitHub and Git-on-Borg by more than 15% year over year per month

Our portfolio of projects remains active

We estimate that more than 2000 projects that originated from Alphabet teams and employees were still active* (not archived). To make this estimate, we chose a broad and variable definition of an open source project, including developer tools, utilities, languages, frameworks, libraries, demos, sample code, models, raw data, designs, and more.

Project counts should not be confused with repositories as projects can include many repositories. Within Alphabet, we maintain over 7500 public repositories on GitHub and 1600 public repositories on Git-on-Borg. Our total repositories under management have reduced over time with the enforcement of a new archiving policy that flags repositories for archiving based on activity levels and owner feedback. Most of these repositories are open to outside contribution: more than 500,000 unique GitHub accounts not affiliated with Alphabet workers contributed to Alphabet projects in 2022.

The majority of our open source work happens outside of Alphabet organizations

The majority of repositories we work on are outside of Alphabet organizations: Over the last five years, more than 70% of non-personal GitHub repositories Alphabet contributors interacted with were outside of Google-managed organizations. We updated the methodology behind this metric since our last edition to filter out forks created in the pull request workflow. The top projects (by unique contributors at Alphabet) include Google-initiated projects such as Kuberenetes, Apache Beam, and gRPC as well as community-led projects such as LLVM, Envoy, and Rust.


We continue to invest in the sustainability of open source ecosystems

The mission of the Google Open Source Programs Office remains the same: we sponsor, create, and invest in projects and programs that enable everyone to join and contribute to the global open source ecosystem. In 2022, OSPO provided $5.7M in membership fees and sponsorship funding to 60 key open source projects and organizations. This funding was in addition to our established annual programs:

  • In its 18th year, Google Summer of Code enabled more than 1000 individuals to contribute to more than 150 organizations. Over the lifetime of this program, more than 19,000 individuals from 112 countries have contributed to more than 800 open source organizations across the globe.
  • In its fourth year, Google Season of Docs provided direct grants to 30 open source projects to hire more than 50 technical writers to improve open source project documentation, and published its second case study report highlighting useful open source documentation metrics. More than half of the documentation created in the 2022 program were how-tos, tutorials, and reference documentation; projects primarily wanted to add documentation for missing use cases and fix disorganized documentation.
  • Since 2011, the Google Open Source Peer Bonus Program has awarded bonuses for open source contributions to members of our extended community. In 2022 more than 300 contributors received awards, working in over 40 countries on more than 200 open source projects.

Our open source work will continue to grow and evolve to support the changing needs of our communities. Thank you to our colleagues and community members who continue to dedicate their personal and professional time supporting the open source ecosystem. Follow our work at opensource.google.

By Sophia Vargas – Researcher, Google Open Source Programs Office


About this data:

This report features metrics provided by many teams and programs across Alphabet. In regards to the code and code-adjacent activities data, we wanted to share more details about the derivation of those metrics.

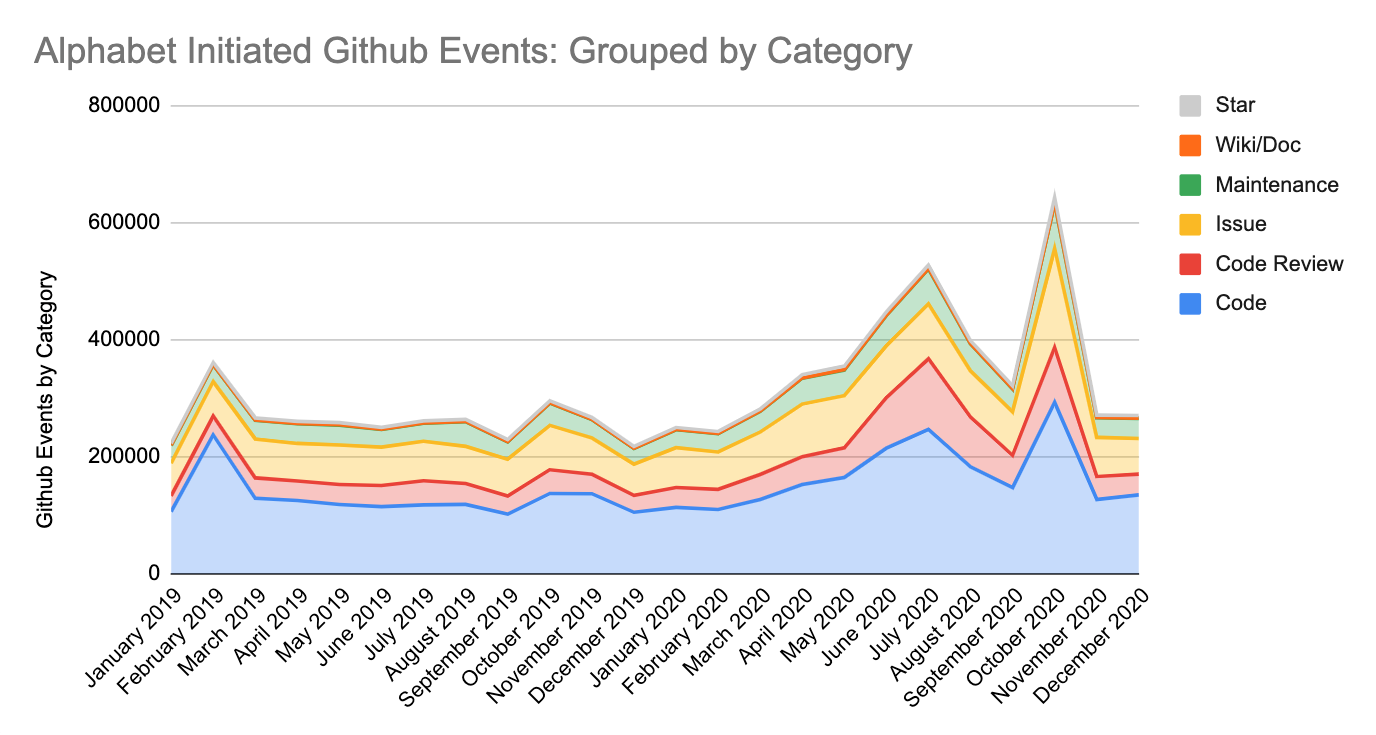
2022 updates: This year, we decided to remove event counts as it is increasingly difficult to differentiate automated activities from human-centered work. Even after filtering out non-human accounts, we couldn’t correlate these events to employee time spent on open source projects, and so we reduced our reporting to focus on our population and scope of effort.

  • Data sources: These data represent activities on repositories hosted on GitHub and our internal production Git service Git-on-Borg. These sources represent a subset of open source activity currently tracked by Google OSPO.
    • GitHub: We continue to use GitHub Archive as the primary source for GitHub data, which is available as a public dataset on BigQuery. Alphabet activity within GitHub is identified by self-registered accounts, which we estimate underreports actual activity.
    • Git-on-Borg: This is our primary platform for internal projects and some of our larger, long running public projects such as Android and Chromium. While we continue to develop on this platform, most of our open source activity has moved to GitHub to increase exposure and encourage community growth.
    • Distinct event types: Note that Git-on-Borg and GitHub APIs produce distinct sets of events—so we report activity metrics per platform. Where GitHub Event logs capture a wide range of activity from code creation and review to issue creation and comments, the Gerrit Event stream (used by Git-on-Borg) only captures code changes and reviews.
  • Driven by humans: We have created many automated bots and systems that can propose changes on various hosting platforms. We have intentionally filtered these data to focus on human-initiated activities.
  • Business and personal: Activity on GitHub reflects a mixture of Alphabet projects, third party projects, experimental efforts, and personal projects. Our metrics report on all of the above unless otherwise specified.
  • Alphabet contributors: Please note that unless additional detail is specified, activity counts attributed to Alphabet open source contributors will include our full-time employees as well as our extended Alphabet community (temps, vendors, contractors, and interns).
  • GitHub Accounts: For counts of GitHub accounts not affiliated with Alphabet, we cannot assume that one account is equivalent to one person, as multiple accounts could be tied to one individual or bot account.
  • *Active counts: Where possible, we will show ‘active users’ defined by logged activity (excluding ‘WatchEvent’) within a specified timeframe (a month, year, etc.) and ‘active repositories’ and ‘active projects’ as those that have enough activity to meet our internal criteria and have not been archived.

Establishing new baselines: Identifying open source work in an unstable world

For more than 17 years, Google's Open Source Programs Office (OSPO) has brought the best of open source to Google and the best of Google to open source. We sponsor, create, and invest in projects and programs that enable everyone to join and contribute to the global open source ecosystem. Because that's who open source is for—everyone.

In 2021, Google supported open source innovation, security, collaboration, and sustainability through our programs and services with $15 million of funding. This includes $7 million in direct funding to open source communities through Google’s OSPO. We also stepped up our investments in the governing organizations of open source ecosystems. We became the first Visionary Sponsor of the Python Software Foundation, supporting a number of key initiatives including funding for the first CPython Developer in Residence. We sustained our Platinum Membership of the OpenJS Foundation to continue supporting the essential work of the foundation that fosters many critical projects in the Javascript ecosystem.

In late 2021, we announced the release of Knative 1.0 and submitted Knative to become a Cloud Native Computing Foundation incubation project to enable the next phase of community-driven innovation. (Knative’s application was accepted in March 2022 and followed by our submission of Istio to the CNCF). We also collaborated with Antmicro to develop and release the Rowhammer Tester platform, which provides security professionals a flexible platform for experimenting with new types of attacks to find better mitigation techniques.

We sustain and expand the open source ecosystem through programs at scale

In addition to our new investments, we continued to maintain our long-term programs elevating open source contributors, both new and existing.
  • The Google Open Source Live virtual events program, initiated in 2020, hosted 11 events, expanding to cover more projects and technology areas.
  • Google Summer of Code, in its 17th year, matched 1,205 students from 67 countries with more than 2,100 mentors from 75 countries in 199 open source organizations to successfully complete this year’s program. At the end of this round, we announced our plans to broaden the scope of the program in 2022, expanding the eligibility of who could participate, offering more options around project contribution, and increased flexibility in the timing of the program.
  • Season of Docs, in its third year, had 30 open source organizations finish their projects with 93% of organizations and 96% of the technical writers reporting a positive experience with the program.
  • Through our Open Source Peer Bonus Program, we were able to award peer bonuses to 175 contributors working in 35 countries on 86 unique projects, including contributors to the CHAOSS, CocoaPods, git and Open Civic Data projects.
In 2021, Google's open source programs directly supported more than 120 events to safely bring together more than 88,000 attendees from open source communities. We proudly sponsored All Things Open 2021, which had nearly 5,000 registered participants from 86 countries. We were also a Cornerstone Sponsor for FOSDEM 2021's two-day virtual gathering.

Our contributing population continues to scale with the growth of Alphabet

In 2021, roughly 10% of Alphabet's full-time workforce (FTEs) actively contributed code or code-adjacent work to open source projects. This percentage has remained roughly consistent over the last five years, indicating that our open source contribution has continued to scale with the growth of Alphabet. Note that in 2021, FTEs represented over 95% of our open source contributors, while the remainder includes vendors, independent contractors, temporary staff, and interns that have contributed to open source projects during their tenure at Alphabet.

After 2020’s atypical growth—which was largely due to novel programs such as our open source internships and COVID-19 response work—in 2021, our activity numbers returned to pre-pandemic baselines. Over the last five years, the trajectory of monthly active usage has increased on both GitHub and Git-on-Borg by more than 15% on average each year.

Note that the dip in GitHub data reported in October of 2021 corresponds to an outage on GHarchive resulting in 4+ days of lost data (see figure below). Despite this outage, contribution levels remained fairly consistent month over month: more than 45% of our active contributing population for the year logged an activity on GitHub or Git-on-Borg in an average month.
For more details about the source data and analysis cited in this report, see “About this data.” below.

The number of Alphabet open source projects remains steady

In 2021, we estimated that more than 2,000 open source projects that originated from Alphabet teams and employees were still active (not archived). To make this estimate, we chose a broad and variable definition of an open source project, including developer tools, utilities, languages, frameworks, libraries, demos, sample code, models, raw data, designs, and more. This estimate also includes personal projects that went through Alphabet's releasing process but not projects that have been moved to or originated under external organizations or foundations.

Project counts should not be confused with repositories; projects can include many repositories. Within Alphabet, we maintain more than 9,500 public repositories on Github and 1,700 public repositories on Git-on-Borg. While these efforts originated at Google and Alphabet, these repositories are open for anyone to use, contribute to, fork or build on through open source licenses. In 2021, more than 500,000 unique GitHub accounts not affiliated with Alphabet employees contributed to Alphabet projects.

The majority of repositories we work on are outside of Alphabet organizations

Open source contributors at Alphabet work on a variety of projects and repositories—not just our own code. In 2021, contributors at Alphabet engaged with more than 70,000 repositories on GitHub (WatchEvents or “stars” were removed from this count to represent active engagement), pushing commits and/or opening pull requests on over 49,000 repositories. Consistent with our 2019 and 2020 reports, more than 75% of repositories with pull requests opened by Alphabet contributors on GitHub were outside of Google-managed organizations.

We continue to invest in open source quality, security, and long term viability

Alphabet continues to rely on the health and availability of open source projects. Through internal efforts and collaboration with industry-led efforts such as OpenSSF, Alphabet is committed to sharing relevant practices and tooling with the goal of improving overall code quality and bolstering the security posture of users and developers of open source software. We hope that by sharing our internal frameworks and best practices, we can spark industry-wide discussion and progress on the security and sustainability of the open source ecosystem.

In 2021, we launched Open Source Insights, a tool designed to list and visualize a project’s dependencies and their properties, helping developers review the packages that make up their software supply chains. The potential of this tool was put to the test after the disclosure of Log4j vulnerabilities in December 2021. The Open Source insights team reported that more than 35,000 Java packages, amounting to over 8% of the Maven Central repository, were impacted by this vulnerability. As part of their investigation, they compiled a list of 500 affected packages with some of the highest transitive usage to guide users and maintainers who were supporting patching and remediation activities.

In 2021, we also announced our sponsorship of the Secure Open Source (SOS) Rewards pilot program run by the Linux Foundation. This program financially rewards developers for enhancing the security of critical open source projects that we all depend on.

These efforts build on our existing open source security work, such as OSS Fuzz, which was used by over 500 critical open source projects in 2021 and has helped find more than 7,000 vulnerabilities to date.

Our open source work will continue to grow and evolve to support the changing needs of our communities. Thank you to our colleagues and community members that continue to dedicate their personal and professional time supporting the open source ecosystem. Follow our work at opensource.google.

By Sophia Vargas – Research Analyst and Amanda Casari, Open Source Researcher – Google Open Source Programs Office

About this data: 

This report features metrics provided by many teams and programs across Alphabet. In regards to the data centered on code and code adjacent activities, we wanted to share more details about the derivation of those metrics:
  • Data source: These data represent activities on repositories hosted on GitHub and our internal production Git service git-on-borg. These sources represent a subset of open source activity currently tracked by our OSPO.
    • GitHub: We continue to use GitHub Archive as the primary source for GitHub data, which is available as a public dataset on BigQuery. Alphabet activity within GitHub is identified by self-registered accounts, which we estimate underreports actual activity.
    • git-on-borg: This is our primary platform for internal projects and some of our larger, long running public projects like Android and Chromium. While we continue to develop on this platform, most of our open source activity has moved to GitHub to increase exposure and encourage community growth.
    • Distinct event types: Note that git-on-borg and GitHub APIs produce distinct sets of events—as such we will report activity metrics per platform. Where GitHub Event logs capture a wide range of activity from code creation and review to issue creation and comments, the Gerrit Event stream (used by git-on-borg) only captures code changes and reviews.
  • Driven by humans: We have created many automated bots and systems that can propose changes on various hosting platforms. We have intentionally filtered these data to focus on human-initiated activities. For our estimation of bots, we married our own records with a public list maintained by the devstats project
  • Business and personal: Activity on GitHub reflects a mixture of Alphabet projects, third party projects, experimental efforts, and personal projects. Our metrics report on all of the above unless otherwise specified.
  • Alphabet contributors: Please note that unless additional detail is specified, activity counts attributed to Alphabet open source contributors will include our full-time employees as well as our extended Alphabet community (temps, vendors, contractors, and interns).
  • GitHub Accounts: For counts of Github accounts not affiliated with Alphabet, we cannot assume that 1 account translates to 1 person - as multiple accounts could be tied to one individual or bot accounts.
  • Active counts: Where possible, we will show ‘active users’ defined by logged activity within a specified timeframe (i.e. in month, year, etc) and ‘active repositories’ and ‘active projects’ as those that have not been archived.
  • Activity types: This year we explore GitHub activity types in more detail. Note that in some cases we have removed “Watch Events” or articulated this as passive engagement. Additionally, GitHub added an event type “PullRequestReviewEvent” that started logging activity in August 2020, but we chose to remove this from our charts and aggregate counts as it invalidates year over year comparisons.

Metrics, spikes, and uncertainty: Open source contribution during a global pandemic

Welcome to the second edition of our Open Source Programs Office’s (OSPO) annual open source transparency report. In last year's report on 2019 open source activity, we focused on discovering baselines and trends for Alphabet’s open source activities. However, this past year was unlike any other in recent history. While many continue to investigate the impact of the global pandemic on work, productivity, and behavior, we wanted to understand the pandemic’s impact on Alphabet’s participation in open source.

Our mission within OSPO is to bring the value of open source to Google and the resources of Google to open source. While open source software remains a critical component of our infrastructure, products, and services, in 2020 we increased our focus on connecting with peers and supporting our extended communities across open source ecosystems. In addition to numerous Alphabet-led initiatives and programs, our open source community provided resources, funding, and technical support for projects and communities impacted by the global pandemic.

Before we jump into the data, we want to acknowledge that broad generalizations will never capture the complete context or complexities of personal experience. With these limitations in mind, we will attempt to aggregate what we learned from this past year and explore how our priorities, programs, and adjustments may have affected our measurements and reporting. For more details on the data source and methodology, see the “about this data” section below.

Open source engagement increased as employees moved to their homes

In March 2020, Alphabet closed our offices and required most employees to work from home. In addition to changing workplaces, we adapted our internship program for virtual participation, focusing many technical projects on open source. This inflection point directly impacted our open source contributor behavior, as observed by monthly active user trends—defined as users that logged any activity in a given month:
  • Before March 2020, our GitHub monthly active user counts were relatively stable: In any given month during 2019, about 45% of our yearly active contributing population logged activity on GitHub. Per month in 2019, this value was fairly consistent, with a relative standard deviation of 3%.
  • More GitHub users were active after March 2020: Starting in March 2020, our monthly active users grew by more than 20% and then continued to grow into April through July with the arrival of our interns. In addition to growth, activity fluctuated more dramatically with a relative standard deviation of 19%. Removing interns, this value dropped to 13%—still significantly higher than 2019.
  • Git-on-borg user patterns remained stable: On git-on-borg—our internal production Git service (more details below), more than 50% of users counted in this analysis were active per month. Activity levels were fairly stable in 2020 with a relative standard deviation of 3%, indicating that our behavior on git-on-borg was less impacted by pandemic-related changes. Note that less than 10% of our 2020 open source interns were active on git-on-borg as most worked on GitHub.
To identify more context behind this change in behavior, we explored our population, projects, and programs, in and around open source.
This chart of monthly active GitHub users shows a bump of activity starting in March 2020 and then continuing April through July with the arrival of interns.
This chart shows Alphabet’s monthly active users on GitHub, split by total, full-time employees, and interns.

Population: Our population of contributors grew as our composition shifted

In 2020, more than 10% of Alphabet full-time employees (FTEs) actively contributed to open source projects. This percentage has remained roughly consistent over the last five years, indicating that our open source contribution has scaled with the growth of Alphabet.

In addition to our FTEs, some of Alphabet's vendors, independent contractors, temporary staff, and interns have also contributed to open source during their tenures. From 2015-2019, this group represented about 3-5% of our total population of open source contributors. In 2020, this ratio doubled to 10% as many interns shifted to focus on open source. As a result, interns represented about 9% of our overall open source contributing population in 2020.
In 2020, more than 10% of Alphabet full-time employees (FTEs) actively contributed to open source projects. In addition to our FTEs, Alphabet's vendors, independent contractors, temporary staff, and interns have also contributed to open source during their tenures. From 2015-2019, this group represented about 3-5% of our total population of open source contributors. However in 2020, this ratio doubled to 10%.
This chart shows the aggregate per year counts of Alphabet employees, vendors, contractors, temps, and interns contributing to open source.

Scope: We created and interacted with more repositories and projects

Within Google-managed organizations, we created more than 2,000 new public repositories on GitHub, bringing our total active public repositories to over 9,000 on GitHub and over 1,500 on git-on-borg. While many of these new repositories were created within existing projects or to extend functionality of our products, more than 20% of our new GitHub repositories were created to host our interns’ open source projects. Moving forward, we anticipate that our total public repositories under management will stabilize or even shrink as we refine our depreciation and archival policies. In addition to supporting our own projects:
  • We engaged with more repositories on GitHub: In 2020, contributors at Alphabet interacted with more than 90,000 repositories on GitHub, pushing commits and/or opening pull requests on over 50,000 repositories. Removing passive interactions (WatchEvents or “stars”), we actively engaged with over 75,000 repositories in 2020.
  • We surpassed our growth rates from 2019. Across all metrics listed above, we engaged with 25% more repositories than in 2019—a growth rate significantly higher than last year’s growth rate of 15%-18%. These rates are not impacted by removing the repositories that supported our interns.
  • We continue to invest time in projects outside of Google: Consistent with our 2019 report, on GitHub more than 75% of repositories with pull requests opened by Alphabet contributors were outside of Google-managed organizations.

Behavior: Contribution activities increased, elevated by our interns

To take a closer look at our behavior, we explored all event types across GitHub Archive, grouping events into the following categories:

Category groups

GitHub Event Types

Code

PushEvent, PullRequestEvent, ForkEvent

Code Review

PullRequestReviewEvent, PullRequestReviewCommentEvent, CommitCommentEvent

Issue

IssuesEvent, IssueCommentEvent

Maintenance and administration

MemberEvent, CreateEvent, DeleteEvent, ReleaseEvent, PublicEvent

Wiki/Doc

GollumEvent

Star

WatchEvent

Exploring trends across event types, we found that:
  • GitHub activity grew across all event types: This is not surprising given our growth in the contributing population and repository counts described above. More specifically, in 2020, contributors at Alphabet created more than 780,000 issue comments, and opened over 240,000 pull requests on GitHub. Compared to 2019, we generated 32% more issue comments and opened 50% more pull requests in 2020. Removing WatchEvents, in 2020 our overall activity on GitHub grew by more than 35%.
  • Interns bolstered our growth on GitHub: While in previous years, full-time Alphabet employees were responsible for over 97% of all reported activity on GitHub, in 2020 interns opened more than 10% of Alphabet’s total pull requests on this platform.
  • git-on-borg’s growth rate was consistent with 2019: Where our GitHub activity growth rates increased, our submitted and reviewed changes on git-on-borg grew by 17%, consistent with our 2018-2019 year-over-year growth on this platform and on GitHub. This consistent trajectory once again implies that individuals working on git-on-borg did not significantly change their behavior as a result of the global pandemic. Please note, that the activity pulled from git-on-borg for this analysis was only from Google managed projects where GitHub logs also included non-Google organizations and personal activity.
This chart of grouped GitHub events shows spikes of activity in July 2020 and October 2020, with the largest concentration of activity around code creation.
This chart shows per-month counts of activities initiated by the Alphabet community on GitHub.
Note: not showing “PullRequestReviewEvent”, which GitHub Archive started collecting in August 2020.

Changes: What drove this change in behavior?

While 2020 behavior cannot be separated from the impact of the global pandemic, we were curious if we could isolate specific programs and externalities that would explain the uptick in monthly active users and spikes in logged activities. Again, acknowledging the limitations of aggregate analysis, we found evidence that these measurements were impacted by:
  • Intern hosts: In May-Sept, we welcomed more than 1000 interns and set them to work on open source projects. In addition to intern-driven activities, teams that hosted interns had to interact with these projects in public channels, which contributed to additional individuals logging actions on GitHub between April and September.
  • Tenured employees. To investigate other drivers of the March 2020 uplift in GitHub monthly active users, we filtered out interns and individuals that were new to Alphabet in 2020, which led us to believe that this increase could mostly be attributed to existing employees increasing their time on GitHub.
  • Hacktoberfest: During Hacktoberfest (October 2020), we saw a significant spike in activity with the largest uptick concentrated in issue-related activities, as open source contributors at Alphabet responded to activities initiated during this event.
We also interviewed open source contributors around the organization to understand how their professional and personal open source activity may have been impacted due to COVID-19. Although each case was unique, common themes were:
  • Remote work: With most teams working remotely, some reported that they relied more heavily on asynchronous tooling for collaboration and code review, which would yield additional logged activities on hosting platforms.
  • Open source as a personal outlet: For others, open source provided a place to create and socialize outside of work. This trend was also reported in GitHub’s Octoberverse report on productivity which showed an uptick in open source activity outside of traditional work hours.
Please note, that Alphabet’s aggregate experience does not translate to behavioral or productivity trends in specific projects that we work on. For example, leading up to Kubernetes’ 1.19 release in May 2020, community leaders reported declining engagement, measured by a 15% decline in daily pull request reviews across Kubernetes organizations compared to the 2019 average.

Beyond code: We continue to invest in all aspects of open source

Alphabet relies on the health and availability of open source projects, and as such we continue to invest in security and sustainability across the supply chain, from respectful language updates in our own projects to:
  • Mentorship and community engagement: In its 16th year of the program, Google’s 2020 Summer of Code program had 1,106 students from 65 countries successfully complete the program under the guidance of over 2,000 mentors. In its second year, Season of Docs sponsored 87 technical writers working on 48 projects with the support of over 100 mentors. And with in-person events postponed until further notice, we launched the Google Open Source Live monthly series to connect with our extended community, hosting 5 events last year, 7 so far in 2021, and more planned in the final quarters of 2021.
  • Improving open source stability and security: Security challenges are never going to disappear, and we must work together to maintain the security of the open source software we collectively depend on. In 2020, Google co-founded the OpenSSF to collaborate on tools and frameworks to improve open source security. As part of this community, we released Criticality Score and provided significant contributions to project Scorecards to help users, contributors, companies, and communities generate relative criticality metrics for projects that they depend on. Additionally, in 2020 the OSS-Fuzz project nearly doubled the number of supported projects to more than 400 projects, and identified more than 25,000 bugs. In addition to the main effort, the Fuzz team hosted interns, launched the Atheris Python Fuzzer, and ramped up a FuzzBench service to help academic researchers run large scale experiments on their fuzzing tools.
Despite perpetual uncertainty, we will continue to invest in the open source ecosystem as we value the connection, collaboration and community even when we are kept apart by a global pandemic. Learn more about our open source initiatives at opensource.google.

About the data:

  • Data source: These data represent activities on repositories hosted on GitHub and our internal production Git service git-on-borg. These sources represent a subset of open source activity currently tracked by our OSPO.
    • GitHub: We continue to use GitHub Archive as the primary source for GitHub data, which is available as a public dataset on BigQuery. Alphabet activity within GitHub is identified by self-registered accounts, which we estimate underreports actual activity. This year we decided to generate this report from Monthly Tables instead of Yearly Tables in order to explore contribution patterns within the year.
    • git-on-borg: This is our primary platform for internal projects and some of our larger, long running public projects like Android and Chromium. While we continue to develop on this platform, most of our open source activity has moved to GitHub to increase exposure and encourage community growth.
    • Distinct event types: Note that git-on-borg and GitHub APIs produce distinct sets of events—as such we will report activity metrics per platform. Where GitHub Event logs capture a wide range of activity from code creation and review to issue creation and comments, the Gerrit Event stream (used by git-on-borg) only captures code changes and reviews.
  • Driven by humans: We have created many automated bots and systems that can propose changes on various hosting platforms. We have intentionally filtered these data to focus on human-initiated activities.
  • Business and personal: Activity on GitHub reflects a mixture of Alphabet projects, third party projects, experimental efforts, and personal projects. Our metrics report on all of the above unless otherwise specified.
  • Alphabet contributors: Please note that unless additional detail is specified, activity counts attributed to Alphabet open source contributors will include our full-time employees as well as our extended Alphabet community (temps, vendors, contractors, and interns).
  • Active counts: Where possible, we will show ‘active users’ defined by logged activity within a specified timeframe (i.e. in month, year, etc) and ‘active repositories’ as those that have not been archived.
  • Activity types: This year we explore GitHub activity types in more detail. Note that in some cases we have removed “Watch Events” or articulated this as passive engagement. Additionally, GitHub added an event type “PullRequestReviewEvent” that started logging activity in August 2020, but we chose to remove this from our charts and aggregate counts as it invalidates year over year comparisons.
By Sophia Vargas, Research Analyst – Google Open Source Programs Office

Open source by the numbers at Google

At Google, open source is at the core of our infrastructure, processes, and culture. As such, participation in these communities is vital to our productivity. Within OSPO (Open Source Programs Office), our mission is to bring the value of open source to Google and the resources of Google to open source. To ensure our actions match our commitment, in this post we will explore a variety of metrics intended to increase context, transparency, and accountability across all of the communities we engage with.

Why we contribute: Open source has become a pervasive component in modern software development, and Google is no exception. We use thousands of open source projects across our internal infrastructure and products. As participants in the ecosystem, our intentions are twofold: give back to the communities we depend on as well as expand support for open source overall. We firmly believe in open source and its ability to bring together users, contributors, and companies alike to deliver better software.

The majority of Google’s open source work is done within one of two hosting platforms: GitHub and git-on-borg, Google’s production Git service which integrates with Gerrit for code review and access control. While we also allow individual usage of Bitbucket, GitLab, Launchpad, and other platforms, this analysis will focus on GitHub and git-on-borg. We will continue to explore how best to incorporate activity across additional channels.

A little context about the numbers you’ll read below:
  • Business and personal: While git-on-borg hosts both internal and external Google created repos, GitHub is a mixture of Google projects, experimental efforts and personal projects created by Googlers.
  • Driven by humans: We have created many automated bots and systems that can propose changes on both hosting platforms. We have intentionally filtered these data to ensure we are only showing human initiated activities.
  • GitHub data: We are using GH Archive as the primary source for GitHub data, which is currently available as a public dataset on BigQuery. Google activity within GitHub is identified by self registered accounts, which we anticipate under reports actual usage as employees acclimate to our policies.
  • Active counts: Where possible, we will show ‘active users’ and ‘active repositories’ defined by logged activity within each specified timeframe (for GH archive data, that’s any event type logged in the public GitHub event stream).
As numbers mean nothing without scale, let’s start by defining our applicable community: In 2019, more than 9% of Alphabet’s full time employees actively contributed to public repositories on git-on-borg and GitHub. While single digit, this percentage represents a portion of all full time Alphabet employees—from engineers to marketers to admins, across every business unit in Alphabet—and does not include those who contribute to open source projects outside of code. As our population has grown, so has our registered contributor base:
This chart shows the aggregate per year counts of Googlers active on public repositories hosted on GitHub and git-on-borg

What we create: As mentioned above, our contributing population works across a variety of Google, personal, and external repositories. Over the years, Google has released thousands of open source projects (many of which span multiple repositories) and ~2,600 are still active. Today, Google hosts over 8,000 public repositories on GitHub and more than 1,000 public repositories on git-on-borg. Over the last five years, we have doubled the number of public repos, growing our footprint by an average of 25% per year.

What we work on: In addition to our own repositories, we contribute to a wide pool of external projects. In 2019, Googlers were active in over 70,000 repositories on GitHub, pushing commits and/or opening pull requests on over 40,000 repositories. Note that more than 75% of the repos with Googler-opened pull requests were outside of Google-managed organizations (on GitHub).
This charts shows per year counts of activities initiated by Googlers on GitHub

What we contribute: For contribution volume on GitHub, we chose to focus on push events, opened, and merged pull requests instead of commits as this metric on its own is difficult to contextualize. Note that push events and pull requests typically include one or more commits per event. In 2019, Googlers created over 570,000 issues, opened over 150,000 pull requests, and created more than 36,000 push events on GitHub. Since 2015, we have doubled our annual counts of issues created and push events, and more than tripled the number of opened pull requests. Over the last five years, more than 80% of pull requests opened by Googlers have been closed and merged into active repositories.

How we spend our time: Combining these two classes of metrics—contributions and repos—provides context on how our contributors focus their time. On GitHub: in 2015, about 40% of our opened pull requests were concentrated in just 25 repositories. However, over the next four years, our activity became more distributed across a larger set of projects, with the top 25 repos claiming about 20% of opened pull requests in 2019. For us, this indicates a healthy expansion and diversification of interests, especially given that this activity represents both Google, as well as a community of contributors that happen to work at Google.
This chart splits the total per year counts of Googler created pull requests on GitHub by Top 25 repos vs the remainder ranked by number of opened pull requests per repo per year.

Open source contribution is about more than code

Every day, Google relies on the health and continuing availability of open source, and as such we actively invest in the security and sustainability of open source and its supply chain in three key areas:
  • Security: In addition to building security projects like OpenTitan and gVisor, Google’s OSS-Fuzz project aims to help other projects identify programming errors in software. As of the end of 2019, OSS-Fuzz had over 250 projects using the project, filed over 16,000 bugs, including 3,500 security vulnerabilities.
  • Community: Open source projects depend on communities of diverse individuals. We are committed to improving community sustainability and growth with programs like Google Summer of Code and Season of Docs. Over the last 15 years, about 15,000 students from over 105 countries have participated in Google Summer of Code, along with 25,000 mentors in more than 115 countries working on more than 680 open source projects.
  • Research: At the end of 2019, Google invested $1 million in open source research, partnering with researchers at UVM, with the goal to deepen understanding of how people, teams and organizations thrive in technology-rich settings, especially in open-source projects and communities.
Learn more about our open source initiatives at opensource.google.

By Sophia Vargas – Researcher, Google Open Source Programs Office

Google Open Source Report Card

Open source software enables Google to build things quickly and efficiently without reinventing the wheel, allowing us to focus on solving new problems. We stand on the shoulders of giants and we know it. This is why we support open source and make it easy for Googlers to release the projects they’re working on internally as open source.

Today we’re sharing our first Open Source Report Card, highlighting our most popular projects, sharing a few statistics and detailing some of the projects we’ve released in 2016.

We’ve open sourced over 20 million lines of code to date and you can find a listing of some of our best known project releases on our website. Here are some of our most popular projects:
  • Android - a software stack for mobile devices that includes an operating system, middleware and key applications.
  • Chromium - a project encompassing Chromium, the software behind Google Chrome, and Chromium OS, the software behind Google Chrome OS devices.
  • Angular - a web application framework for JavaScript and Dart focused on developer productivity, speed and testability.
  • TensorFlow - a library for numerical computation using data flow graphics with support for scalable machine learning across platforms from data centers to embedded devices.
  • Go - a statically typed and compiled programming language that is expressive, concise, clean and efficient.
  • Kubernetes - a system for automating deployment, operations and scaling of containerized applications.
  • Polymer - a lightweight library built on top of Web Components APIs for building encapsulated re-usable elements in web applications.
  • Protobuf - an extensible, language-neutral and platform-neutral mechanism for serializing structured data.
  • Guava - a set of Java core libraries that includes new collection types (such as multimap and multiset), immutable collections, a graph library, functional types, an in-memory cache, and APIs/utilities for concurrency, I/O, hashing, primitives, reflection, string processing and much more.
  • Yeoman - a robust and opinionated set of scaffolding tools including libraries and a workflow that can help developers quickly build beautiful and compelling web applications.
While it’s difficult to measure the full scope of open source at Google, we can use the subset of projects that are on GitHub to gather some interesting data. Today our GitHub footprint includes over 84 organizations and 3,499 repositories, 773 of which were created this year.

Googlers use countless languages from Assembly to XSLT, but what are their favorites? GitHub flags the most heavily used language in a repository and we can use that to find out. A survey of GitHub repositories shows us these are some of the languages Googlers use most often:
  • JavaScript
  • Java
  • C/C++
  • Go
  • Python
  • TypeScript
  • Dart
  • PHP
  • Objective-C
  • C#
Many things can be gleaned using the open source GitHub dataset on BigQuery, like usage of tabs versus spaces and the most popular Go packages. What about how many times Googlers have committed to open source projects on GitHub? We can search for Google.com email addresses to get a baseline number of Googler commits. Here’s our query:


SELECT count(*) as n
FROM [bigquery-public-data:github_repos.commits]
WHERE committer.date > '2016-01-01 00:00'
AND REGEXP_EXTRACT(author.email, r'.*@(.*)') = 'google.com'


With this, we learn that Googlers have made 142,527 commits to open source projects on GitHub since the start of the year. This dataset goes back to 2011 and we can tweak this query to find out that Googlers have made 719,012 commits since then. Again, this is just a baseline number as it doesn’t count commits made with other email addresses.

Looking back at the projects we’ve open-sourced in 2016 there’s a lot to be excited about. We have released open source software, hardware and datasets. Let’s take a look at some of this year’s releases.

Seesaw
Seesaw is a Linux Virtual Server (LVS) based load balancing platform developed in Go by our Site Reliability Engineers. Seesaw, like many projects, was built to scratch our own itch.

From our blog post announcing its release: “We needed the ability to handle traffic for unicast and anycast VIPs, perform load balancing with NAT and DSR (also known as DR), and perform adequate health checks against the backends. Above all we wanted a platform that allowed for ease of management, including automated deployment of configuration changes.”

Vendor Security Assessment Questionnaire (VSAQ)
We assess the security of hundreds of vendors every year and have developed a process to automate much of the initial information gathering with VSAQ. Many vendors found our questionnaires intuitive and flexible, so we decided to shared them. The VSAQ Framework includes four extensible questionnaire templates covering web applications, privacy programs, infrastructure as well as physical and data center security. You can learn more about it in our announcement blog post.

OpenThread
OpenThread, released by Nest, is a complete implementation of the Thread protocol for connected devices in the home. This is especially important because of the fragmentation we’re seeing in this space. Development of OpenThread is supported by ARM, Microsoft, Qualcomm, Texas Instruments and other major vendors.

Magenta
Can we use machine learning to create compelling art and music? That’s the question that animates Magenta, a project from the Google Brain team based on TensorFlow. The aim is to advance the state of the art in machine intelligence for music and art generation and build a collaborative community of artists, coders and machine learning researchers. Read the release announcement for more information.

Omnitone
Virtual reality (VR) isn’t nearly as immersive without spatial audio and much of VR development is taking place on proprietary platforms. Omnitone is an open library built by members of the Chrome Team that brings spatial audio to the browser. Omnitone builds on standard Web Audio APIs to deliver an immersive experience and can be used alongside projects like WebVR. Find out more in our blog post announcing the project’s release.

Science Journal
Today’s smartphones are packed with sensors that can tell us interesting things about the world around us. We launched Science Journal to help educators, students and citizen scientists tap into those sensors. You can learn more about the project in our announcement blog post.

Cartographer
Cartographer is a library for real-time simultaneous localization and mapping (SLAM) in 2D and 3D with Robot Operating System (ROS) support. Combining data from a variety of sensors, this library computes positioning and maps surroundings. This is a key element of self-driving cars, UAVs and robotics as well as efforts to map the insides of famous buildings. More information on Cartographer can be found in our blog post announcing its release.

This is just a small sampling of what we’ve released this year. Follow the Google Open Source Blog to stay apprised of Google’s open source software, hardware and data releases.

By Josh Simmons, Open Source Programs Office