Tag Archives: google open source

Metrics, spikes, and uncertainty: Open source contribution during a global pandemic

Welcome to the second edition of our Open Source Programs Office’s (OSPO) annual open source transparency report. In last year's report on 2019 open source activity, we focused on discovering baselines and trends for Alphabet’s open source activities. However, this past year was unlike any other in recent history. While many continue to investigate the impact of the global pandemic on work, productivity, and behavior, we wanted to understand the pandemic’s impact on Alphabet’s participation in open source.

Our mission within OSPO is to bring the value of open source to Google and the resources of Google to open source. While open source software remains a critical component of our infrastructure, products, and services, in 2020 we increased our focus on connecting with peers and supporting our extended communities across open source ecosystems. In addition to numerous Alphabet-led initiatives and programs, our open source community provided resources, funding, and technical support for projects and communities impacted by the global pandemic.

Before we jump into the data, we want to acknowledge that broad generalizations will never capture the complete context or complexities of personal experience. With these limitations in mind, we will attempt to aggregate what we learned from this past year and explore how our priorities, programs, and adjustments may have affected our measurements and reporting. For more details on the data source and methodology, see the “about this data” section below.

Open source engagement increased as employees moved to their homes

In March 2020, Alphabet closed our offices and required most employees to work from home. In addition to changing workplaces, we adapted our internship program for virtual participation, focusing many technical projects on open source. This inflection point directly impacted our open source contributor behavior, as observed by monthly active user trends—defined as users that logged any activity in a given month:
  • Before March 2020, our GitHub monthly active user counts were relatively stable: In any given month during 2019, about 45% of our yearly active contributing population logged activity on GitHub. Per month in 2019, this value was fairly consistent, with a relative standard deviation of 3%.
  • More GitHub users were active after March 2020: Starting in March 2020, our monthly active users grew by more than 20% and then continued to grow into April through July with the arrival of our interns. In addition to growth, activity fluctuated more dramatically with a relative standard deviation of 19%. Removing interns, this value dropped to 13%—still significantly higher than 2019.
  • Git-on-borg user patterns remained stable: On git-on-borg—our internal production Git service (more details below), more than 50% of users counted in this analysis were active per month. Activity levels were fairly stable in 2020 with a relative standard deviation of 3%, indicating that our behavior on git-on-borg was less impacted by pandemic-related changes. Note that less than 10% of our 2020 open source interns were active on git-on-borg as most worked on GitHub.
To identify more context behind this change in behavior, we explored our population, projects, and programs, in and around open source.
This chart of monthly active GitHub users shows a bump of activity starting in March 2020 and then continuing April through July with the arrival of interns.
This chart shows Alphabet’s monthly active users on GitHub, split by total, full-time employees, and interns.

Population: Our population of contributors grew as our composition shifted

In 2020, more than 10% of Alphabet full-time employees (FTEs) actively contributed to open source projects. This percentage has remained roughly consistent over the last five years, indicating that our open source contribution has scaled with the growth of Alphabet.

In addition to our FTEs, some of Alphabet's vendors, independent contractors, temporary staff, and interns have also contributed to open source during their tenures. From 2015-2019, this group represented about 3-5% of our total population of open source contributors. In 2020, this ratio doubled to 10% as many interns shifted to focus on open source. As a result, interns represented about 9% of our overall open source contributing population in 2020.
In 2020, more than 10% of Alphabet full-time employees (FTEs) actively contributed to open source projects. In addition to our FTEs, Alphabet's vendors, independent contractors, temporary staff, and interns have also contributed to open source during their tenures. From 2015-2019, this group represented about 3-5% of our total population of open source contributors. However in 2020, this ratio doubled to 10%.
This chart shows the aggregate per year counts of Alphabet employees, vendors, contractors, temps, and interns contributing to open source.

Scope: We created and interacted with more repositories and projects

Within Google-managed organizations, we created more than 2,000 new public repositories on GitHub, bringing our total active public repositories to over 9,000 on GitHub and over 1,500 on git-on-borg. While many of these new repositories were created within existing projects or to extend functionality of our products, more than 20% of our new GitHub repositories were created to host our interns’ open source projects. Moving forward, we anticipate that our total public repositories under management will stabilize or even shrink as we refine our depreciation and archival policies. In addition to supporting our own projects:
  • We engaged with more repositories on GitHub: In 2020, contributors at Alphabet interacted with more than 90,000 repositories on GitHub, pushing commits and/or opening pull requests on over 50,000 repositories. Removing passive interactions (WatchEvents or “stars”), we actively engaged with over 75,000 repositories in 2020.
  • We surpassed our growth rates from 2019. Across all metrics listed above, we engaged with 25% more repositories than in 2019—a growth rate significantly higher than last year’s growth rate of 15%-18%. These rates are not impacted by removing the repositories that supported our interns.
  • We continue to invest time in projects outside of Google: Consistent with our 2019 report, on GitHub more than 75% of repositories with pull requests opened by Alphabet contributors were outside of Google-managed organizations.

Behavior: Contribution activities increased, elevated by our interns

To take a closer look at our behavior, we explored all event types across GitHub Archive, grouping events into the following categories:

Category groups

GitHub Event Types

Code

PushEvent, PullRequestEvent, ForkEvent

Code Review

PullRequestReviewEvent, PullRequestReviewCommentEvent, CommitCommentEvent

Issue

IssuesEvent, IssueCommentEvent

Maintenance and administration

MemberEvent, CreateEvent, DeleteEvent, ReleaseEvent, PublicEvent

Wiki/Doc

GollumEvent

Star

WatchEvent

Exploring trends across event types, we found that:
  • GitHub activity grew across all event types: This is not surprising given our growth in the contributing population and repository counts described above. More specifically, in 2020, contributors at Alphabet created more than 780,000 issue comments, and opened over 240,000 pull requests on GitHub. Compared to 2019, we generated 32% more issue comments and opened 50% more pull requests in 2020. Removing WatchEvents, in 2020 our overall activity on GitHub grew by more than 35%.
  • Interns bolstered our growth on GitHub: While in previous years, full-time Alphabet employees were responsible for over 97% of all reported activity on GitHub, in 2020 interns opened more than 10% of Alphabet’s total pull requests on this platform.
  • git-on-borg’s growth rate was consistent with 2019: Where our GitHub activity growth rates increased, our submitted and reviewed changes on git-on-borg grew by 17%, consistent with our 2018-2019 year-over-year growth on this platform and on GitHub. This consistent trajectory once again implies that individuals working on git-on-borg did not significantly change their behavior as a result of the global pandemic. Please note, that the activity pulled from git-on-borg for this analysis was only from Google managed projects where GitHub logs also included non-Google organizations and personal activity.
This chart of grouped GitHub events shows spikes of activity in July 2020 and October 2020, with the largest concentration of activity around code creation.
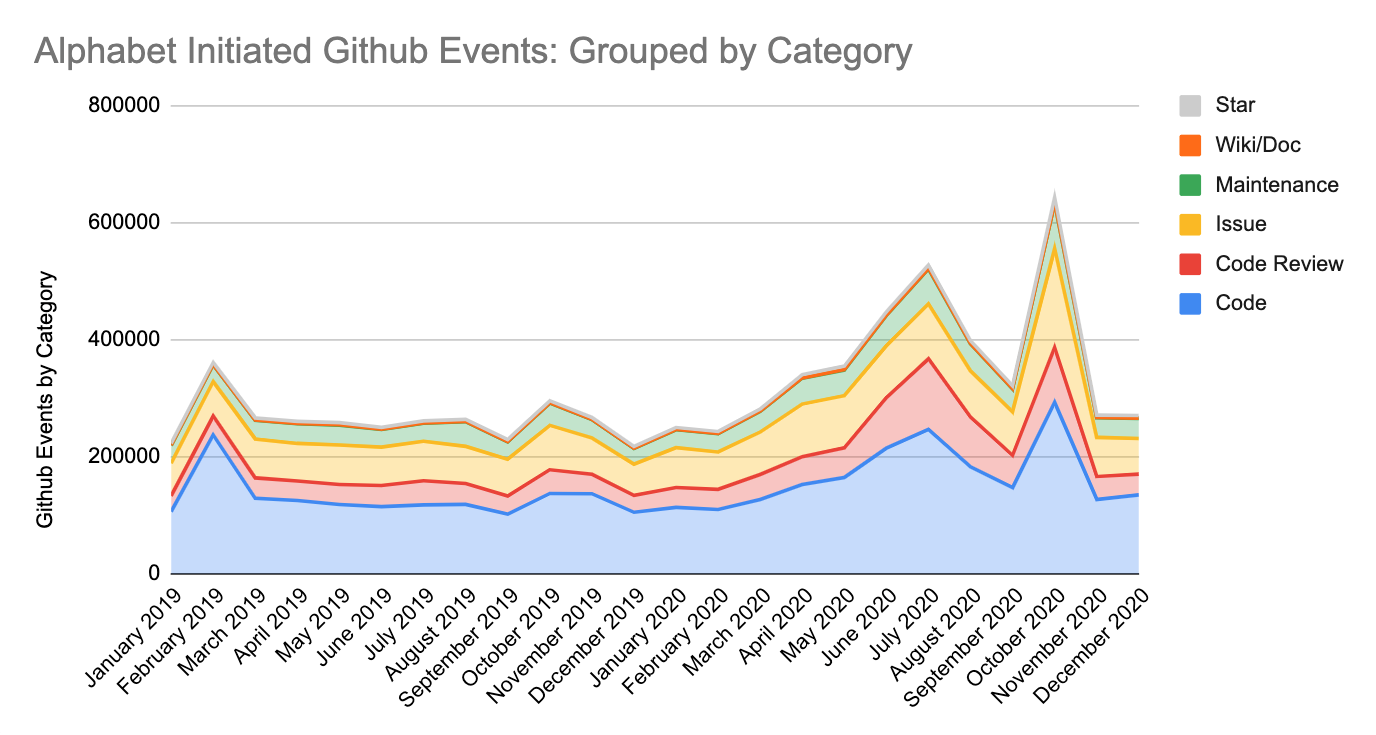
This chart shows per-month counts of activities initiated by the Alphabet community on GitHub.
Note: not showing “PullRequestReviewEvent”, which GitHub Archive started collecting in August 2020.

Changes: What drove this change in behavior?

While 2020 behavior cannot be separated from the impact of the global pandemic, we were curious if we could isolate specific programs and externalities that would explain the uptick in monthly active users and spikes in logged activities. Again, acknowledging the limitations of aggregate analysis, we found evidence that these measurements were impacted by:
  • Intern hosts: In May-Sept, we welcomed more than 1000 interns and set them to work on open source projects. In addition to intern-driven activities, teams that hosted interns had to interact with these projects in public channels, which contributed to additional individuals logging actions on GitHub between April and September.
  • Tenured employees. To investigate other drivers of the March 2020 uplift in GitHub monthly active users, we filtered out interns and individuals that were new to Alphabet in 2020, which led us to believe that this increase could mostly be attributed to existing employees increasing their time on GitHub.
  • Hacktoberfest: During Hacktoberfest (October 2020), we saw a significant spike in activity with the largest uptick concentrated in issue-related activities, as open source contributors at Alphabet responded to activities initiated during this event.
We also interviewed open source contributors around the organization to understand how their professional and personal open source activity may have been impacted due to COVID-19. Although each case was unique, common themes were:
  • Remote work: With most teams working remotely, some reported that they relied more heavily on asynchronous tooling for collaboration and code review, which would yield additional logged activities on hosting platforms.
  • Open source as a personal outlet: For others, open source provided a place to create and socialize outside of work. This trend was also reported in GitHub’s Octoberverse report on productivity which showed an uptick in open source activity outside of traditional work hours.
Please note, that Alphabet’s aggregate experience does not translate to behavioral or productivity trends in specific projects that we work on. For example, leading up to Kubernetes’ 1.19 release in May 2020, community leaders reported declining engagement, measured by a 15% decline in daily pull request reviews across Kubernetes organizations compared to the 2019 average.

Beyond code: We continue to invest in all aspects of open source

Alphabet relies on the health and availability of open source projects, and as such we continue to invest in security and sustainability across the supply chain, from respectful language updates in our own projects to:
  • Mentorship and community engagement: In its 16th year of the program, Google’s 2020 Summer of Code program had 1,106 students from 65 countries successfully complete the program under the guidance of over 2,000 mentors. In its second year, Season of Docs sponsored 87 technical writers working on 48 projects with the support of over 100 mentors. And with in-person events postponed until further notice, we launched the Google Open Source Live monthly series to connect with our extended community, hosting 5 events last year, 7 so far in 2021, and more planned in the final quarters of 2021.
  • Improving open source stability and security: Security challenges are never going to disappear, and we must work together to maintain the security of the open source software we collectively depend on. In 2020, Google co-founded the OpenSSF to collaborate on tools and frameworks to improve open source security. As part of this community, we released Criticality Score and provided significant contributions to project Scorecards to help users, contributors, companies, and communities generate relative criticality metrics for projects that they depend on. Additionally, in 2020 the OSS-Fuzz project nearly doubled the number of supported projects to more than 400 projects, and identified more than 25,000 bugs. In addition to the main effort, the Fuzz team hosted interns, launched the Atheris Python Fuzzer, and ramped up a FuzzBench service to help academic researchers run large scale experiments on their fuzzing tools.
Despite perpetual uncertainty, we will continue to invest in the open source ecosystem as we value the connection, collaboration and community even when we are kept apart by a global pandemic. Learn more about our open source initiatives at opensource.google.

About the data:

  • Data source: These data represent activities on repositories hosted on GitHub and our internal production Git service git-on-borg. These sources represent a subset of open source activity currently tracked by our OSPO.
    • GitHub: We continue to use GitHub Archive as the primary source for GitHub data, which is available as a public dataset on BigQuery. Alphabet activity within GitHub is identified by self-registered accounts, which we estimate underreports actual activity. This year we decided to generate this report from Monthly Tables instead of Yearly Tables in order to explore contribution patterns within the year.
    • git-on-borg: This is our primary platform for internal projects and some of our larger, long running public projects like Android and Chromium. While we continue to develop on this platform, most of our open source activity has moved to GitHub to increase exposure and encourage community growth.
    • Distinct event types: Note that git-on-borg and GitHub APIs produce distinct sets of events—as such we will report activity metrics per platform. Where GitHub Event logs capture a wide range of activity from code creation and review to issue creation and comments, the Gerrit Event stream (used by git-on-borg) only captures code changes and reviews.
  • Driven by humans: We have created many automated bots and systems that can propose changes on various hosting platforms. We have intentionally filtered these data to focus on human-initiated activities.
  • Business and personal: Activity on GitHub reflects a mixture of Alphabet projects, third party projects, experimental efforts, and personal projects. Our metrics report on all of the above unless otherwise specified.
  • Alphabet contributors: Please note that unless additional detail is specified, activity counts attributed to Alphabet open source contributors will include our full-time employees as well as our extended Alphabet community (temps, vendors, contractors, and interns).
  • Active counts: Where possible, we will show ‘active users’ defined by logged activity within a specified timeframe (i.e. in month, year, etc) and ‘active repositories’ as those that have not been archived.
  • Activity types: This year we explore GitHub activity types in more detail. Note that in some cases we have removed “Watch Events” or articulated this as passive engagement. Additionally, GitHub added an event type “PullRequestReviewEvent” that started logging activity in August 2020, but we chose to remove this from our charts and aggregate counts as it invalidates year over year comparisons.
By Sophia Vargas, Research Analyst – Google Open Source Programs Office

New Case Studies About Google’s Use of Go

Go started in September 2007 when Robert Griesemer, Ken Thompson, and I began discussing a new language to address the engineering challenges we and our colleagues at Google were facing in our daily work. The software we were writing was typically a networked server—a single program interacting with hundreds of other servers—and over its lifetime thousands of programmers might be involved in writing and maintaining it. But the existing languages we were using didn't seem to offer the right tools to solve the problems we faced in this complex environment.

So, we sat down one afternoon and started talking about a different approach.

When we first released Go to the public in November 2009, we didn’t know if the language would be widely adopted or if it might influence future languages. Looking back from 2020, Go has succeeded in both ways: it is widely used both inside and outside Google, and its approaches to network concurrency and software engineering have had a noticeable effect on other languages and their tools.

Go has turned out to have a much broader reach than we had ever expected. Its growth in the industry has been phenomenal, and it has powered many projects at Google.
Credit to Renee French for the gopher illustration.

The earliest production uses of Go inside Google appeared in 2011, the year we launched Go on App Engine and started serving YouTube database traffic with Vitess. At the time, Vitess’s authors told us that Go was exactly the combination of easy network programming, efficient execution, and speedy development that they needed, and that if not for Go, they likely wouldn’t have been able to build the system at all.

The next year, Go replaced Sawzall for Google’s search quality analysis. And of course, Go also powered Google’s development and launch of Kubernetes in 2014.

In the past year, we’ve posted sixteen case studies from end users around the world talking about how they use Go to build fast, reliable, and efficient software at scale. Today, we are adding three new case studies from teams inside Google:
  • Core Data Solutions: Google’s Core Data team replaced a monolithic indexing pipeline written in C++ with a more flexible system of microservices, the majority of them written in Go, that help support Google Search.
  • Google Chrome: Mobile users of Google Chrome in lite mode rely on the Chrome Optimization Guide server to deliver hints for optimizing page loads of well-known sites in their geographic area. That server, written in Go, helps deliver faster page loads and lowered data usage to millions of users daily.
  • Firebase: Google Cloud customers turn to Firebase as their mobile and web hosting platform of choice. After joining Google, the team completely migrated its backend servers from Node.js to Go, for the easy concurrency and efficient execution.
We hope these stories provide the Go developer community with deeper insight into the reasons why teams at Google choose Go, what they use Go for, and the different paths teams took to those decisions.

If you’d like to share your own story about how your team or organization uses Go, please contact us.

By Rob Pike, Distinguished Engineer

Recapping major improvements in Go 1.15 and bringing the Go community together

The Latest Version of Go is Released

In August, the Go team released Go 1.15, marking another milestone of continuous improvements to the language. As always, many of the updates were supported by our community of contributors in collaboration with the engineering team here at Google.

Following our earlier release in February, the latest Go build brings a slew of performance improvements. We’ve made significant changes behind the scenes to the compiler, reducing binary sizes by about 5%, and improving building Go applications to be around 20% faster and requiring 30% less memory on average.

Go 1.15 also includes several updates to the core library, a few security improvements, and much more–you can dive into the full release notes here. We’re really excited to see how developers like you, ranging from those working on indie projects all the way to enterprise devs, will incorporate these updates into your projects.

A few users have been working with the release candidates ahead of the latest build and were kind enough to share their experience.

Wayne Ashley Berry, a Senior Engineer at Over, shared that “...seeing significant performance improvements in the new releases is incredible!” and, speaking of compiler improvements, showed “one of [their] services compiling ~1.3x faster” after upgrading to Go 1.15.

This mirrored our experience within Google, compiling larger Go applications like Kubernetes which experienced 30% memory reductions and 20% faster builds.

These are just a couple examples of how some users have already seen the benefits of Go 1.15. We’re looking forward to what the rest of the gopher community will do with it!

A Better Experience For Go Developers

Over the last few months we’ve also been hard at work improving a few things in the Go ecosystem. In July, the VS Code extension for Go officially joined the Go project and more recently, we rolled out a few updates for our online resources.

We brought a few important changes to pkg.go.dev, a central source of information for Go packages and modules. With these changes came functional improvements to make the browsing experience better and minor tweaks across the site (including a cute new gopher). We also made some changes to go.dev—our hub for Go developers—making it easier to navigate the site and find examples of Go’s use in the enterprise.
The new home page on pkg.go.dev. Credit to Renee French for the gopher illustration.
We’ll be bringing even more improvements to the Go ecosystem in the coming months, so stay tuned!

Our Commitment to Open Source and Google Open Source Live

Most of these changes wouldn’t be possible without contribution from our open source community through submitting CLs to our release process, organizing community meetups, and engaging in discussions about future changes (like generics).

Being part of the open source community is something that the Go team embraces, and Google as a whole works to support every year. It’s through this community that we’re able to iterate on our work with a constant feedback loop and bring new gophers into the Go ecosystem. We’re lucky to have the support of passionate Go advocates, and even get to celebrate the occasional community gopher design!

That being said, this has been a challenging year to gather in person for meetups or larger conferences. However, the gopher community has been incredibly resilient, with many meetups taking place virtually, several of which Go team members have been able to attend.

We’d like to help the entire open source community stay connected. In that vein, we’re excited to announce that Google will host a series of free virtual events, Google Open Source Live, every month through next year! As part of the series, on November 7th, members of the Go team will be sharing community updates, some things we’ve been up to, and a few best practices around getting started with Go.

Visit the official site for the Go Day on Google Open Source Live, to learn more about registration and speakers. To keep up-to-date with the Go team, make sure to follow the official Go twitter and visit go.dev, our hub for Go developers.

By Steve Francia Product Lead, Go Team

Google Open Source Live: A monthly connection for open source communities

Starting in September, open source experts at Google will have a new place to meet with you online: Google Open Source Live, a virtual event series to connect with open source communities with a focus on different technologies and areas of expertise. Google Open Source Live launches on September 3, 2020, and will provide monthly content for open source developers at all levels, contributors, and community members. 
The inaugural event of this series will be: The new open source: Leadership, contributions and sustainability, in which the Google Open Source Programs Office, together with Developer Relations specialists, will share an overview of the best ways to get involved and succeed in the open source ecosystem with four exciting sessions.

Given how the 2020 pandemic has affected the communities’s ability to stay engaged and connect, it is important to us to stay present in the ecosystem. Therefore, we made a conscious decision to build an event series for developers to have the opportunity to hear directly from the Google Open Source Programs Office, developer advocates and experts. Each day will provide impactful information in a 2-hour time frame.

Attendee Experience

After attending several virtual events throughout the Summer, we designed our platform with one idea in mind: to create an alternative platform for developers to gather, learn, and interact with experts, and have fun.

Attendees can interact with the experts and speakers with Live Q&A chat during the sessions, and join an after party following the event! It’ll provide a great interactive opportunity for activities and to connect with others.

Sept. 3 Agenda

“The New Open Source: Leadership, contributions and sustainability”
9 AM - 11 AM PST

Session

Topic 

Speaker

Hosted by Stephen Fluin, DevRel Lead and Dustin Ingram, Developer Advocate.  

1

"Be the leader you want in OSS"

Megan Byrd-Sanicki

Manager, Operations & Research

2

"5 simple things you can do to improve OSS docs"

Erin McKean, Docs Advocacy Program Manager, OSPO

3

Fireside Chat: "Business models and contributor engagement in OS"

Seth Vargo, Developer Advocate

Kaslin Fields, Developer Advocate

4

"Sustainability in OS"

Megan Byrd-Sanicki, Manager

 Operations & Research

Google Open Source Live Event Calendar

Each month will focus on one open source project or concept and feature several speakers who are subject matter experts in their fields. Events take place monthly on the first Thursday.


2020

Sep 3

Oct 1

Nov 5

Dec 3

The new open source:

Leadership, contributions and sustainability

Knative day

On Google Open Source Live

Go day

On Google Open Source Live


Kubernetes day

On Google Open Source Live


2021

Feb 4

Mar 4

Apr 1

May 6

Istio day

On Google Open Source Live

Bazel day

On Google Open Source Live

Beam day

On Google Open Source Live

Spark day

On Google Open Source Live

Jun 3

Jul 1

Aug 5

Sep 2

CDAP day

On Google Open Source Live

Airflow day

On Google Open Source Live

OSS Security day

On Google Open Source Live

TBD


Find out more 

Sign up to receive more details and alerts, and follow GoogleOSS@ and #GoogleOSlive for updates on Twitter.


By Jamie Rachel, Event Program Manager for Google Open Source

Season of Docs announces 2020 technical writing projects

Season of Docs has announced the technical writers participating in the program and their projects! You can view a list of organizations and technical writing projects on the website.

The program received over 500 technical writer applications, and with them, over 800 technical writing project proposals. The enthusiasm from the technical writing and open source communities has been amazing!

What is next?

During the community bonding period from August 17 to September 13, mentors must work with the technical writers to prepare them for the doc development phase. By the end of community bonding, the technical writer should be familiar with the open source project and community, understand the product as a whole, establish communication channels with the mentoring organization, and set clear goals and expectations for the project. These are critical to the successful completion of the technical writing project.

Documentation development begins on September 14, 2020.

What is Season of Docs?

Documentation is essential to the adoption of open source projects as well as to the success of their communities. Season of Docs brings together technical writers and open source projects to foster collaboration and improve documentation in the open source space. You can find out more about the program on the introduction page of the website.

During the program, technical writers spend a few months working closely with an open source community. They bring their technical writing expertise to the project's documentation and, at the same time, learn about the open source project and new technologies.

The open source projects work with the technical writers to improve the project's documentation and processes. Together, they may choose to build a new documentation set, redesign the existing docs, or improve and document the project's contribution procedures and onboarding experience.

General timeline
August 16Google announces the accepted technical writer projects
August 17 - September 13Community bonding: Technical writers get to know mentors and the open source community, and refine their projects in collaboration with their mentors
September 14 - December 5Technical writers work with open source mentors on the accepted projects, and submit their work at the end of the period
January 6, 2021Google publishes the list of successfully-completed projects

See the full timeline for details, including the provision for projects that run longer than three months.

Find out more

Explore the Season of Docs website at g.co/seasonofdocs to learn more about the program. Use our logo and other promotional resources to spread the word. Check out the FAQ for further questions!

By Kassandra Dhillon and Erin McKean, Program Managers, Google Open Source Programs Office

Open source by the numbers at Google

At Google, open source is at the core of our infrastructure, processes, and culture. As such, participation in these communities is vital to our productivity. Within OSPO (Open Source Programs Office), our mission is to bring the value of open source to Google and the resources of Google to open source. To ensure our actions match our commitment, in this post we will explore a variety of metrics intended to increase context, transparency, and accountability across all of the communities we engage with.

Why we contribute: Open source has become a pervasive component in modern software development, and Google is no exception. We use thousands of open source projects across our internal infrastructure and products. As participants in the ecosystem, our intentions are twofold: give back to the communities we depend on as well as expand support for open source overall. We firmly believe in open source and its ability to bring together users, contributors, and companies alike to deliver better software.

The majority of Google’s open source work is done within one of two hosting platforms: GitHub and git-on-borg, Google’s production Git service which integrates with Gerrit for code review and access control. While we also allow individual usage of Bitbucket, GitLab, Launchpad, and other platforms, this analysis will focus on GitHub and git-on-borg. We will continue to explore how best to incorporate activity across additional channels.

A little context about the numbers you’ll read below:
  • Business and personal: While git-on-borg hosts both internal and external Google created repos, GitHub is a mixture of Google projects, experimental efforts and personal projects created by Googlers.
  • Driven by humans: We have created many automated bots and systems that can propose changes on both hosting platforms. We have intentionally filtered these data to ensure we are only showing human initiated activities.
  • GitHub data: We are using GH Archive as the primary source for GitHub data, which is currently available as a public dataset on BigQuery. Google activity within GitHub is identified by self registered accounts, which we anticipate under reports actual usage as employees acclimate to our policies.
  • Active counts: Where possible, we will show ‘active users’ and ‘active repositories’ defined by logged activity within each specified timeframe (for GH archive data, that’s any event type logged in the public GitHub event stream).
As numbers mean nothing without scale, let’s start by defining our applicable community: In 2019, more than 9% of Alphabet’s full time employees actively contributed to public repositories on git-on-borg and GitHub. While single digit, this percentage represents a portion of all full time Alphabet employees—from engineers to marketers to admins, across every business unit in Alphabet—and does not include those who contribute to open source projects outside of code. As our population has grown, so has our registered contributor base:
This chart shows the aggregate per year counts of Googlers active on public repositories hosted on GitHub and git-on-borg

What we create: As mentioned above, our contributing population works across a variety of Google, personal, and external repositories. Over the years, Google has released thousands of open source projects (many of which span multiple repositories) and ~2,600 are still active. Today, Google hosts over 8,000 public repositories on GitHub and more than 1,000 public repositories on git-on-borg. Over the last five years, we have doubled the number of public repos, growing our footprint by an average of 25% per year.

What we work on: In addition to our own repositories, we contribute to a wide pool of external projects. In 2019, Googlers were active in over 70,000 repositories on GitHub, pushing commits and/or opening pull requests on over 40,000 repositories. Note that more than 75% of the repos with Googler-opened pull requests were outside of Google-managed organizations (on GitHub).
This charts shows per year counts of activities initiated by Googlers on GitHub

What we contribute: For contribution volume on GitHub, we chose to focus on push events, opened, and merged pull requests instead of commits as this metric on its own is difficult to contextualize. Note that push events and pull requests typically include one or more commits per event. In 2019, Googlers created over 570,000 issues, opened over 150,000 pull requests, and created more than 36,000 push events on GitHub. Since 2015, we have doubled our annual counts of issues created and push events, and more than tripled the number of opened pull requests. Over the last five years, more than 80% of pull requests opened by Googlers have been closed and merged into active repositories.

How we spend our time: Combining these two classes of metrics—contributions and repos—provides context on how our contributors focus their time. On GitHub: in 2015, about 40% of our opened pull requests were concentrated in just 25 repositories. However, over the next four years, our activity became more distributed across a larger set of projects, with the top 25 repos claiming about 20% of opened pull requests in 2019. For us, this indicates a healthy expansion and diversification of interests, especially given that this activity represents both Google, as well as a community of contributors that happen to work at Google.
This chart splits the total per year counts of Googler created pull requests on GitHub by Top 25 repos vs the remainder ranked by number of opened pull requests per repo per year.

Open source contribution is about more than code

Every day, Google relies on the health and continuing availability of open source, and as such we actively invest in the security and sustainability of open source and its supply chain in three key areas:
  • Security: In addition to building security projects like OpenTitan and gVisor, Google’s OSS-Fuzz project aims to help other projects identify programming errors in software. As of the end of 2019, OSS-Fuzz had over 250 projects using the project, filed over 16,000 bugs, including 3,500 security vulnerabilities.
  • Community: Open source projects depend on communities of diverse individuals. We are committed to improving community sustainability and growth with programs like Google Summer of Code and Season of Docs. Over the last 15 years, about 15,000 students from over 105 countries have participated in Google Summer of Code, along with 25,000 mentors in more than 115 countries working on more than 680 open source projects.
  • Research: At the end of 2019, Google invested $1 million in open source research, partnering with researchers at UVM, with the goal to deepen understanding of how people, teams and organizations thrive in technology-rich settings, especially in open-source projects and communities.
Learn more about our open source initiatives at opensource.google.

By Sophia Vargas – Researcher, Google Open Source Programs Office

Welcoming 1,000+ Interns to Open Source at Google

One of the core tenets of open source is about finding ways for people to build great things by working together, regardless of location. This summer, through our intern program we’re gathering incredible talent from schools around the world, Googlers with a passion for open source, and project maintainers both inside and outside of Google to see what we can build together. 

Onboarding that many interns and turning them into new open source contributors was no easy task. So in partnership with the Intern Programs team and engineering teams across Google, we’ve grounded our planning by answering four key questions. 

How can we make our internship program a force for good in the open source ecosystem?

We knew that having more than a thousand interns contribute to open source projects could have a huge impact, however, many projects aren’t set up to onboard dozens of new contributors at one time and many maintainers can’t take on hundreds of new pull requests. Early on, we established best practices for intern placement and support. We committed to:
  • Aligning interns’ work with project priorities to advance the project while also allowing the interns to learn and grow their skills.
  • Proactively communicating with project maintainers and contributors, keeping them in the loop on timelines and logistics.
  • Looking beyond Google. While we prioritized projects that have full-time Google engineerings support. That includes Google-owned projects like Go, TensorFlow, and Chromium, as well as Google-created projects we invest heavily in, such as Kubernetes, Apache Beam, and Tekton. But Google also has full-time engineers working on outside projects we rely on, so our interns will also be working on projects like Envoy, Rust, and Apache Maven.

How can we introduce the interns to open source at Google?

We are determined to support and empower the interns as they become lifelong contributors to open source. Every Noogler in engineering learns about using and contributing to open source in a training run by our Open Source Programs Office. With an unprecedented number of interns working on open source projects, we are also providing additional resources; from offering a platform for questions, office hours, enrichment talks, and partnerships with external open source organizations.

How can we learn from our interns about the experience of contributing to open source at Google and beyond?

We see a huge opportunity to listen to our interns this summer. By meeting with interns and hosts—as well as surveying the entire class of interns at the end of the summer—we can look for ways to improve open source at Google and the contributor experience for projects they’re working on. We’re excited to learn from the internship program and from interns’ perspectives working in and contributing to open source.

How can we have an impact on these students that carries on throughout their careers?

One of my favorite questions to ask Googlers who are active in open source is how they were first introduced to open source. There’s a well-trodden path of a developer fixing an annoying bug, then a few more bugs, then adding small features, becoming a core contributor, and eventually a project maintainer. That process requires persistence and patience, and projects lose a lot of great developers along the way.

But... What if your first experience with open source is being welcomed into a large and thriving community of contributors? What if you get to contribute to open source full time, mentored by creators and maintainers of the project you’re working on, collaborating across organizations and across time zones? Our hope is that this kind of experience will leave a lasting impression on this summer’s interns and that they’ll continue to contribute to open source for a long time to come.

By Jen Phillips, Google Open Source

COVID-19: How Google is helping the open source community

COVID-19 has affected so much of the world around us, and open source is no exception. Project resilience is being challenged by COVID-19. Community members have even less time to contribute. Event cancellations are impacting networking, collaboration, and fundraising.


Google wants to do everything it can to help. This means that it’s even more important for the Google Open Source Programs Office to step up our commitment to citizenship. We’re taking several steps to support industry organizations and the projects that we participate in to help them operate during this time.

Virtual Events Support

  • Participating in talks internally and externally to Google to share knowledge and insight into open source projects and practices with the wider open source communities.
  • To support the shift from an offline to online events model, we created an online guide to share resources and event planning knowledge: Open Source Virtual Events Guide.

Talent

  • COVIDActNow is a multidisciplinary team working to provide disease intelligence and data analysis on COVID in the U.S. Google contributed to this project by improving their data pipeline allowing for county level data visualization, providing more localized insight for crisis planning.
  • Nextstrain is a platform for real-time tracking of pathogen evolution. Google contributed engineering, design, and translation resources to help scientists conduct research into real-time tracking of pathogen evolution.
  • Schema.org - Google led Schema.org rapid response designs for structured data markup to contribute to the COVID-19 global response, leading to the UK making similar announcements.
  • Google’s annual internship program was converted to a digital program where interns will focus on open source projects, allowing projects to gain new contributors in a non-traditional environment.
  • Google Summer of Code brings over 1100 university students from around the world together with open source communities, many of which are working on various humanitarian efforts related to COVID-19. The program is completely online so students can work with their mentors remotely, allowing all organizations to continue receiving the support they need.
The impact from COVID-19 will have long-term effects on many organizations and projects that may not be immediately apparent. In the coming months, we will monitor the needs of projects and organizations across open source. We understand the value of open source not just to the tech world, but the impact it has on bringing communities together; Google has a long standing history in open source and we will continue supporting our community to stay strong during and after the passing of COVID-19.

We encourage folks who have the time and ability to support open source communities to do so by getting involved and reaching out directly to organizations that interest you. This is a time for all of us to come together and lift up each other and open source.

By Megan Byrd-Sanicki and Radha Jhatakia, Google Open Source

Google Summer of Code 2020 Statistics: Part 1

Since 2005, Google Summer of Code (GSoC) has been bringing new developers into the open source community every year. This year, we accepted 1,199 from 66 countries into the 2020 GSoC program to work with 199 open source organizations over the summer. Students began coding June 1st and will spend the next 12 weeks working closely under the guidance from mentors from their open source communities.

Each year we like to share program statistics about the GSoC program and the accepted students and mentors involved in the program. 6,626 students from 121 countries submitted 8,903 applications for this year’s program.

Accepted Students

  • 86.6% are participating in their first GSoC
  • 71.7% are first time applicants to GSoC

Degrees

  • 77.4% are undergraduates, 16.8% are masters students, and 5.8% are in PhD programs
  • 72.5% are Computer Science majors, 3.6% are Mathematics majors, 23.9% are other majors including many from engineering fields like Electrical, Mechanical, Aerospace, etc.
  • Students are studying in a variety of fields including Atmospheric Science, Finance, Neuroscience, Economics, Biophysics, Linguistics, Geology, Pharmacy and Real estate.

Proposals

There were a record number of students submitting proposals for the program this year:
  • 6,626 students (18.2% increase from last year)
  • 121 countries
  • 8,902 proposals submitted

Registrations

We had a record breaking 51,244 students from 178 countries(!) register for the program this year—that’s a 65% increase in registrations from last year’s record numbers!

In our next GSoC statistics post, we will do a deeper dive into the schools and mentors for the 2020 program.

By Stephanie Taylor, Google Open Source