Posted by Nevin Mital - Developer Relations Engineer, Android Media

The Android ecosystem features a diverse range of devices, and it can be difficult to build experiences that take advantage of new or premium hardware features while still working well for users on all devices. With Android 12, we introduced the Media Performance Class (MPC) standard to help developers better understand a device’s capabilities and identify high-performing devices. For a refresher on what MPC is, please see our last blog post, Using performance class to optimize your user experience, or check out the Performance Class documentation.
Earlier this year, we published the first stable release of the Jetpack Core Performance library as the recommended solution for more reliably obtaining a device’s MPC level. In particular, this library introduces the PlayServicesDevicePerformance class, an API that queries Google Play Services to get the most up-to-date MPC level for the current device and build. I’ll get into the technical details further down, but let’s start by taking a look at how Google Maps was able to tailor a feature launch to best fit each device with MPC.
Performance Class unblocks premium experience launch for Google Maps
Google Maps recently took advantage of the expanded device coverage enabled by the Play Services module to unblock a feature launch. Google Maps wanted to update their UI by increasing the transparency of some layers. Consequently, this meant they would need to render more of the map, and found they had to stop the rollout due to latency increases on many devices, especially towards the low-end. To resolve this, the Maps team started by slicing an existing key metric, “seconds to UI item visibility”, by MPC level, which revealed that while all devices had a small increase in this latency, devices without an MPC level had the largest increase.
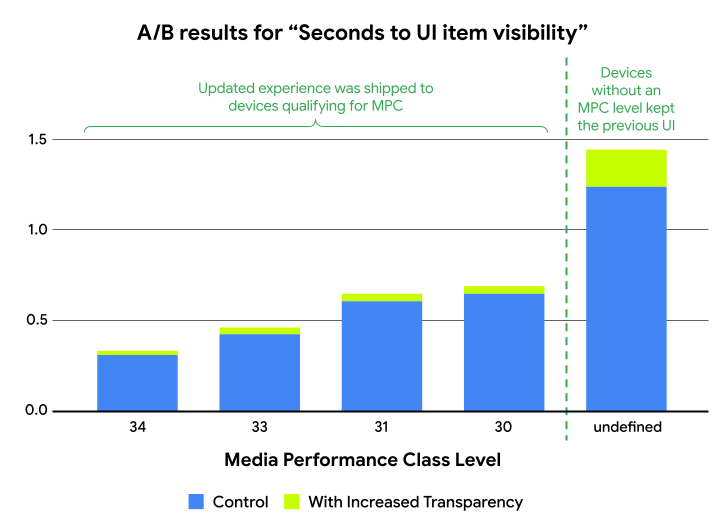
With these results in hand, Google Maps started their rollout again, but this time only launching the feature on devices that report an MPC level. As devices continue to get updated and meet the bar for MPC, the updated Google Maps UI will be available to them as well.
The new Play Services module
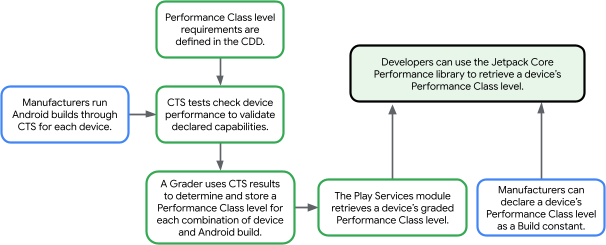
MPC level requirements are defined in the Android Compatibility Definition Document (CDD), then devices and Android builds are validated against these requirements by the Android Compatibility Test Suite (CTS). The Play Services module of the Jetpack Core Performance library leverages these test results to continually update a device’s reported MPC level without any additional effort on your end. This also means that you’ll immediately have access to the MPC level for new device launches without needing to acquire and test each device yourself, since it already passed CTS. If the MPC level is not available from Google Play Services, the library will fall back to the MPC level declared by the OEM as a build constant.
As of writing, more than 190M in-market devices covering over 500 models across 40+ brands report an MPC level. This coverage will continue to grow over time, as older devices update to newer builds, from Android 11 and up.
Using the Core Performance library
To use Jetpack Core Performance, start by adding a dependency for the relevant modules in your Gradle configuration, and create an instance of DevicePerformance. Initializing a DevicePerformance should only happen once in your app, as early as possible - for example, in the onCreate() lifecycle event of your Application. In this example, we’ll use the Google Play services implementation of DevicePerformance.
// Implementation of Jetpack Core library.
implementation("androidx.core:core-ktx:1.12.0")
// Enable APIs to query for device-reported performance class.
implementation("androidx.core:core-performance:1.0.0")
// Enable APIs to query Google Play Services for performance class.
implementation("androidx.core:core-performance-play-services:1.0.0")
import androidx.core.performance.play.services.PlayServicesDevicePerformance

class MyApplication : Application() {
  lateinit var devicePerformance: DevicePerformance

  override fun onCreate() {
    // Use a class derived from the DevicePerformance interface
    devicePerformance = PlayServicesDevicePerformance(applicationContext)
  }
}
Then, later in your app when you want to retrieve the device’s MPC level, you can call getMediaPerformanceClass():
class MyActivity : Activity() {
  private lateinit var devicePerformance: DevicePerformance
  override fun onCreate(savedInstanceState: Bundle?) {
    super.onCreate(savedInstanceState)
    // Note: Good app architecture is to use a dependency framework. See
    // https://developer.android.com/training/dependency-injection for more
    // information.
    devicePerformance = (application as MyApplication).devicePerformance
  }

  override fun onResume() {
    super.onResume()
    when {
      devicePerformance.mediaPerformanceClass >= Build.VERSION_CODES.UPSIDE_DOWN_CAKE -> {
        // MPC level 34 and later.
        // Provide the most premium experience for the highest performing devices.
      }
      devicePerformance.mediaPerformanceClass == Build.VERSION_CODES.TIRAMISU -> {
        // MPC level 33.
        // Provide a high quality experience.
      }
      else -> {
        // MPC level 31, 30, or undefined.
        // Remove extras to keep experience functional.
      }
    }
  }
}
Strategies for using Performance Class
MPC is intended to identify high-end devices, so you can expect to see MPC levels for the top devices from each year, which are the devices you’re likely to want to be able to support for the longest time. For example, the Pixel 9 Pro released with Android 14 and reports an MPC level of 34, the latest level definition when it launched.
You should use MPC as a complement to any existing Device Clustering solutions you already use, such as querying a device’s static specs or manually blocklisting problematic devices. An area where MPC can be a particularly helpful tool is for new device launches. New devices should be included at launch, so you can use MPC to gauge new devices’ capabilities right from the start, without needing to acquire the hardware yourself or manually test each device.
A great first step to get involved is to include MPC levels in your telemetry. This can help you identify patterns in error reports or generally get a better sense of the devices your user base uses if you segment key metrics by MPC level. From there, you might consider using MPC as a dimension in your experimentation pipeline, for example by setting up A/B testing groups based on MPC level, or by starting a feature rollout with the highest MPC level and working your way down. As discussed previously, this is the approach that Google Maps took.
You could further use MPC to tune a user-facing feature, for example by adjusting the number of concurrent video playbacks your app attempts based on the MPC level’s concurrent codec guarantees. However, make sure to still query a device’s runtime capabilities when using this approach, as they may differ depending on the environment and state the device is in.
Get in touch!
If MPC sounds like it could be useful for your app, please give it a try! You can get started by taking a look at our sample code or documentation. We welcome you to share any questions or feedback you have in this short form.
This blog post is a part of Camera and Media Spotlight Week. We're providing resources – blog posts, videos, sample code, and more – all designed to help you uplevel the media experiences in your app.
To learn more about what Spotlight Week has to offer and how it can benefit you, be sure to read our overview blog post.


.gif)