Tag Archives: Health

Google supports COVID-19 AI and data analytics projects

Nonprofits, universities and other academic institutions around the world are turning to artificial intelligence (AI) and data analytics to help us better understand COVID-19 and its impact on communities—especially vulnerable populations and healthcare workers. To support this work, Google.org is giving more than $8.5 million to 31 organizations around the world to aid in COVID-19 response. Three of these organizations will also receive the pro-bono support of Google.org Fellowship teams

This funding is part of Google.org’s $100 million commitment to COVID-19 relief and focuses on four key areas where new information and action is needed to help mitigate the effects of the pandemic.


Monitoring and forecasting disease spread

Understanding the spread of COVID-19 is critical to informing public health decisions and lessening its impact on communities. We’re supporting the development of data platforms to help model disease and projects that explore the use of diverse public datasets to more accurately predict the spread of the virus.


Improving health equity and minimizing secondary effects of the pandemic

COVID-19 has had a disproportionate effect on vulnerable populations. To address health disparities and drive equitable outcomes, we’re supporting efforts to map the social and environmental drivers of COVID-19 impact, such as race, ethnicity, gender and socioeconomic status. In addition to learning more about the immediate health effects of COVID-19, we’re also supporting work that seeks to better understand and reduce the long-term, indirect effects of the virus—ranging from challenges with mental health to delays in preventive care.


Slowing transmission by advancing the science of contact tracing and environmental sensing

Contact tracing is a valuable tool to slow the spread of disease. Public health officials around the world are using digital tools to help with contact tracing. Google.org is supporting projects that advance science in this important area, including research investigating how to improve exposure risk assessments while preserving privacy and security. We’re also supporting related research to understand how COVID-19 might spread in public spaces, like transit systems.


Supporting healthcare workers

Whether it’s working to meet the increased demand for acute patient care, adapting to rapidly changing protocols or navigating personal mental and physical wellbeing, healthcare workers face complex challenges on the frontlines. We’re supporting organizations that are focused on helping healthcare workers quickly adopt new protocols, deliver more efficient care, and better serve vulnerable populations. 

Together, these organizations are helping make the community’s response to the pandemic more advanced and inclusive, and we’re proud to support these efforts. You can find information about the organizations Google.org is supporting below.  

Monitoring and forecasting disease spread

  • Carnegie Mellon University*: informing public health officials with interactive maps that display real-time COVID-19 data from sources such as web surveys and other publicly-available data.

  • Keio University: investigating the reliability of large-scale surveys in helping model the spread of COVID-19.

  • University College London:modeling the prevalence of COVID-19 and understanding its impact using publicly-available aggregated, anonymized search trends data.  

  • Boston Children's Hospital, Oxford University, Northeastern University*: building a platform to support accurate and trusted public health data for researchers, public health officials and citizens.

  • Tel Aviv University: developing simulation models using synthetic data to investigate the spread of COVID-19 in Israel.

  • Kampala International University, Stanford University, Leiden University, GO FAIR: implementing data sharing standards and platforms for disease modeling for institutions across Uganda, Ethiopia, Nigeria, Kenya, Tunisia and Zimbabwe. 

Improving health equity and minimizing secondary effects of the pandemic 

  • Morehouse School of Medicine’s Satcher Health Leadership Institute*: developing an interactive, public-facing COVID-19 Health Equity Tracker of the United States. 

  • Florida A&M University, Shaw University: examining structural social determinants of health and the disproportionate impact of COVID-19 in communities of color in Florida and North Carolina.

  • Boston University School of Public Health:investigating the drivers of racial, ethnic and socioeconomic disparities in the causes and consequences of COVID-19, with a focus on Massachusetts.

  • University of North Carolina, Vanderbilt University:investigating molecular mechanisms underlying susceptibility to SARS-CoV-2 and variability in COVID-19 outcomes in Hispanic/Latinx populations. 

  • Beth Israel Deaconess Medical Center: quantifying the impact of COVID-19 on healthcare not directly associated with the virus, such as delayed routine or preventative care.

  • Georgia Institute of Technology:investigating opportunities for vulnerable populations to find information related to COVID-19. 

  • Cornell Tech:developing digital tools and resources for advocates and survivors of intimate partner violence during COVID-19. 

  • University of Michigan School of Information: evaluating health equity impacts of the rapid virtualization of primary healthcare. 

  • Indian Institute of Technology Gandhinagar: modeling the impact of air pollution on COVID-related secondary health exacerbations. 

  • Cornell University, EURECOM:developing scalable and explainable methods for verifying claims and identifying misinformation about COVID-19.

Slowing transmission by advancing the science of contact tracing and environmental sensing

  • Arizona State University:applying federated analytics (a state-of-the-art, privacy-preserving analytic technique) to contact tracing, including an on-campus pilot.

  • Stanford University:applying sparse secure aggregation to detect emerging hotspots.

  • University of Virginia, Princeton University, University of Maryland:designing and analyzing effective digital contact tracing methods. 

  • University of Washington: investigating environmental SARS-CoV-2 detection and filtration methods in bus lines and other public spaces. 

  • Indian Institute of Science, Bengaluru:mitigating the spread of COVID-19 in India’s transit systems with rapid testing and modified commuter patterns. 

  • TU Berlin, University of Luxembourg:using quantum mechanics and machine learning to understand the binding of SARS-CoV-2 spike protein to human cells—a key process in COVID-19 infection.

Supporting healthcare workers 

  • Medic Mobile, Dimagi: developing data analytics tools to support frontline health workers in countries such as India and Kenya.

  • Global Strategies:developing software to support healthcare workers adopting COVID-19 protocols in underserved, rural populations in the U.S., including Native American communities. 

  • C Minds:creating an open-source, AI-based support system for clinical trials related to COVID-19.  

  • Hospital Israelita Albert Einstein:supporting and integrating community health workers and volunteers to help deliver mental health services and monitor outcomes in one of Brazil's most vulnerable communities.

  • Fiocruz Bahia, Federal University of Bahia:establishing an AI platform for research and information-sharing related to COVID-19 in Brazil.

  • RAD-AID:creating and managing a data lake for institutions in low- and middle-income countries to pool anonymized data and access AI tools.  

  • Yonsei University College of Medicine: scaling and distributing decision support systems for patients and doctors to better predict hospitalization and intensive care needs due to COVID-19.

  • University of California Berkeley and Gladstone Institutes: developing rapid at-home CRISPR-based COVID-19 diagnostic tests using cell phone technology. 

  • Fondazione Istituto Italiano di Tecnologia:enabling open-source access to anonymized COVID-19 chest X-ray and clinical data, and researching image analysis for early diagnosis and prognosis.

*Recipient of a Google.org Fellowship 

Using symptoms search trends to inform COVID-19 research

Search is often where people come to get answers on health and wellbeing, whether it’s to find a doctor or treatment center, or understand a symptom better just before a doctor's visit. In the past, researchers have used Google Search data to gauge the health impact of heatwaves, improve prediction models for influenza-like illnesses, and monitor Lyme disease incidence. Today we’re making available a dataset of search trends for researchers to study the link between symptom-related searches and the spread of COVID-19. We hope this data could lead to a better understanding of the pandemic’s impact.

fever-2x.gif

Using the dataset, researchers can develop models and create visualizations based on the popularity of symptom-related searches. This sample visualization is based on search volume for fever across the U.S. This visualization does not reflect the dataset’s user interface but shows what can be generated. 

How search trends can support COVID-19 research 

The COVID-19 Search Trends symptoms dataset includes aggregated, anonymized search trends for more than 400 symptoms, signs and health conditions, such as cough, fever and difficulty breathing. The dataset includes trends at the U.S. county-level from the past three years in order to make the insights more helpful to public health, and so researchers can account for changes in searches due to seasonality.


Public health currently uses a range of datasets to track and forecast the spread of COVID-19. Researchers could use this dataset to study if search trends can provide an earlier and more accurate indication of the reemergence of the virus in different parts of the country. And since measures such as shelter-in-place have reduced the accessibility of care and affected people’s wellbeing more generally, this dataset—which covers a broad range of symptoms and conditions, from diabetes to stress—could also be useful in studying the secondary health effects of the pandemic.

The dataset is available in Google Cloud's COVID-19 Free Public Dataset Program and is downloadable in CSV format from Google Research at Open COVID-19 Data GitHub repository

Advancing health research with privacy protections

The COVID-19 Search Trends symptoms dataset is powered by the same anonymization technology that we use in the Community Mobility Reports and other Google products every day. No personal information or individual search queries are included. The dataset was produced using differential privacy, a state-of-the-art technique that adds random noise to the data to provide privacy guarantees while preserving the overall quality of the data.

Similar to Google Trends, the data is normalized based on a symptom’s relative popularity, allowing researchers to study spikes in search interest over different time periods, without exposing any individual query or even the number of queries in any given area. 

More information about the privacy methods used to generate the dataset can be found in this report.

What’s next

This early release is limited to the United States and covers searches made in English and Spanish. It covers all states and many counties, where the available data meets quality and privacy thresholds. It was developed to specifically aid research on COVID-19, so we intend to make the dataset available for the duration of the pandemic. 

As we receive feedback from public health researchers, civil society groups and the community at large, we’ll evaluate and expand this dataset by including additional countries and regions. 

Researchers and public health experts are doing incredible work to respond to the pandemic. We hope this dataset will be useful in their work towards stopping the spread of COVID-19.

Source: Search


Using Machine Learning to Detect Deficient Coverage in Colonoscopy Screenings

Colorectal cancer (CRC) is a global health problem and the second deadliest cancer in the United States, resulting in an estimated 900K deaths per year. While deadly, CRC can be prevented by removing small precancerous lesions in the colon, called polyps, before they become cancerous. In fact, it is estimated that a 1% increase in the adenoma detection rate (ADR, defined as the fraction of procedures in which a physician discovers at least one polyp) can lead to a 6% decrease in the rate of interval CRCs (a CRC that is diagnosed within 60 months of a negative colonoscopy).

Colonoscopy is considered the gold standard procedure for the detection and removal of polyps. Unfortunately, the literature indicates that endoscopists miss on average 22%-28% of polyps during colonoscopies; furthermore, 20% to 24% of polyps that have the potential to become cancerous (adenomas) are missed. Two major factors that may cause an endoscopist to miss a polyp are (1) the polyp appears in the field of view, but the endoscopist misses it, perhaps due to its small size or flat shape; and (2) the polyp does not appear in the field of view, as the endoscopist has not fully covered the relevant area during the procedure.

In “Detecting Deficient Coverage in Colonoscopies”, we introduce the Colonoscopy Coverage Deficiency via Depth algorithm, or C2D2, a machine learning-based approach to improving colonoscopy coverage. The C2D2 algorithm performs a local 3D reconstruction of the colon as images are captured during the procedure, and on that basis, identifies which areas of the colon were covered and which remained outside of the field of view. C2D2 can then indicate in real time whether a particular area of the colon has suffered from deficient coverage so the endoscopist can return to that area. Our work proposes a novel approach to compute coverage in real time, for which 3D reconstruction is done using a calibration-free, unsupervised learning method, and evaluate it in a large scale way.

The C2D2 Algorithm
When considering colon coverage, it is important to estimate the coverage fraction — what percentage of the relevant regions were covered by a complete procedure. While a retrospective analysis is useful for the physician and could provide general guidance for future procedures, it is more useful to have real-time estimation of coverage fraction, on a segment by segment basis, i.e. knowledge of what fraction of the current segment has been covered while traversing the colon. The helpfulness of such functionality is clear: during the procedure itself, a physician may be alerted to segments with deficient coverage, and can immediately return to review these areas. Higher coverage will result in a higher proportion of polyps being seen.

The C2D2 algorithm is designed to compute such a segment-by-segment coverage in two phases: computing depth maps for each frame of the colonoscopy video, followed by computation of coverage based on these depth maps.

C2D2 computes a depth image from a single RGB image. Then, based on the computed depth images for a video sequence, C2D2 calculates local coverage, so it can detect where the coverage has been deficient and a second look is required.

Depth map creation consists of both depth estimation as well as pose estimation — the localization of where the endoscope is in space, as well as the direction it is pointing. In addition to the detection of deficient coverage, depth and pose estimation are useful for a variety of other interesting tasks. For example, depth can be used for improved detection of flat polyps, while pose estimation can be used for relocalizing areas of the colon (including polyps) that the endoscopist wishes to revisit, and both together can be used for visualization and navigation.

Top row: RGB image, from which the depth is computed. Bottom row: Depth image as computed by C2D2. Yellow is deeper, blue is shallower. Note that the “tunnel” structure is captured, as well as the Haustral ridges.

In order to compute coverage fractions from these depth maps, we trained C2D2 on two sources of data: synthetic sequences and real sequences. We generated the synthetic videos using a graphical model of a colon. For each synthetic video, ground truth coverage is available in the form of a number between 0 (completely uncovered) and 1 (completely covered). For real sequences, we analyzed de-identified colonoscopy videos, for which ground truth coverage is unavailable.

Performance on Synthetic Videos
When using synthetic videos, the availability of ground truth coverage enables the direct measurement of C2D2’s performance. We quantify this using the mean absolute error (MAE), which indicates how much the algorithm’s prediction differs, on average, from the ground truth. We find that C2D2’s MAE = 0.075; meaning that, on average, the prediction of C2D2 is within 7.5% of the ground truth. By contrast, a group of physicians given the same task achieved MAE = 0.177, i.e., within 17.7% of the ground truth. Thus, the C2D2 attained an accuracy rate 2.4 times higher on synthetic sequences.

Performance on Real Videos
Of course, what matters most is performance on videos of real colonoscopies. The challenge in this case is the absence of ground truth labelling: we don’t know what the actual coverage is. Additionally, one cannot use labels provided by experts directly as they are not always accurate, due to the challenges described earlier. However, C2D2 can still perform inference on real colonoscopy videos. Indeed, the learning pipeline is designed to perform equally well on synthetic and real colonoscopy videos.

To verify performance on real sequences, we used a variant of a technique common in the generative modelling literature, which involves providing video sequences to human experts along with C2D2’s coverage scores for those sequences. We then ask the experts to assess whether C2D2’s score is correct. The idea is that while it is difficult for experts to assign a score directly, the task of verifying a given score is considerably easier. (This is similar to the fact that verifying a proposed solution to an algorithmic problem is generally much easier than computing that solution.) Using this methodology, experts verified C2D2’s score 93% of the time. And in a more qualitative sense, C2D2’s output seems to pass the “eyeball test”, see the figure below.

Coverage on real colonoscopy sequences. Top row: Frames from a well covered sequence — the entire “tunnel” down the lumen may be seen; C2D2 coverage = 0.931. Middle row: A partially covered sequence — the bottom may be seen, but the top is not as visible; C2D2 coverage = 0.427. Bottom row: A poorly covered sequence, much of what is seen is the wall; C2D2 coverage = 0.227.

Next steps
By alerting physicians to missed regions of the colon wall, C2D2 promises to lead to the discovery of more adenomas, thereby increasing the ADR and concomitantly decreasing the rate of interval CRC. This would be of tremendous benefit to patients.

In addition to this work that addresses colonoscopy coverage, we are concurrently conducting research to improve polyp detection by combining C2D2 with an automatic, real-time polyp detection algorithm. This study adds to the mounting evidence that physicians may use machine learning methods to augment their efforts, especially during procedures, to improve the quality of care for patients.

Acknowledgements
This research was conducted by Daniel Freedman, Yochai Blau, Liran Katzir, Amit Aides, Ilan Shimshoni, Danny Veikherman, Tomer Golany, Ariel Gordon, Greg Corrado, Yossi Matias, and Ehud Rivlin, with support from Verily. We would like to thank all of our team members and collaborators who worked on this project with us, including: Nadav Rabani, Chen Barshai, Nia Stoykova, David Ben-Shimol, Jesse Lachter, and Ori Segol, 3D-Systems and many others. We'd also like to thank Yossi Matias for support and guidance. The research was conducted by teams from Google Health and Google Research, Israel.

Source: Google AI Blog


Using AI to identify the aggressiveness of prostate cancer

Prostate cancer diagnoses are common, with 1 in 9 men developing prostate cancer in their lifetime. A cancer diagnosis relies on specialized doctors, called pathologists, looking at biological tissue samples under the microscope for signs of abnormality in the cells. The difficulty and subjectivity of pathology diagnoses led us to develop an artificial intelligence (AI) system that can identify the aggressiveness of prostate cancer.

Since many prostate tumors are non-aggressive, doctors first obtain small samples (biopsies) to better understand the tumor for the initial cancer diagnosis. If signs of tumor aggressiveness are found, radiation or invasive surgery to remove the whole prostate may be recommended. Because these treatments can have painful side effects, understanding tumor aggressiveness is important to avoid unnecessary treatment.

Grading the biopsies

One of the most crucial factors in this process is to “grade” any cancer in the sample for how abnormal it looks, through a process called Gleason grading. Gleason grading involves first matching each cancerous region to one of three Gleason patterns, followed by assigning an overall “grade group” based on the relative amounts of each Gleason pattern in the whole sample. Gleason grading is a challenging task that relies on subjective visual inspection and estimation, resulting in pathologists disagreeing on the right grade for a tumor as much as 50 percent of the time. To explore whether AI could assist in this grading, we previously developed an algorithm that Gleason grades large samples (i.e. surgically-removed prostates) with high accuracy, a step that confirms the original diagnosis and informs patient prognosis.

Our research

In our recent work, “Development and Validation of a Deep Learning Algorithm for Gleason Grading of Prostate Cancer from Biopsy Specimens”, published in JAMA Oncology, we explored whether an AI system could accurately Gleason grade smaller prostate samples (biopsies). Biopsies are done during the initial part of prostate cancer care to get the initial cancer diagnosis and determine patient treatment, and so are more commonly performed than surgeries. However, biopsies can be more difficult to grade than surgical samples due to the smaller amount of tissue and unintended changes to the sample from tissue extraction and preparation process. The AI system we developed first “grades” each region of biopsy, and then summarizes the region-level classifications into an overall biopsy-level score.

Gleason grading

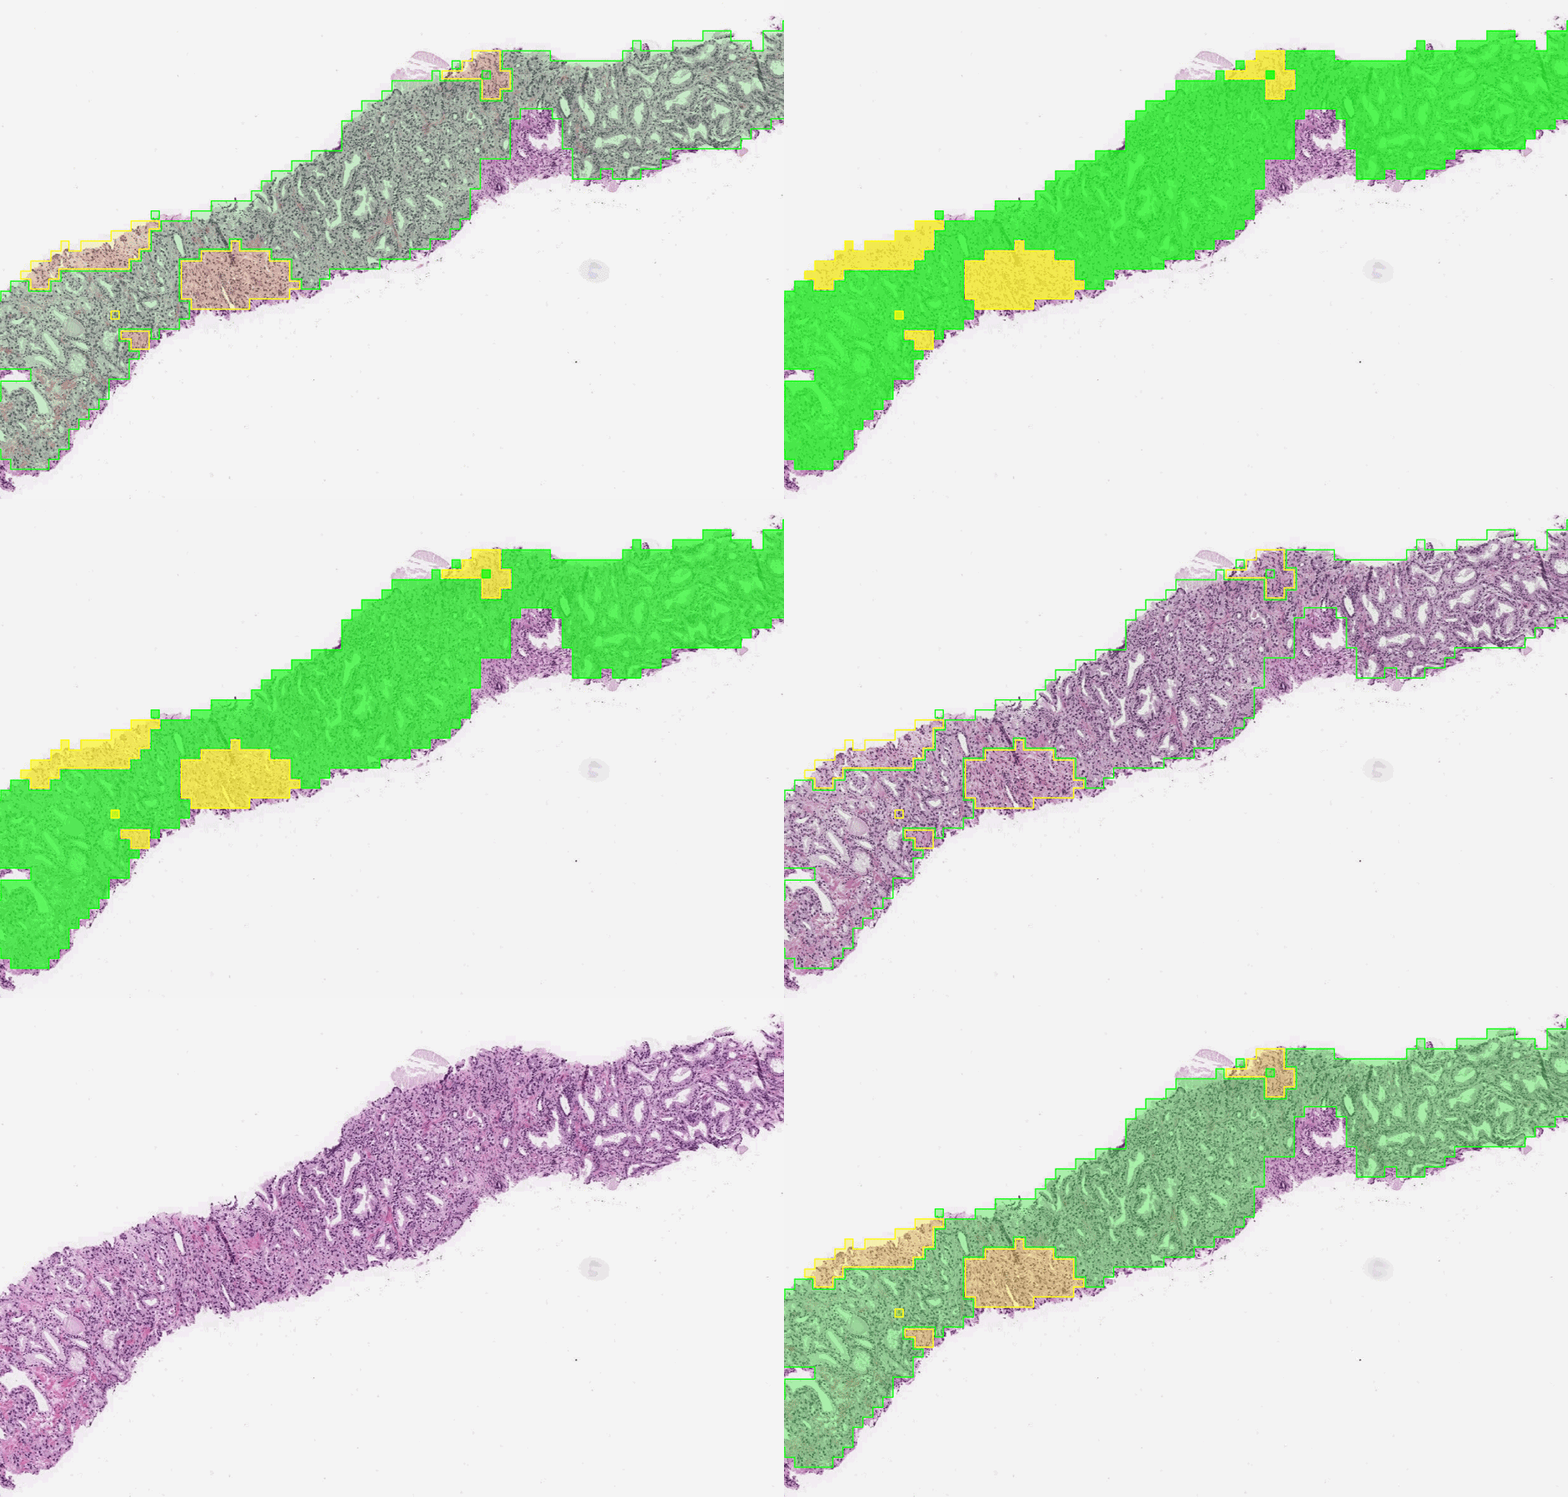
The first stage of the deep learning system Gleason grades every region in a biopsy. In this biopsy, green indicates Gleason pattern 3 while yellow indicates Gleason pattern 4.

Our results 

Given the complexity of Gleason grading, we worked with six experienced expert pathologists to evaluate the AI system. These experts, who have specialized training in prostate cancer and an average of 25 years of experience, determined the Gleason grades of 498 tumor samples. Highlighting how difficult Gleason grading is, a cohort of 19 “general” pathologists (without specialist training in prostate cancer) achieved an average accuracy of 58 percent on these samples. By contrast, our AI system’s accuracy was substantially higher at 72 percent. Finally, some prostate cancers have ambiguous appearances, resulting in disagreements even amongst experts. Taking this uncertainty into account, the deep learning system’s agreement rate with experts was comparable to the agreement rate between the experts themselves.

Cancer pathology workflow

Potential cancer pathology workflow augmented with AI-based assistive tools: a tumor sample is first collected and digitized using a high-magnification scanner. Next, the AI system provides a grade group for each sample.

These promising results indicate that the deep learning system has the potential to support expert-level diagnoses and expand access to high-quality cancer care. To evaluate if it could improve the accuracy and consistency of prostate cancer diagnoses, this technology needs to be validated as an assistive tool in further clinical studies and on larger and more diverse patient groups. However, we believe that AI-based tools could help pathologists in their work, particularly in situations where specialist expertise is limited.

Our research advancements in both prostate and breast cancer were the result of collaborations with the Naval Medical Center San Diego and support from Verily. Our appreciation also goes to several institutions that provided access to de-identified data, and many pathologists who provided advice or reviewed prostate cancer samples. We look forward to future research and investigation into how our technology can be best validated, designed and used to improve patient care and cancer outcomes.

Exploring Faster Screening with Fewer Tests via Bayesian Group Testing


How does one find a needle in a haystack? At the turn of World War II, that question took on a very concrete form when doctors wondered how to efficiently detect diseases among those who had been drafted into the war effort. Inspired by this challenge, Robert Dorfman, a young statistician at that time (later to become Harvard professor of economics), proposed in a seminal paper a 2-stage approach to detect infected individuals, whereby individual blood samples first are pooled in groups of four before being tested for the presence or absence of a pathogen. If a group is negative, then it is safe to assume that everyone in the group is free of the pathogen. In that case, the reduction in the number of required tests is substantial: an entire group of four people has been cleared with a single test. On the other hand, if a group tests positive, which is expected to happen rarely if the pathogen’s prevalence is small, at least one or more people within that group must be positive; therefore, a few more tests to determine the infected individuals are needed.
Left: Sixteen individual tests are required to screen 16 people — only one person’s test is positive, while 15 return negative. Right: Following Dorfman’s procedure, samples are pooled into four groups of four individuals, and tests are executed on the pooled samples. Because only the second group tests positive, 12 individuals are cleared and only those four belonging to the positive group need to be retested. This approach requires only eight tests, instead of the 16 needed for an exhaustive testing campaign.
Dorfman’s proposal triggered many follow-up works with connections to several areas in computer science, such as information theory, combinatorics or compressive sensing, and several variants of his approach have been proposed, notably those leveraging binary splitting or side knowledge on individual infection probability rates. The field has grown to the extent that several sub-problems are recognized and deserving of an entire literature on their own. Some algorithms are tailored for the noiseless case in which tests are perfectly reliable, whereas some consider instead the more realistic case where tests are noisy and may produce false negatives or positives. Finally, some strategies are adaptive, proposing groups based on test results already observed (including Dorfman’s, since it proposes to re-test individuals that appeared in positive groups), whereas others stick to a non-adaptive setting in which groups are known beforehand or drawn at random.

In “Noisy Adaptive Group Testing using Bayesian Sequential Experimental Design”, we present an approach to group testing that can operate in a noisy setting (i.e., where tests can be mistaken) to decide adaptively by looking at past results which groups to test next, with the goal to converge on a reliable detection as quickly, and with as few tests, as possible. Large scale simulations suggest that this approach may result in significant improvements over both adaptive and non-adaptive baselines, and are far more efficient than individual tests when disease prevalence is low. As such, this approach is particularly well suited for situations that require large numbers of tests to be conducted with limited resources, as may be the case for pandemics, such as that corresponding to the spread of COVID-19. We have open-sourced the code to the community through our GitHub repo.

Noisy and Adaptive Group Testing in a Non-Asymptotic Regime
A group testing strategy is an algorithm that is tasked with guessing who, among a list of n people, carries a particular pathogen. To do so, the strategy provides instructions for pooling individuals into groups. Assuming a laboratory can execute k tests at a time, the strategy will form a kn pooling matrix that defines these groups. Once the tests are carried out, the results are used to decide whether sufficient information has been gathered to determine who is or is not infected, and if not, how to form new groups for another round of testing.

We designed a group testing approach for the realistic setting where the testing strategy can be adaptive and where tests are noisy — the probability that the test of an infected sample is positive (sensitivity) is less than 100%, as is the specificity, the probability that a non-infected sample returns negative.

Screening More People with Fewer Tests Using Bayesian Optimal Experimental Design
The strategy we propose proceeds the way a detective would investigate a case. They first form several hypotheses about who may or may not be infected, using evidence from all tests (if any) that have been carried out so far and prior information on the infection rate (a). Using these hypotheses, our detectives produce an actionable item to continue the investigation, namely a next wave of groups that may help in validating or invalidating as many hypotheses as possible (b), and then loop back to (a) until the set of plausible hypotheses is small enough to unambiguously identify the target of the search. More precisely,
  1. Given a population of n people, an infection state is a binary vector of length n that describes who is infected (marked with a 1), and who is not (marked with a 0). At a certain time, a population is in a given state (most likely a few 1’s and mostly 0’s). The goal of group testing is to identify that state using as few tests as possible. Given a prior belief on the infection rate (the disease is rare) and test results observed so far (if any), we expect that only a small share of those infection states will be plausible. Rather than evaluating the plausibility of all 2n possible states (an extremely large number even for small n), we resort to a more efficient method to sample plausible hypotheses using a sequential Monte Carlo (SMC) sampler. Although quite costly by common standards (a few minutes using a GPU in our experimental setup), we show in this work that SMC samplers remain tractable even for large n, opening new possibilities for group testing. In short, in return for a few minutes of computations, our detectives get an extensive list of thousands of relevant hypotheses that may explain tests observed so far.

  2. Equipped with a relevant list of hypotheses, our strategy proceeds, as detectives would, by selectively gathering additional evidence. If k tests can be carried out at the next iteration, our strategy will propose to test k new groups, which are computed using the framework of Bayesian optimal experimental design. Intuitively, if k=1 and one can only propose a single new group to test, there would be clear advantage in building that group such that its test outcome is as uncertain as possible, i.e., with a probability that it returns positive as close to 50% as possible, given the current set of hypotheses. Indeed, to progress in an investigation, it is best to maximize the surprise factor (or information gain) provided by new test results, as opposed to using them to confirm further what we already hold to be very likely. To generalize that idea to a set of k>1 new groups, we score this surprise factor by computing the mutual information of these “virtual” group tests vs. the distribution of hypotheses. We also consider a more involved approach that computes the expected area under the ROC curve (AUC) one would obtain from testing these new groups using the distribution of hypotheses. The maximization of these two criteria is carried out using a greedy approach, resulting in two group selectors, GMIMAX and GAUCMAX (greedy maximization of mutual information or AUC, respectively).
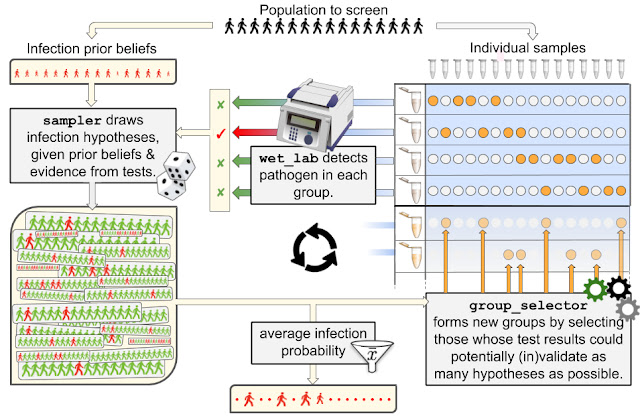
The interaction between a laboratory (wet_lab) carrying out testing, and our strategy, composed of a sampler and a group selector, is summarized in the following drawing, which uses names of classes implemented in our open source package.
Our group testing framework describes an interaction between a testing environment, the wet_lab, whose pooled test results are used by the sampler to draw thousands of plausible hypotheses on the infection status of all individuals. These hypotheses are then used by an optimization procedure, group_selector, that figures out what groups may be the most relevant to test in order to narrow down on the true infection status. Once formed, these new groups are then tested again, closing the loop. At any point in the procedure, the hypotheses formed by the sampler can be averaged to obtain the average probability of infection for each patient. From these probabilities, a decision on whether a patient is infected or not can be done by thresholding these probabilities at a certain confidence level.
Benchmarking
We benchmarked our two strategies GMIMAX and GAUCMAX against various baselines in a wide variety of settings (infection rates, test noise levels), reporting performance as the number of tests increases. In addition to simple Dorfman strategies, the baselines we considered included a mix of non-adaptive strategies (origami assays, random designs) complemented at later stages with the so-called informative Dorfman approach. Our approaches significantly outperform the others in all settings.
We executed 5000 simulations on a sample population of 70 individuals with an infection rate of 2%. We have assumed sensitivity/specificity values of 85% / 97% for tests with groups of maximal size 10, which are representative of current PCR machines. This figure demonstrates that our approach outperforms the other baselines with as few as 24 tests (up to 8 tests used in 3 cycles), including both adaptive and non-adaptive varieties, and performs significantly better than individual tests (plotted in the sensitivity/specificity plane as a hexagon, requiring 70 tests), highlighting the savings potential offered by group testing. See preprint for other setups.
Conclusion
Screening a population for a pathogen is a fundamental problem, one that we currently face during the current COVID-19 epidemic. Seventy years ago, Dorfman proposed a simple approach currently adopted by various institutions. Here, we have proposed a method to extend the basic group testing approach in several ways. Our first contribution is to adopt a probabilistic perspective, and form thousands of plausible hypotheses of infection distributions given test outcomes, rather than trust test results to be 100% reliable as Dorfman did. This perspective allows us to seamlessly incorporate additional prior knowledge on infection, such as when we suspect some individuals to be more likely than others to carry the pathogen, based for instance on contact tracing data or answers to a questionnaire. This provides our algorithms, which can be compared to detectives investigating a case, the advantage of knowing what are the most likely infection hypotheses that agree with prior beliefs and tests carried out so far. Our second contribution is to propose algorithms that can take advantage of these hypotheses to form new groups, and therefore direct the gathering of new evidence, to narrow down as quickly as possible to the "true" infection hypothesis, and close the case with as little testing effort as possible.

Acknowledgements
We would like to thank our collaborators on this work, Olivier Teboul, in particular, for his help preparing figures, as well as Arnaud Doucet and Quentin Berthet. We also thank Kevin Murphy and Olivier Bousquet (Google) for their suggestions at the earliest stages of this project, as well as Dan Popovici for his unwavering support pushing this forward; Ignacio Anegon, Jeremie Poschmann and Laurent Tesson (INSERM) for providing us background information on RT-PCR tests and Nicolas Chopin (CREST) for giving guidance on his work to define SMCs for binary spaces.

Source: Google AI Blog


Unlocking the "Chemome" with DNA-Encoded Chemistry and Machine Learning


Much of the development of therapeutics for human disease is built around understanding and modulating the function of proteins, which are the main workhorses of many biological activities. Small molecule drugs such as ibuprofen often work by inhibiting or promoting the function of proteins or their interactions with other biomolecules. Developing useful “virtual screening” methods where potential small molecules can be evaluated computationally rather than in a lab, has long been an area of research. However, the persistent challenge is to build a method that works well enough across a wide range of chemical space to be useful for finding small molecules with physically verified useful interaction with a protein of interest, i.e., “hits”.

In “Machine learning on DNA-encoded libraries: A new paradigm for hit-finding”, recently published in the Journal of Medicinal Chemistry, we worked in collaboration with X-Chem Pharmaceuticals to demonstrate an effective new method for finding biologically active molecules using a combination of physical screening with DNA-encoded small molecule libraries and virtual screening using a graph convolutional neural network (GCNN). This research has led to the creation of the Chemome initiative, a cooperative project between our Accelerated Science team and ZebiAI that will enable the discovery of many more small molecule chemical probes for biological research.

Background on Chemical Probes
Making sense of the biological networks that support life and produce disease is an immensely complex task. One approach to study these processes is using chemical probes, small molecules that aren’t necessarily useful as drugs, but that selectively inhibit or promote the function of specific proteins. When you have a biological system to study (such as cancer cells growing in a dish), you can add the chemical probe at a specific time and observe how the biological system responds differently when the targeted protein has increased or decreased activity. But, despite how useful chemical probes are for this kind of basic biomedical research, only 4% of human proteins have a known chemical probe available.

The process of finding chemical probes begins similarly to the earliest stages of small molecule drug discovery. Given a protein target of interest, the space of small molecules is scanned to find “hit” molecules that can be further tested. Robotic assisted high throughput screening where up to hundred of thousands or millions of molecules are physically tested is a cornerstone of modern drug research. However, the number of small molecules you can easily purchase (1.2x10⁹) is much larger than that, which in turn is much smaller than the number of small drug like molecules (estimates from 1020 to 1060). “Virtual screening” could possibly quickly and efficiently search this vast space of potentially synthesizable molecules and greatly speed up the discovery of therapeutic compounds.

DNA-Encoded Small Molecule Library Screening
The physical part of the screening process uses DNA-encoded small molecule libraries (DELs), which contain many distinct small molecules in one pool, each of which is attached to a fragment of DNA serving as a unique barcode for that molecule. While this basic technique has been around for several decades, the quality of the library and screening process is key to producing meaningful results.

DELs are a very clever idea to solve a biochemical challenge, which is how to collect small molecules into one place with an easy way to identify each. The key is to use DNA as a barcode to identify each molecule, similar to Nobel Prize winning phage display technology. First, one generates many chemical fragments, each with a unique DNA barcode attached, along with a common chemical handle (the NH2 in this case). The results are then pooled and split into separate reactions where a set of distinct chemical fragments with another common chemical handle (e.g., OH) are added. The chemical fragments from the two steps react and fuse together at the common chemical handles. The DNA fragments are also connected to build one continuous barcode for each molecule. The net result is that by performing 2N operations, one gets N2 unique molecules, each of which is identified by its own unique DNA barcode. By using more fragments or more cycles, it’s relatively easy to make libraries with millions or even billions of distinct molecules.
An overview of the process of creating a DNA encoded small molecule library. First, DNA “barcodes” (represented here with numbered helices) are attached to small chemical fragments (the blue shapes) which expose a common chemical “handle” (e.g. the NH2 shown here). When mixed with other chemical fragments (the orange shapes) each of which has another exposed chemical “handle” (the OH) with attached DNA fragments, reactions merge the sets of chemical and DNA fragments, resulting in a voluminous library of small molecules of interest, each with a unique DNA “barcode”.
Once the library has been generated, it can be used to find the small molecules that bind to the protein of interest by mixing the DEL together with the protein and washing away the small molecules that do not attach. Sequencing the remaining DNA barcodes produces millions of individual reads of DNA fragments, which can then be carefully processed to estimate which of the billions of molecules in the original DEL interact with the protein.

Machine Learning on DEL Data
Given the physical screening data returned for a particular protein, we build an ML model to predict whether an arbitrarily chosen small molecule will bind to that protein. The physical screening with the DEL provides positive and negative examples for an ML classifier. To simplify slightly, the small molecules that remain at the end of the screening process are positive examples and everything else are negative examples. We use a graph convolutional neural network, which is a type of neural network specially designed for small graph-like inputs, such as the small molecules in which we are interested.

Results
We physically screened three diverse proteins using DEL libraries: sEH (a hydrolase), ERα (a nuclear receptor), and c-KIT (a kinase). Using the DEL-trained models, we virtually screened large make-on-demand libraries from Mcule and an internal molecule library at X-Chem to identify a diverse set of molecules predicted to show affinity with each target. We compared the results of the GCNN models to a random forest (RF) model, a common method for virtual screening that uses standard chemical fingerprints, which we use as baseline. We find that the GCNN model significantly outperforms the RF model in discovering more potent candidates.
Fraction of molecules (“hit rates”) from those tested showing various levels of activity, comparing predictions from two different machine learned models (a GCNN and random forests, RF) on three distinct protein targets. The color scale on the right uses a common metric IC50 for representing the potency of a molecule. nM means “nanomolar” and µM means “micromolar”. Smaller values / darker colors are generally better molecules. Note that typical virtual screening approaches not built with DEL data normally only reach a few percent on this scale.
Importantly, unlike many other uses of virtual screening, the process to select the molecules to test was automated or easily automatable given the results of the model, and we did not rely on review and selection of the most promising molecules by a trained chemist. In addition, we tested almost 2000 molecules across the three targets, the largest published prospective study of virtual screening of which we are aware. While providing high confidence on the hit rates above, this also allows one to carefully examine the diversity of hits and the usefulness of the model for molecules near and far from the training set.

The Chemome Initiative
ZebiAI Therapeutics was founded based on the results of this research and has partnered with our team and X-Chem Pharmaceuticals to apply these techniques to efficiently deliver new chemical probes to the research community for human proteins of interest, an effort called the Chemome Initiative.

As part of the Chemome Initiative, ZebiAI will work with researchers to identify proteins of interest and source screening data, which our team will use to build machine learning models and make predictions on commercially available libraries of small molecules. ZebiAI will provide the predicted molecules to researchers for activity testing and will collaborate with researchers to advance some programs through discovery. Participation in the program requires that the validated hits be published within a reasonable time frame so that the whole community can benefit. While more validation must be done to make the hit molecules useful as chemical probes, especially for specifically targeting the protein of interest and the ability to function correctly in common assays, having potent hits is a big step forward in the process.

We’re excited to be a part of the Chemome Initiative enabled by the effective ML techniques described here and look forward to its discovery of many new chemical probes. We expect the Chemome will spur significant new biological discoveries and ultimately accelerate new therapeutic discovery for the world.

Acknowledgements
This work represents a multi-year effort between the Accelerated Science Team and X-Chem Pharmaceuticals with many people involved. This project would not have worked without the combined diverse skills of biologists, chemists, and ML researchers. We should especially acknowledge Eric Sigel (of X-Chem, now at ZebiAI) and Kevin McCloskey (of Google), the first authors on the paper and Steve Kearnes (of Google) for core modelling ideas and technical work.

Source: Google AI Blog


Learn more about anxiety with a self-assessment on Search

Editor’s note: This post is authored by Daniel H. Gillison, Jr., CEO of The National Alliance on Mental Illness.

Anxiety disorders affect 48 million adults in the U.S. Anxiety presents itself as a wide range of symptoms, and can be a result of biological factors or triggered by a change in environment or exposure to a stressful event. With COVID-19 introducing new points of stress, communities are seeing a rise in mental health issues and needs. New Census Bureau data released last week shows that a third of Americans are now showing signs of clinical anxiety or depression.

The National Alliance on Mental Illness (NAMI) is the nation’s largest grassroots mental health organization and we’re partnering with Google to provide access to mental health resources. Starting today when people in the U.S. search on Google for information about anxiety, we’ll provide access to a clinically-validated questionnaire called the GAD-7 (Generalized Anxiety Disorder-7). The GAD-7 will show up in the knowledge panel—the box of information that displays key facts when you search for something—and also has medically-validated information about anxiety, including symptoms and common treatments.

Anxiety self-assessment

This seven-question survey covers many of the same questions a health professional may ask, and your answers are private and secure (Google does not collect or share answers or results from the questionnaire). The GAD-7 helps people understand how their self-reported anxiety symptoms map to anxiety levels of people who completed the same questionnaire. The tool also provides access to resources developed by NAMI so people can learn more and seek help when needed. 

Anxiety self-assessment results

The GAD-7 is the third mental health screener available on Google Search. We’ve previously partnered with Google so that people who search for information on depression and PTSD can access relevant clinically-validated questionnaires that provide more information and links to resources about those conditions. The self-assessments are currently available in the U.S., and Google hopes to make them available in additional countries over time.

Anxiety can show up as a wide range of physical and emotional symptoms, and it can take decades for people who first experience symptoms to get treatment. By providing access to authoritative information, and the resources and tools to learn more about anxiety, we hope to empower more people to take action and seek help.

Source: Search


Exposure Notification API launches to support public health agencies

Note: The following is a joint statement from Apple and Google.

One of the most effective techniques that public health officials have used during outbreaks is called contact tracing. Through this approach, public health officials contact, test, treat and advise people who may have been exposed to an affected person. One new element of contact tracing is Exposure Notifications: using privacy-preserving digital technology to tell someone they may have been exposed to the virus. Exposure Notification has the specific goal of rapid notification, which is especially important to slowing the spread of the disease with a virus that can be spread asymptomatically.   

To help, Apple and Google cooperated to build Exposure Notifications technology that will enable apps created by public health agencies to work more accurately, reliably and effectively across both Android phones and iPhones. Over the last several weeks, our two companies have worked together, reaching out to public health officials, scientists, privacy groups and government leaders all over the world to get their input and guidance. 

Starting today, our Exposure Notifications technology is available to public health agencies on both iOS and Android. What we’ve built is not an app—rather public health agencies will incorporate the API into their own apps that people install. Our technology is designed to make these apps work better. Each user gets to decide whether or not to opt-in to Exposure Notifications; the system does not collect or use location from the device; and if a person is diagnosed with COVID-19, it is up to them whether or not to report that in the public health app. User adoption is key to success and we believe that these strong privacy protections are also the best way to encourage use of these apps.  

Today, this technology is in the hands of public health agencies across the world who will take the lead and we will continue to support their efforts. 

Source: Android


Exposure Notification API launches to support public health agencies

Note: The following is a joint statement from Apple and Google.

One of the most effective techniques that public health officials have used during outbreaks is called contact tracing. Through this approach, public health officials contact, test, treat and advise people who may have been exposed to an affected person. One new element of contact tracing is Exposure Notifications: using privacy-preserving digital technology to tell someone they may have been exposed to the virus. Exposure Notification has the specific goal of rapid notification, which is especially important to slowing the spread of the disease with a virus that can be spread asymptomatically.   

To help, Apple and Google cooperated to build Exposure Notifications technology that will enable apps created by public health agencies to work more accurately, reliably and effectively across both Android phones and iPhones. Over the last several weeks, our two companies have worked together, reaching out to public health officials, scientists, privacy groups and government leaders all over the world to get their input and guidance. 

Starting today, our Exposure Notifications technology is available to public health agencies on both iOS and Android. What we’ve built is not an app—rather public health agencies will incorporate the API into their own apps that people install. Our technology is designed to make these apps work better. Each user gets to decide whether or not to opt-in to Exposure Notifications; the system does not collect or use location from the device; and if a person is diagnosed with COVID-19, it is up to them whether or not to report that in the public health app. User adoption is key to success and we believe that these strong privacy protections are also the best way to encourage use of these apps.  

Today, this technology is in the hands of public health agencies across the world who will take the lead and we will continue to support their efforts.