Tag Archives: Data Studio

Which TV Ads Made the Podium During the 2016 Olympics Opening Ceremonies?

When the 2016 Olympics kicked off last Friday, many TV advertisers were crossing their fingers that their strategy would pay off. Reaching an estimated 26.5 million total viewers in the U.S., they were hoping their ads delivered relevant and compelling creative to the right audiences. To answer the pay-off question, advertisers will predominately look at three specific areas of performance:

  1. Which ads were noticed by the audience?
  2. Which ads drove interest, shifted perception, and increased intent?
  3. And, which ads drove actual consumer response?

To get some insights into these questions, Google evaluated the top 10 brands (based on total ad minutes) that aired ads during the live broadcast of the opening ceremonies. The analysis is based on a combination of consumer surveys and second-screen (mobile, desktop, and tablet) response data. Presented in a live Google Data Studio dashboard, the result is a unique view into the full-funnel performance of the ads evaluated.

Awareness

Commercials during large, live sporting events like the Olympics are often uniquely created to leverage both the scale of the audience and the context of the event. Whether it is telling the personal story of an athlete or playing to our passions like patriotism, they are intended to strike an emotional connection, entertain us, or make us stand up and take notice.

Coca Cola was the big winner with almost 35% of respondents having remembered seeing the ad when prompted—a result that outpaces typical recall rates in the 20%-25% range. Not a surprising result from a top CPG brand. Samsung, Chevy, United, and Visa rounded out the top five with respectable recall rates.
TV Ad Awareness Metrics
35% of respondents remembered seeing the Coca Cola ad.
Additionally, of those respondents recalling the ad, only 40% could recall the specific product or service featured in the ad. The net is that only about 8% of viewers can recall both the brand and product in a specific advertisement. For many of the ads this was the first airing and it is reasonable to expect these numbers to improve substantially with increased exposure over the next couple of weeks.

Interest

Advertisers also want the ad to shift perceptions and create interest in the product or service featured. By surveying both viewers who saw the ad (exposed) and those who did not (unexposed), we are able to get insights into the impact of each ad’s messaging and creative. Overall, the results were impressive. On average, respondents who saw the ads were 18% more positive about the associated brands than those who did not. Likewise, respondents who saw the ads were 16% more likely to find out more and/or purchase the product being advertised.
TV Ad Interest Metrics
Consumers who saw the ads were 18% more positive about the brand and were 16% more likely to find out more or purchase the product in the ad.
Interestingly, the baseline favorability and purchase intentions for both non-sponsors and Olympic sponsors are relatively equal. And for the most part, the ad’s impact on both factors was the same across non-sponsors and sponsors.

Desire

These commercials don’t just make us laugh or make us feel better about the brand—they also make us search and visit websites. Second-screen searching—whether it’s to re-engage with the ad or to learn more about the product—is a powerful indication of desire. By measuring incremental search queries on Google and YouTube during the broadcast that are specific and modeled to be attributable to ads shown, we are now able to include responses in our analysis. During the opening ceremonies, TV ad driven searches were almost exclusively on mobile—94% compared to an average of 56% for those brands when the ads were not airing. For brands, that means a presence on the TV screen isn’t complete without a strategy for small screens, as well.
"94% of searches on Google and YouTube as a result of seeing the ads occurred on mobile devices."
McDonald’s took the top spot on the podium with 42% more searches than the average. BMW and Samsung fought it out for second and third with 14% and 12% respectively. The answer to the question “Do emotional and inspiring ads work?” is, in this instance, “Yes.” But so do product-featured ads. Both inspiring and product ad creatives drove 10% more searches on average. Also, ads by sponsors drove 14% more searches than their non-sponsor counterparts.
TV Ad Response Metrics
Compared to the average of the top 10 ads studied, McDonald’s drove 42% more searches.
Finally, the Samsung Galaxy Note 7 ad was the overall winner with strong full-funnel performance placing in the top three across all three funnel stages. Whether people are tuning into the Olympics or their favorite TV show, they use their smartphones to search for information triggered by what they’re seeing. That means if you advertise on TV, you can now get a new view of performance across each stage of the funnel—using a combination of consumer surveys and digital response, all in a matter of days. Armed with these new insights, advertisers are now able to better understand and improve the performance of these investments in concert with their digital media.

Sourcing

Using Google Consumer Surveys to provide consumer ad awareness and interest research, an online survey was conducted in the United States during the period 8/6 - 8/9/16 using a validated, representative sample with a minimum of 750 respondents. Response data is based on incremental TV ad-driven search queries (Google and YouTube) during the course of the broadcast that are specific to the ad shown and are modeled by Google Attribution 360 to be attributable to the airings of the commercials. Response data is normalized for total commercial air time during the broadcast for each advertiser and indexed to the average.

Happy Analyzing,

Behind the Scenes with Google Data Studio

This Spring, as part of our Google Analytics 360 suite, we introduced Google Data Studio 360, to help you simply and beautifully present data from multiple data sources, including Google Analytics, Google Sheets and much more.

In May, we introduced Google Data Studio, a free version of our tool, to put it in the hands of many more of you - which has led to the design and sharing of creative reports that bring your information to life. We’ve been excited to see the rapid adoption, and initiated a series of livestreams to answer questions around our design of the product, deliver demos and highlight features.

The first recording in this series, hosted by Product Manager Nick Mihailovski and Louis Gray, is now available, and shares:
  • An introduction to Google Data Studio 
  • The perspective of our product manager on Data Visualization 
  • Walkthroughs and sample reports 
Watch the first video in this series via the embed below or on YouTube here.


Posted by Louis Gray, Google Analytics Team

Data Studio: New, Simplified, AdWords Connector

Google Data Studio is our new Business Intelligence product that makes it easy to connect, visualize, and share data. Today we updated the Google Data Studio AdWords connector to be more flexible and easier to use.

The AdWords connector allows AdWords customers to access their AdWords account data in Data Studio, build visually stunning reports, and share those reports to business stakeholders across their organization.


Report built with the AdWords connector in Google Data Studio 

With our recent update, the new AdWords connector now unifies over 100 AdWords dimensions and metrics as a single list, making it easier select the data you want to visualize.


20 of over 100 dimensions and metrics available in the new connector 

The new connector also supports many more combinations of dimensions and metrics, dramatically simplifying building reports.


Customizing a table with AdWords data in the Report Editor 

Of course, when you build AdWords reports with Data Studio, all the existing Data Studio features are compatible with this data including: calculated metrics, derived fields, custom visualizations, rich styling and custom branding, simplified sharing through Google Drive and realtime collaboration. 

These new changes are available today in both Data Studio 360 and Data Studio versions. To use the new connector, you must create a new Data Studio Data Source. Data Source using the previous connector will continue to work. Please read our help documentation on how to migrate to the new version

We’re excited to see all of the new reports customers will create with this enhancement.

Posted by Nick Mihailovski, Google Data Studio team

Let us know your thoughts on Google Data Studio

Are you a current or past users of Google Data Studio? We would love to hear your thoughts about your experience so far with Google Data Studio.

The survey should take around 10 minutes to complete. Your comments will help us build a better product!

Note: Your answers will be held in strict confidentiality. The results will be reported in aggregate form only, and cannot be identified individually. Thank you!

Posted by the Google Data Studio Team

Get Facebook, Bing, Twitter & more into Google Data Studio

Google Data Studio is the biggest step forward in Google’s data reporting & visualization offering since the launch of Google Analytics in 2005. It lets you build great-looking, interactive dashboards that you can share in a similar manner as Google Drive files (see for example this web analytics dashboard). It's a giant leap forward from the old Google Analytics dashboards and a game changer for online marketers.

Google Data Studio provides native integration with a few Google platforms (Google Analytics, AdWords, YouTube, BigQuery, Attribution 360). Of course, most marketers, to use Google Data Studio as their primary dashboarding tool, would like to include data from many more sources, such as Facebook Ads, Bing Ads and Twitter Ads.

Fortunately, there’s a really simple method for adding many more data sources into Google Data Studio, using its Google Sheets connector. Here’s a quick step-by-step guide for doing that.

1. Create a Google Sheet with data to be imported 
There are a number of ways to do this. For instance, to get Facebook Ads data, you can go to Facebook Ads Manager to do a CSV export of your data, and then upload it to Google Drive. For some data sources, you can use spreadsheet functions like IMPORTXML. Or you can build your own Google Apps Script connectors.

For a fully automated data importing workflow, I recommend you try our Supermetrics add-on for Google Sheets (available here; free for 30 days, then $49/mo). It has an easy-to-use query builder and connects to a large number of data sources, like Facebook, Bing, Twitter, MailChimp, even Adobe SiteCatalyst.

To run a simple query using Supermetrics:

  1. Launch Supermetrics from the Add-ons menu 
  2. Log in to a data source (eg. Facebook Ads) 
  3. Pick a few metrics (eg. impressions and cost) 
  4. Split to rows by one or more dimensions (eg. country) 
  5. Click the blue Get Data to Table button 
After you’ve fetched the data, your Google Sheet should look something like this (here we’re splitting by country):


If you don’t want to test Supermetrics now, you can make a copy of this sheet to try out the following steps.

2. Import the data into Google Data Studio
You can launch Google Data Studio here. If you haven’t yet used Data Studio, you can get the free version here (US only for the time being). 

In DATA SOURCES, click the plus button in the lower-right corner:

From connectors, select Google Sheets and the file you just created, then click CONNECT


Next, Google shows you a list of fields imported from the Google Sheet. Click CREATE REPORT, and in the next window, ADD TO REPORT.

3. Using the data 
You now have a blank report where you can start working with the data. To check everything has been imported ok, try inserting a table. You can change the columns displayed in the Table Properties sidebar.


You can then start building your report. After some trying, you’ll be able to make something great like this:


In many cases, you will want to include more than one Google Sheets data connector, to fetch data from different sources or with different metrics & dimensions. This can be done very easily, just repeat step 1 and 2. Go back to Google Sheets to fetch new data, e.g. Twitter Ads, to another sheet. Then in Data Studio, when adding a graph or table, in the properties sidebar press the arrow next to Data Source to add a connection to the new sheet.

4. Ensure your reports stay up-to-date
If you used the Supermetrics add-on to fetch data into Google Sheets, you can set the those queries to refresh automatically every day, so your Data Studio report will always have the latest data. In Google Sheets, go to Add-ons: Supermetrics: Schedule refresh & emailing, and store a daily refresh trigger.

Final thoughts 
Google Data Studio is a powerful dashboarding tool for any marketer, but by default only works with Google platforms. To make the most of it, use its Google Sheets connector in combination with the Supermetrics Google Sheets add-on to build cross-channel reports.

Posted by Mikael Thuneberg, Google Analytics Certified Partner

Announcing Data Studio: our free, new, Data Visualization Product

Earlier this year, as part of the Google Analytics 360 Suite announcement, we unveiled a new data visualization and reporting platform for large enterprises — Data Studio 360.

Yesterday, at the Google Performance Summit, we announced a free version of Data Studio for individuals and smaller teams. Data Studio lets you connect to all your marketing data and turn that data into beautiful, informative reports that are easy to understand, share, and fully customizable. We wanted to take a moment to give you some of the details about Data Studio.

Making it easy to share data within your organization — or with the world

One of the fundamental ideas behind Data Studio is that data should be easily accessible to anyone in an organization. We believe that as more people have access to data, better decisions will be made.

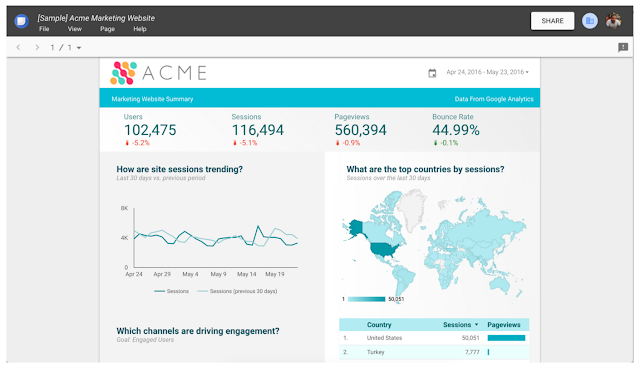
With multiple data connectors, you can now easily create dashboards from many different types of data and share with everyone in your organization - and you can mix and match data sources within a single report. For example, you can combine Google Analytics data and Google AdWords data into a single report.


Today, we’re offering multiple data connectors, so you can connect to Google Analytics, Google AdWords, Google Sheets and many other Google services. But Data Studio offers integration with a wide variety of data sources. There’s also a connector for BigQuery and we will soon have connectors to SQL databases that will let you access first party data.

Data Studio is more that just sharing reports with other people — it’s true collaboration. We used the same infrastructure as Google Docs, so you can edit reports together, in real time. This is useful as you combine data from multiple teams and need others to add analysis and context to the report.

Visualization tools to style your reports and data 

In addition to new sharing and collaboration tools, Data Studio gives you many flexible ways to present your data. Sure, there’s the usual assortment of bar charts, pie charts, and time series. But we’ve also included some new visualizations — like bullet charts that help you communicate your progress towards a business goal.


Another advanced feature is the ability to create a heatmap using tabular data. This visualization makes it easy to instantly identify outliers within a table of data.


Data Studio also has an array of other features to help you customize how you present your data. There are a number stylistic tools that enable you to design your reports to represent your specific brand. There are also interactive data controls, like a date picker and dynamic filters, that enable report editors to make reports interactive for viewers.

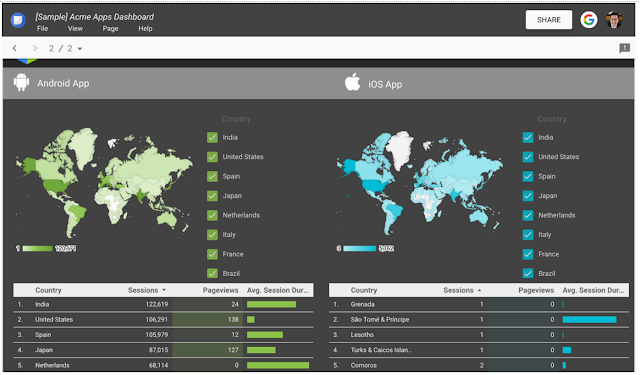
For example, let’s say you want to let users segment a report by country. Just add a control element to the top of your report and the user can dynamically segment the data. In the image below the check boxes will change the data in the map and data table based on what a user selects.


These are just a few of the tools that you can use to help others in your organization understand data. 

Two versions for different types of organizations

 The primary difference between Data Studio 360 and the free version, Data Studio, is the the number of reports you can create, which is five per account. Both versions support connecting to unlimited data sources and offer unlimited report viewing, editing and collaboration. For more information, check out our Help Center.

Getting started

If you’re ready to get started, watch this brief overview that will help you build your first reports.


Then check out the interactive walkthrough - it’s built with Data Studio. Just choose “Welcome to Data Studio (Start Here)” from the list of reports in your account.

 Data Studio is currently available to users in the United States and we’ll be rolling it out to other geographic regions throughout the year. We hope it helps you share more data and make better business decisions.

Happy Dashboarding,

Posted by Nick Mihailovski & Nathan Moon, Data Studio team

Announcing: Smarter, more sharable analytics innovations


We’re incredibly excited to share with you the new analytics product innovations announced just moments ago at the Google Performance Summit. These innovations for the Analytics 360 Suite are more integrated, more collaborative, and use built-in intelligence to handle more data than ever in our new multi-screen, cross-channel world.

Why are these innovations arriving now? Because across the millions of websites using Google Analytics today, more than half of all web traffic now comes from smartphones and tablets1. And every year, over half of the trillions of searches on Google happen on mobile2.

This shift to mobile has made marketers' jobs more complex. We all have more opportunities than ever to reach consumers all day and measure their behavior in their I-want-to-know, I-want-to-go, I-want-to-do and I want-to-buy moments. But it's also harder to keep all the channels and touchpoints straight. You can’t market effectively in today’s world with products that were designed for a desktop-first world.

Two months ago we announced the Google Analytics 360 Suite, an enterprise-class modern measurement solution built from the ground up to help enterprise marketers and analytics professionals succeed in this new multi-screen world.

Today, we announced new innovations focused on three themes: 


Read on to learn the analytics highlights from today’s announcements.

Enterprise analytics re-imagined for modern marketing 

Google Analytics 360 Suite is beginning to roll out to current customers. This includes Google Analytics 360 (formerly known as Premium), Attribution 360 (formerly known as Adometry), Audience Center 360, and Tag Manager 360 when used as part of Analytics 360. The rollout will occur in phases over the next several months, and users will see an improved and unified product experience and a new look and feel across all Analytics 360 Suite products.

Google Optimize 360, our website testing and personalization product, is now available in paid BETA globally. The results from our closed beta have been amazing: one of our beta customers reduced the time to deploy a site experiment from three days to 10 minutes. Optimize 360’s deep integrations with Analytics 360 increase testing agility and reduce setup times. With just a few clicks, you can use the audiences and goals you’ve already created in Analytics 360 to run experiments with Optimize 360.

Google Data Studio 360, our data visualization product, will start rolling out in paid BETA in the US. This is our enterprise version with licensing starting at 200 users. Data Studio 360 allows you to connect to all your data with native integrations across many popular Google products, as well as non-Google data. Visualize your data by creating reports and dashboards. Share your data across your organization with built-in, real-time collaboration.

Google Data Studio is a completely new, free version of Data Studio 360 that we’re launching today! Starting now, anyone can use Data Studio to create up to 5 reports with unlimited sharing, editing and collaboration. We’re starting the BETA in the U.S. and rolling out to other regions throughout the year.

Succeeding together 

With massive volumes of data being created across screens, channels and touchpoints, built-in intelligence has become foundational in approach to analytics product development. This means we’re doing more of the heavy lifting for you, and we’re seeing a tremendous response from businesses. For example, Smart Goals in Analytics is now enabling more than 60K advertisers to optimize their AdWords performance. You’ll continue to see exciting developments in the future related to intelligence.

As consumers blur the lines between online and offline, it’s more important than ever to build your business in new ways. Google is excited to go on this journey with you, and we're building much more for the multi-screen, cross-channel world. Visit our website to learn more about all the new products in the Analytics 360 Suite.

To see the full range of ads and analytics innovations announced this morning, watch the Google Performance Summit keynote here.


1 Google Analytics 2016 
2 Google 2016