Tag Archives: Learning Resources

New Analytics Academy course: Getting Started With Google Analytics 360

Today, we are introducing a new course in Analytics Academy: Getting Started With Google Analytics 360.


Krista Seiden and Ashish Vij Introduce Getting Started With Google Analytics 360 (Video)


In this course, you will join instructors Ashish Vij and Krista Seiden as you learn key Google Analytics 360 features such as Roll-Up Reporting, Custom Funnels, Unsampled Reports, and Custom Tables. You'll gain insight into how you can benefit from reporting with BigQuery and native integrations with DoubleClick products, and we will provide you with real-world examples to illustrate how you can leverage Analytics 360’s features and integrations to drive performance and achieve your business goals.

By participating in the course, you’ll learn how to:
  • Set up Roll-Up Reporting
  • Analyze customer journeys with Custom Funnels
  • Leverage Unsampled Reports and Custom Tables
  • Analyze big data with BigQuery Export
  • Evaluate marketing performance with DoubleClick reporting integrations
Sign up for Getting Started With Google Analytics 360 now and start learning today.

Happy analyzing!

Helen Huang & The Google Analytics Education Team

Lessons from leaders: A data-driven approach helps deliver engaging, relevant messages


As marketers, we know how important it is to understand our customers and reach them at just the right moment. We also know that consumers have more control of their digital environments than ever — and that they expect us to consistently make recommendations in line with their interests, personalities, and behaviors.1 So how can we regularly communicate in a relevant way with all of our customers?

According to our new report on MIT Sloan Management Review, success starts with a strategy that’s backed by data. In the report, The Data-Driven Transformation, we speak with marketing leaders from Bayer, Tapestry Inc. (the parent brand for Coach, kate spade new york, and Stuart Weitzman), and Sprint. They open up with first-hand insights about transforming their teams to be more efficient, accurate, and agile. Here’s a few key insights from the research — and some words of wisdom from these top analytics pros.

Move toward a unified technology stack — and educate as you go

A recent study by the Association of National Advertisers showed that top marketing performers are the same companies that spend the most money on marketing technology.2 In many ways, their investments are paying off, but for those still using separate solutions for separate channels, there’s greater potential. Unifying their tech under a single, shared system could bring fuller, more tailored consumer insights — not to mention an easier way to evaluate what’s working and what’s not.

Jeff Rasp, director of digital strategy for Bayer’s Consumer Health division, did just that, helping reimagine his team’s approach to data. He oversaw the creation of a new marketing insights platform to consolidate data under a single customer ID, and also helped build the company’s first attribution model to evaluate their success.

Assemble teams with the analytics skills to uncover actionable insights

To deliver the right messages at the right times, marketing organizations need data scientists, mobile developers, and other data professionals. For Rob Roy, chief digital officer at Sprint, that meant building a new in-house analytics team to take operations over from external partners.

“We needed to get the right people who know how to build the architecture to house all the data,” Roy explains.

Once he found them, Sprint worked to integrate data across channels — from web and social media to retail and display — allowing the team more advanced customer segmentation capabilities.

Encourage collaboration across teams

A recent McKinsey study showed that 51% of top-performing marketers were part of a networked organization — one where cross-functional teams come together as needed. Parinaz Vahabzadeh, VP of global data labs at Tapestry, is one leader who’s made sure her team collaborates as a single unit.

“Our mandate is to democratize the data,” explains Vahabzadeh. “As a small, centralized team, we need to find ways to focus on the most impactful projects and also enable the broader teams to run analytics independently.”

Find out more

Want the full stories behind how these three brands are reimagining what they can do with data to reach their customers in relevant ways? Download the full report to learn more.

1-2 MIT SMR Custom Studio/Google, “The Data Driven Transformation,” January 2018

How to Turn Your Team’s Data Curiosity into Results


As a data expert, you know that most great ideas don’t strike like a bolt of lightning. They start with something slower: simple curiosity. They grow from “what if” to the seeds of an idea and, if you’re lucky, into some big next steps.

Many people on your team might also have these “what if” ideas too. For example, maybe they’ve got an insight about how to optimize your marketing plans and drive better results. But they might need a little nudge to turn those ideas into something bigger. For your organization to consistently get from insight to action, it’s important to give people at all levels the skills and training they need to explore their hunches using data. After all, you never know where your company’s next great idea might come from.

Here are three ways you can spread your data expertise to others, helping people beyond just a small team of go-to analytics experts.

1. Make training a priority

By analyzing the data that drives your business, anyone on your team can uncover how, when, and where consumers interact with your brand. That helps spread a deeper understanding of the customer journey throughout your organization. But to get there, you’ll need support to make data and analytics a priority — from the top down. In a recent study conducted by Google and Econsultancy, nearly two-thirds of leading organizations said that their executives treat data-driven insights as more valuable than gut instinct.1

One way to have an impact? Help executives create a training plan by determining what your team needs to know in order to analyze the data they’ve collected. By identifying the gaps between what they already know and what they still need to learn, you’ll have the insights you need to provide your team with the right level of training. Once you run a training session, record it and keep it online for later use, and share it with anyone who couldn’t make the meeting.

2. Share your success

If you’re a go-to data expert on your team, sharing your success is one of the most powerful tools you have to spread data literacy. Look for time to recap the results of a recent A/B test and show your team members how you achieved results. That will get them excited about what they can do with data. Also, don’t be shy — at every opportunity, recognize and reward others you see using data effectively. This helps build enthusiasm. Finally, use your knowledge and demonstrate proven business results to communicate what data can do.

As an analyst, you may even want to start thinking of your role in a new light. Analysts don’t just pull reports — they weave data narratives and interpret how data influences business results. That brings data to life and shows its value to the whole team. By sharing openly, you’ll give colleagues the tools they need to answer burning questions or dig deeper into their own hypotheses.

Looking for more ways to turn everyone one your team into a data-savvy marketer? We put together an infographic with 5 key steps to help get you there.

3. Work together across teams

While it might be tempting to use your data powers to make your own team shine, data is actually better when it’s used across teams. In fact, marketing leaders are 1.6X as likely as their mainstream counterparts to strongly agree that open access to data leads to higher business performance.2

You can take it one step further. Use your expertise to create and share easy-to-understand data reports outside your team. It’s a great way to help beginners make sense of recommendations and insights, and to get an idea for productive ways to use them.

When sharing your data, make sure it’s organized and easy for all teams to access and understand. Include clear definitions and common metrics so that everyone is on the same page. To go above and beyond, tailor insights specifically for different teams. That way they can get a deeper understanding of the report’s value. And don’t forget to consider the ways in which you deliver the data — every team has its own preferred channels for communicating.

Finally, don’t stop reaching out once you’ve worked to break down data silos in your company. It takes continued, active steps to keep data flowing across an organization.

With training in data analytics, every member of your team can support big ideas with real data. That helps ensure those ideas are taken seriously. And, in turn, it encourages your team to continue bringing new, diverse points of view to the table.

For more tips on sharing data expertise across your company, check out our Data-Driven Marketer's Strategic Playbook.

1-2 Econsultancy/Google, "The Customer Experience is Written in Data", May 2017, U.S. (n=677 marketing and measurement executives at companies with over $250M in revenues, primarily in North America; n=199 leading marketers who reported marketing significantly exceeded top business goal in 2016, n=478 mainstream marketers (remainder of the sample), May 2017

Two New Analytics Academy Courses and Year-Round Certification

For three years, many have participated in our free online courses on Analytics Academy, which aim to help you become an analytics expert and learn best practices on how to make your data actionable. In 2013, we started with a single course focused on Digital Analytics Fundamentals, and have since grown our offerings to include Google Tag Manager, Ecommerce and more.

Today, we are introducing two new courses for Analytics Academy: Google Analytics for Beginners and Advanced Google Analytics.


In Google Analytics for Beginners, you will join instructors Justin Cutroni and Krista Seiden to learn the basics of Google Analytics, including how to create an account, implement the code, and set up filters. You'll also learn how to navigate the interface, analyze reports, set up goals, track campaigns, and create dashboards.

Our Advanced Google Analytics course goes in depth on how data gets collected and processed. You’ll learn how to use configurations like Custom Dimensions, Custom Metrics, and Event Tracking. The course also demonstrates advanced techniques, including segmentation, channel reports, audience reports, custom reports, and marketing strategies like remarketing.

Both of these courses include interactive demos and activities to apply what you have learned, using our free Google Analytics Demo Account.

In addition to this pair of new courses, Analytics Academy has added some new features:

• 24/7/365 Certification: You can complete courses at your own pace and earn a certificate of completion at any time. No more certification windows!

• User Profile: You can track your progress and access your certificate from your user profile.

• Track your lesson progress: You can track your progress through a course, and resume a course where you left off. 


Sign up for Google Analytics for Beginners or Advanced Google Analytics and start learning today. 

Happy Analyzing.

Posted by Katie Richardson, Program Manager, Google Analytics

Google Analytics Breakthrough: From Zero to Business Impact

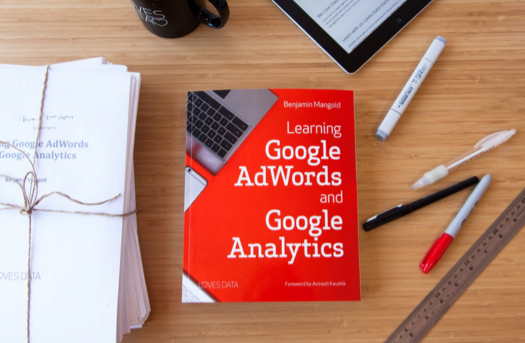
Looking to sharpen your Google Analytics skills as you kick off 2017? A new full-color book is now available for analysts, marketers, front-end developers, managers, and anyone who seeks to strengthen their Google Analytics skills.


"In Google Analytics Breakthrough: From Zero to Business Impact, we strive to provide a step-by-step resource to help readers build a solid foundation for analytics competence. It starts at strategy and core concepts, extends to advanced reporting and integration techniques, and covers all the nuts, bolts, tricks, gaps, and pitfalls in between," says coauthor Feras Alhlou, Co-founder and Principal Consultant of E-Nor. "The book is structured to offer a succinct overview of each topic and allow more detailed exploration as the reader chooses."

 The book includes contributions straight from the Google team.  Avinash Kaushik's foreword starts things off with a constructive mindset, and Paul Muret's cover piece takes a unique perspective on the evolution of Google Analytics from the days of Urchin.  Krista Seiden lends her top reporting tips, and Dan Stone shares insights on remarketing. Industry experts such as Jim Sterne, Brian Clifton, and Simo Ahava also offer key takeaways.

At nearly 600 pages, the book is quite comprehensive, but the authors outline a few main themes below.

1- Define and Measure Success 
It still bears repeating: identify your KPIs as part of your measurement strategy. Map your marketing and development initiatives to the KPIs and center your analytics around your success metrics and specific improvement targets. You'll be much more likely to drive, detect, and repeat your wins, both big and small, if you always know what you're aiming for.

2- Keep Your Focus on User Journey 
This has multiple meanings. From a Google Analytics reporting standpoint, take advantage of the reports and features - such as Multi-Channel Funnel reports, custom segments, custom funnels in Analytics 360, and calculated metrics - that go beyond session scope and begin to approach a more complete picture of user journey.

Even more fundamentally, remember to always relate your data to user experience.  Contributor Meta Brown offers specific advice on crafting a hero story to make your analytics data more accessible and impactful for all stakeholders.

 3- Take Full Advantage of Google Tag Manager 
"When we were first outlining the book, we briefly considered dual-track native and Google Tag Manager examples ," recollects coauthor Eric Fettman, Senior Consultant and Analytics Coach at E-Nor. "Shiraz steered us to a basically GTM-only approach, which  streamlined the implementation chapters and really highlighted GTM's flexibility and power."

In addition to in-depth discussions about GTM's triggers, variables, and data layer, the book examines the relatively new and perhaps underutilized Environments feature.  While the publication schedule didn't allow direct inclusion of GTM Workspaces, the supplemental online materials offer a detailed Workspaces walkthrough. 

As an illustration of Google Tag Manager's flexibility, this Lookup Table variable will allow a single Google Analytics tag to populate into different properties based on hostname.

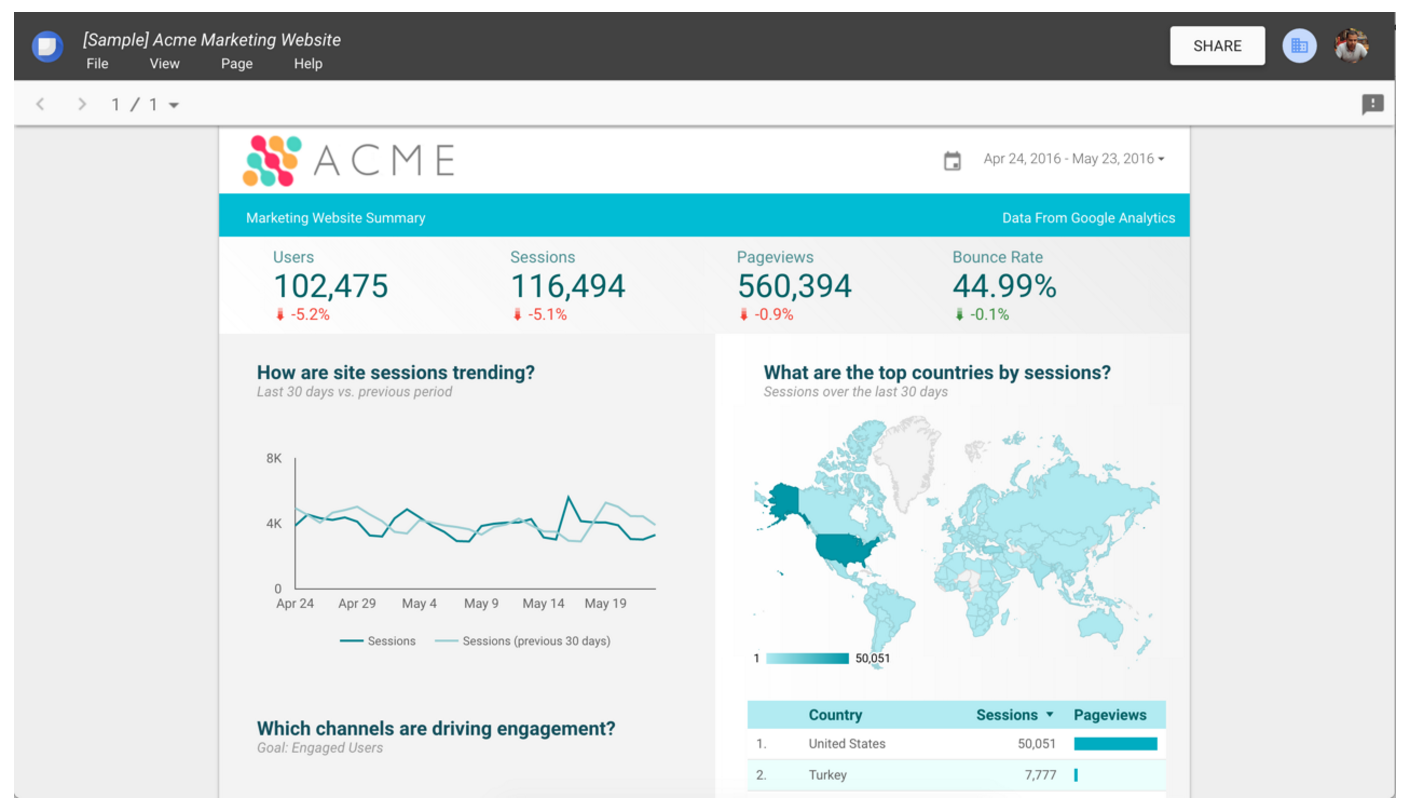
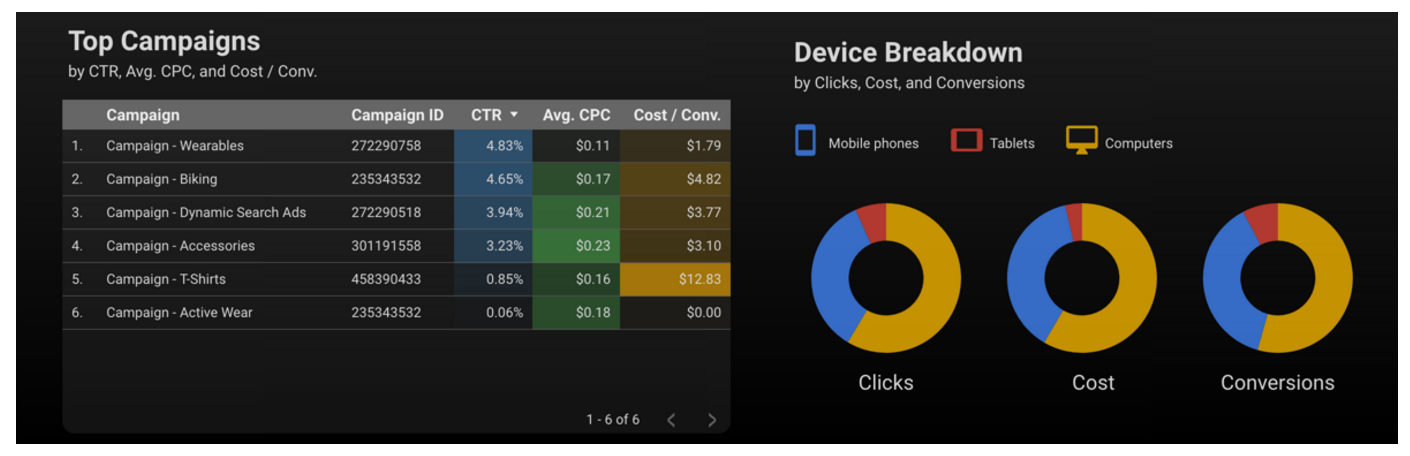
4- Help Google Analytics Tell Stories in Your Own Language 
From both an implementation and reporting standpoint, Google Analytics provides a range of capabilities for customizing your data set and optimizing the reporting experience so your data speaks clearly and relevantly.  Custom dimensions and data import for your content, products, and back-end user classifications will let you build more meaningful and actionable narratives. Custom channels - for paid social traffic, as an example - will certainly yield much greater insights than default channel reporting. Alternate report displays and custom reports allow you to combine and isolate the metrics that are most important for the analysis at hand.

And don't fail to take full advantage of basic features such as secondary dimensions. The Landing Pages report is good by default; Landing Pages with Source/Medium applied as a secondary dimension might reveal a whole new secret.

5- Master the Basics for Advanced Benefits in GA 360, BigQuery & Integration 
The fundamental Google Analytics data collection and processing tactics remain as important in 2017 as ever.  You still need to implement event tracking, with a meaningful naming convention, to really understand user interaction. You must maintain consistency in campaign tagging for clarity in your Acquisition reports. In many cases, you still must apply view settings and/or filters to insure data quality in all of your Google Analytics reports.

The benefits of clean data, however, extend beyond the Google Analytics user interface.  If you're exporting to BigQuery (integration with BigQuery is enabled for Analytics 360 organizations) to analyze conversions over multiple sessions by different traffic channels, the campaign tagging and channel grouping work that you have already performed for your GA reporting will again prove critical.  If you're also pulling your CRM data into BigQuery to integrate with GA data and measure the effect of specific interactions – such as downloads, video views, or live chats – on customer lifetime value, you'll be doubly glad that you took the time to properly implement your Google Analytics event tracking from the start.

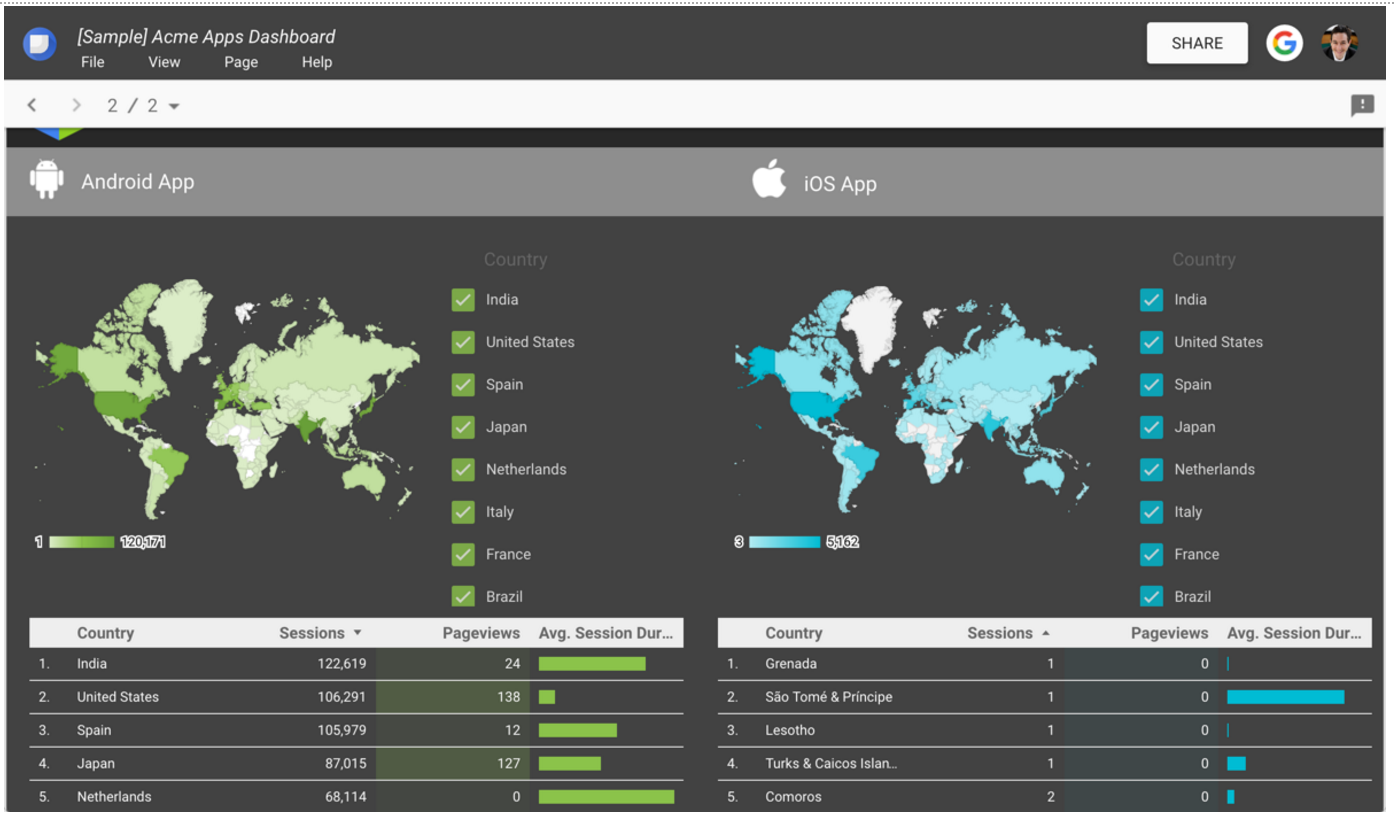
Going forward, as we begin to navigate through dynamic visualizations in Google Data Studio and look towards advanced solutions such as Attribution 360 and Audience 360, the competitive advantage of good, consolidated Google Analytics data, as a dataset for complementary tools and environments, will only magnify.

"We dedicate the book to our contributors, to our clients, to the team at E-Nor, and especially to our coauthor and E-Nor cofounder Shiraz Asif, who passed away in March 2016 and will always be keenly missed." For more about Google Analytics Breakthrough: From Zero to Business Impact, visit www.gabreakthrough.com.

Posted by Feras Alhlou,  Principal Consultant and Co-founder of E-Nor, Inc., Google Analytics Partner

Announcing Data Studio: our free, new, Data Visualization Product

Earlier this year, as part of the Google Analytics 360 Suite announcement, we unveiled a new data visualization and reporting platform for large enterprises — Data Studio 360.

Yesterday, at the Google Performance Summit, we announced a free version of Data Studio for individuals and smaller teams. Data Studio lets you connect to all your marketing data and turn that data into beautiful, informative reports that are easy to understand, share, and fully customizable. We wanted to take a moment to give you some of the details about Data Studio.

Making it easy to share data within your organization — or with the world

One of the fundamental ideas behind Data Studio is that data should be easily accessible to anyone in an organization. We believe that as more people have access to data, better decisions will be made.

With multiple data connectors, you can now easily create dashboards from many different types of data and share with everyone in your organization - and you can mix and match data sources within a single report. For example, you can combine Google Analytics data and Google AdWords data into a single report.


Today, we’re offering multiple data connectors, so you can connect to Google Analytics, Google AdWords, Google Sheets and many other Google services. But Data Studio offers integration with a wide variety of data sources. There’s also a connector for BigQuery and we will soon have connectors to SQL databases that will let you access first party data.

Data Studio is more that just sharing reports with other people — it’s true collaboration. We used the same infrastructure as Google Docs, so you can edit reports together, in real time. This is useful as you combine data from multiple teams and need others to add analysis and context to the report.

Visualization tools to style your reports and data 

In addition to new sharing and collaboration tools, Data Studio gives you many flexible ways to present your data. Sure, there’s the usual assortment of bar charts, pie charts, and time series. But we’ve also included some new visualizations — like bullet charts that help you communicate your progress towards a business goal.


Another advanced feature is the ability to create a heatmap using tabular data. This visualization makes it easy to instantly identify outliers within a table of data.


Data Studio also has an array of other features to help you customize how you present your data. There are a number stylistic tools that enable you to design your reports to represent your specific brand. There are also interactive data controls, like a date picker and dynamic filters, that enable report editors to make reports interactive for viewers.

For example, let’s say you want to let users segment a report by country. Just add a control element to the top of your report and the user can dynamically segment the data. In the image below the check boxes will change the data in the map and data table based on what a user selects.


These are just a few of the tools that you can use to help others in your organization understand data. 

Two versions for different types of organizations

 The primary difference between Data Studio 360 and the free version, Data Studio, is the the number of reports you can create, which is five per account. Both versions support connecting to unlimited data sources and offer unlimited report viewing, editing and collaboration. For more information, check out our Help Center.

Getting started

If you’re ready to get started, watch this brief overview that will help you build your first reports.


Then check out the interactive walkthrough - it’s built with Data Studio. Just choose “Welcome to Data Studio (Start Here)” from the list of reports in your account.

 Data Studio is currently available to users in the United States and we’ll be rolling it out to other geographic regions throughout the year. We hope it helps you share more data and make better business decisions.

Happy Dashboarding,

Posted by Nick Mihailovski & Nathan Moon, Data Studio team

New Book: Learning Google AdWords and Google Analytics

This is a guest post by Benjamin Mangold. Benjamin is the Co-Founder of Loves Data, a Google Analytics Certified Partner. When he’s not seeking out insights, you will find Benjamin blogging, presenting or playing with the Measurement Protocol. 


A new book showing you how to make the best use of both Google Analytics and Google AdWords is now available. The book is called Learning Google AdWords and Google Analytics by Benjamin Mangold of Loves Data (a Google Analytics Certified Partner). Here’s what Benjamin says about the book:

“Google Analytics is an incredibly powerful business tool and the focus of this new book is to show you how to unlock the hidden value of your reports. There are lots of techniques and tips covered, making the book a very practical resource to get more out of your website data and your online advertising campaigns.” 

Google Analytics Advocate, Justin Cutroni says, “Benjamin brings all of the information you need to get started and to grow and take advantage of these powerful tools. What I really like is how he brings all of the information about both systems – AdWords and Analytics – together in one central place. He makes it easy to understand how to measure your AdWords campaigns in Google Analytics data. This makes the information very actionable, which is exactly what you want.”

The book includes a foreword by Avinash Kaushik who says, “It balances the critical strategic elements that need to be present in any digital discussion (jump to Chapter 5), and the tactical elements that you’ll find useful every day (for example, Chapter 13 or, my favorite, Chapter 21).”

Google Analytics topics covered in the book include:
  • Using the Multi-Channel Funnels reports
  • Interpreting reports to improve your website and marketing
  • Comprehensive overview of reports and interface features
  • Introduction to Google Tag Manager
The way you can use Google AdWords and Google Analytics together is also covered, showing you how you can take your search and display campaigns to the next level. 

Google AdWords topics include:
  • How to run successful Google AdWords campaigns
  • Advanced campaign configuration opportunities
  • Reporting on campaign performance and optimization
  • Setting up and running display campaigns
You can grab a copy now on Amazon in paperback or for your Kindle.

Posted by Benjamin Mangold, Google Analytics Certified Partner

Google Analytics Conference Nordic in Stockholm, Sweden

Join the Google Analytics Certified Partners for Google Analytics Conference Nordic in Sweden. 

The event takes place August 26 in Stockholm, Sweden, and is followed by a workshop on August 27.

Started based on an initiative by Outfox, who gathered the other Google Analytics Certified Partners, the conference is now returning for the fifth consecutive year.

Our Stockholm conference includes:

 • Case studies from businesses and other organizations, such as The Swedish Society for Nature Conservation, Viaplay, and Storebrand. In other words, Google Analytics for sales, entertainment, non-profits, insurance, and more!
 • Expert presentations by Google Analytics Certified Partners.
 • Opportunities to interact with peers and experts
 • ...much more!

The conference is being visited by two top speakers from Google, Sagnik Nandy and Daniel Waisberg.

Sagnik Nandy is technical leader and manager of several Analytics and Reporting efforts in Google. He has hands on experience in building, scaling, deploying and managing large scale systems used by millions of web sites around the world. 

Daniel Waisberg is Analytics Advocate at Google, where he is responsible for fostering Google Analytics by educating and inspiring Online Marketing professionals. Both at Google and his previous positions, Daniel has worked with some of the biggest Internet brands to measure and optimize online behavior. 

Besides meeting Google, you’ll meet several Nordic Google Analytics Certified Partners. You will also meet and learn from several end users who use Google Analytics on a daily basis.

To join us in Stockholm in August, visit the conference site and secure your ticket.


Posted by Lars Johansson, Google Analytics Certified Partner and Google Analytics Premium Authorized Reseller

Google Analytics Demos & Tools

As a member of the Google Analytics Developer Relations team, I often hear from our community that they want to do more with GA but don't always know how. They know the basics but want to see full examples and demos that show how things should be built.

Well, we've been listening, and today I'm proud to announce the launch Google Analytics Demos & Tools, a new website geared toward helping Google Analytics developers tackle the challenges they face most often.


The site aims to make experienced developers more productive (we use it internally all the time) and to show new users what's possible and inspire them to leverage the platform to improve their business through advanced measurement and analysis.

Some highlights of the site include a full-featured Enhanced Ecommerce demo with code samples for both Google Analytics and Google Tag Manager, a new Account Explorer tool to help you quickly find the IDs you need for various Google Analytics services and 3rd party integrations, several examples of easy-to-build custom dashboards, and some old favorites like the Query Explorer.

Google Analytics Demos & Tools not only shows off Google Analytics technologies, it also uses them under the hood. All pages that require authorization use the Embed API to log users in, and usage statistics, including outbound link clicks, authorization status, client-side exceptions, and numerous other user interaction events are measured using analytics.js.

Every page that makes use of a Google Analytics technology lists that information in the footer, making it easy for developers to see how all the pieces fit together. In addition, the entire site is open sourced and available on Github, so you can dive in and see exactly how everything works.

Feedback is welcome and appreciated!

By: Philip Walton, Developer Programs Engineer

Moving from Data to Decisions in the next Analytics Academy course

Today we’re excited to announce our next Analytics Academy course, Ecommerce Analytics: From Data to Decisions. As the name suggests, we’ve designed this course specifically to help marketers and analysts who work in ecommerce understand how Analytics data can be used to make decisions and take actions that improve their ecommerce performance. 

In the course, you’ll join instructor Justin Cutroni to explore topics through the lens of a fictional online retailer, The Great Outdoors. This practical example will help bring common ecommerce questions to life with relevant planning, reporting and analysis examples. 

By participating in the course, you’ll learn how to:
  • select and customize meaningful reports that align with your ecommerce measurement plan
  • use segmentation to compare interesting subsets of your online audience
  • and conduct actionable in-depth analyses in Google Analytics.


In addition to teaching you how to make the most of reporting features like segmentation, the course has a special focus on the new Enhanced Ecommerce for Google Analytics. This set of new features, which was announced in May, helps ecommerce companies understand the customer journey and merchandising tactics at a much deeper level. The course will introduce you to powerful analysis tools, like the Product List Performance report, the Shopping Behavior report and the Checkout Behavior report.

Sign up for the Ecommerce Analytics course now and join us when it opens on July 8, 2014. 

Happy Learning!

Post By: Christina Macholan & The Google Analytics Education Team