Last month we announced we removed the five report limit in Data Studio, allowing you to create and share as many reports as needed — all for free. Today we are opening up access to 180+ countries, enabling even more businesses to easily connect to data and create beautiful, informative reports that are easy to read, easy to share, and fully customizable.
In addition to making Data Studio accessible in more countries, we’re also adding more powerful features to help you better analyze and report on your data, including:
Filters
You can now filter your data in more ways, and it's easier to reuse filters on multiple charts. This new functionality includes:
Google Analytics segments
You can now apply Google Analytics segments to your charts!
A Google Analytics segment represents a subset of your data, for example, Returning Users. You can now see all your Google Analytics segments in Data Studio and apply them to any chart. And, if you update the definition of your segments in Google Analytics, those changes will apply to the segments in Data Studio.
Learn more in the Segments Help Center article.
More powerful data connectors
We’ve improved several of our most popular data connectors, YouTube, DoubleClick Campaign Manager, and AdWords, by adding many new dimensions and metrics. Some highlights include adding YouTube video title, DoubleClick Campaign Manager revenue and cross-environment conversions broken out by app, AdWords campaign ID, and keyword quality score. For a full list of all the new fields, please see the Data Studio release notes.
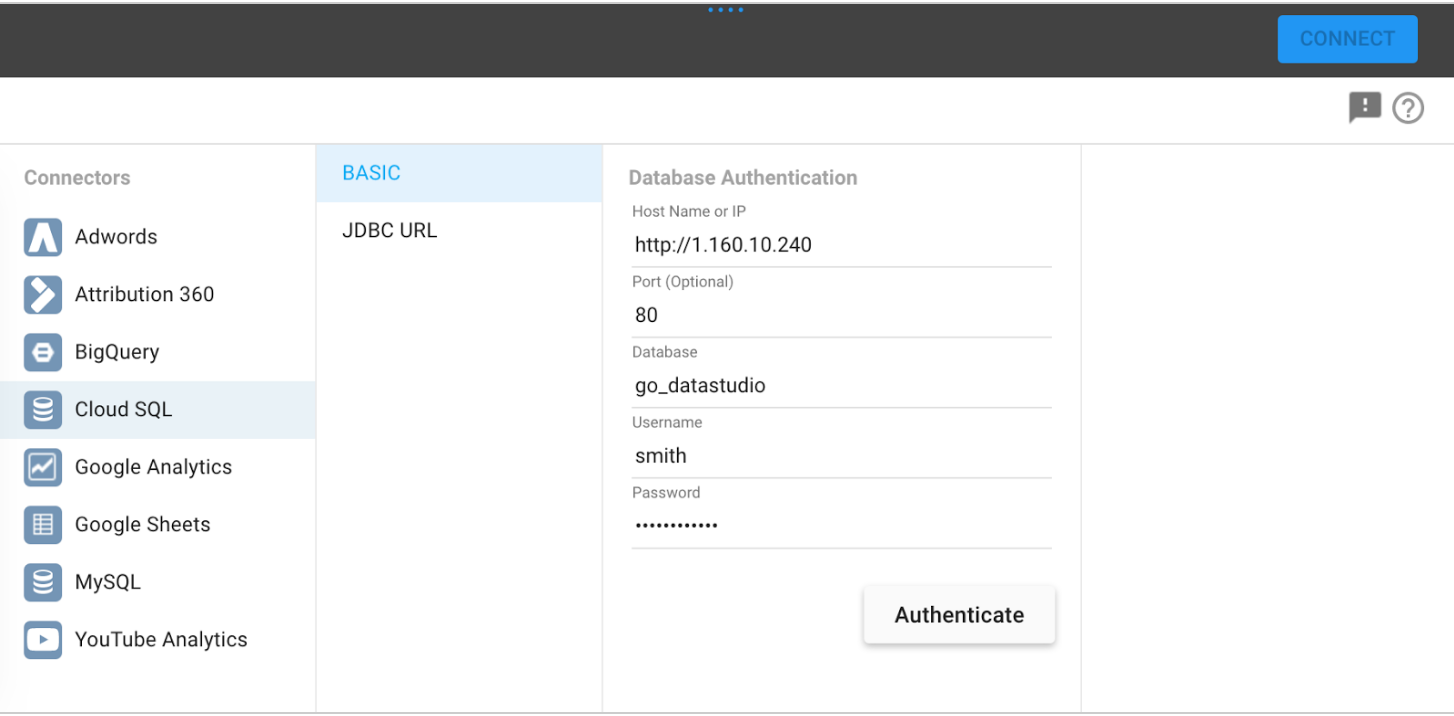
Google Cloud Platform integrations
We’re also announcing tighter integration with the Google Cloud Platform to enable faster data reporting at scale and more powerful functionality.
File upload
Not all your data resides within SQL or Google databases. Data Studio now has the ability to upload up to 2GB of CSV data for free enabling you to bring in data from anywhere. Have more data? Upload directly into BigQuery using your BigQuery account to take advantage of the scalable processing power of Google's infrastructure.
Tighter BigQuery integration
Not only can you upload data directly into BigQuery, Data Studio now supports Standard SQL in BigQuery for custom queries and partitioned tables.
Learn more about these new features
Not sure where to start? You can browse our gallery of Data Studio templates. Need more information on these new features? Visit the Help Center articles for more details:
As always, your feedback and questions are welcome in the Data Studio community forum.
Happy reporting!
New, powerful features
In addition to making Data Studio accessible in more countries, we’re also adding more powerful features to help you better analyze and report on your data, including:
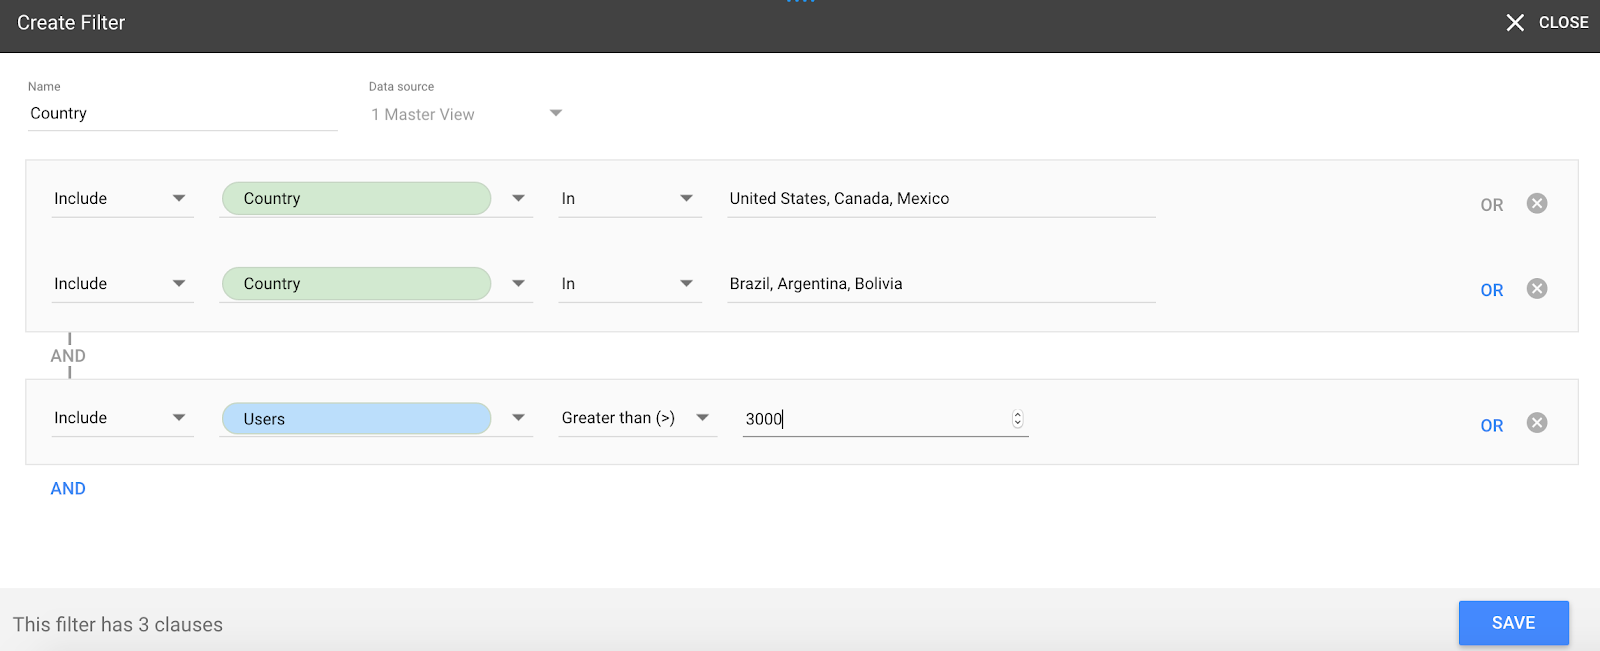
Filters
You can now filter your data in more ways, and it's easier to reuse filters on multiple charts. This new functionality includes:
- Reuse – Create a filter once and then use it on as many different components on the report as you want. No more recreating identical filters!
- Compound filtering – Combine multiple AND and OR filter conditions together into one reusable filter.
- Metric filters – Filter metric values that are too large, too small, or within a specified range.
New Filters UI
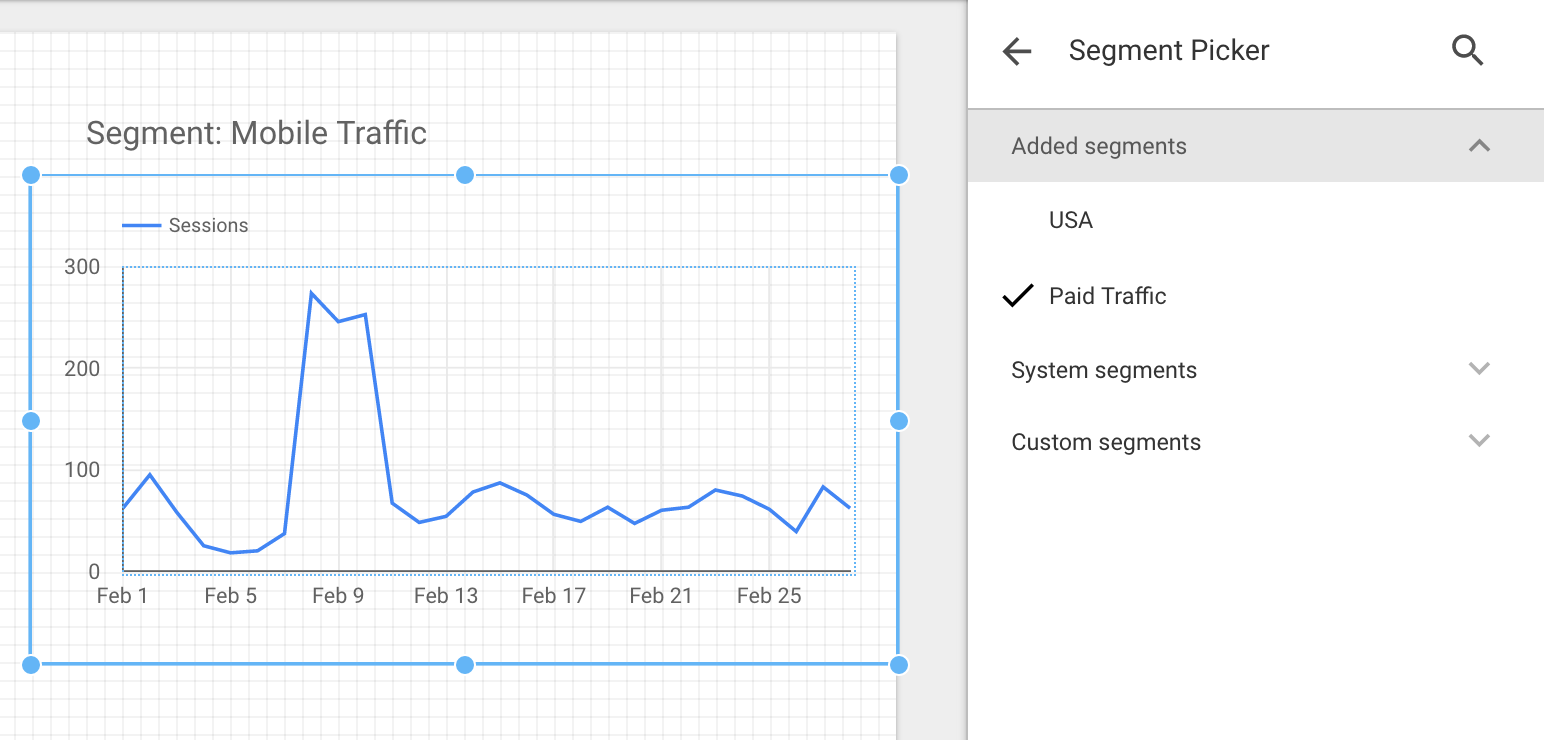
You can now apply Google Analytics segments to your charts!
A Google Analytics segment represents a subset of your data, for example, Returning Users. You can now see all your Google Analytics segments in Data Studio and apply them to any chart. And, if you update the definition of your segments in Google Analytics, those changes will apply to the segments in Data Studio.
Learn more in the Segments Help Center article.
Data Studio allows you to link to your Google Analytics segments.
More powerful data connectors
We’ve improved several of our most popular data connectors, YouTube, DoubleClick Campaign Manager, and AdWords, by adding many new dimensions and metrics. Some highlights include adding YouTube video title, DoubleClick Campaign Manager revenue and cross-environment conversions broken out by app, AdWords campaign ID, and keyword quality score. For a full list of all the new fields, please see the Data Studio release notes.
Google Cloud Platform integrations
We’re also announcing tighter integration with the Google Cloud Platform to enable faster data reporting at scale and more powerful functionality.
File upload
Not all your data resides within SQL or Google databases. Data Studio now has the ability to upload up to 2GB of CSV data for free enabling you to bring in data from anywhere. Have more data? Upload directly into BigQuery using your BigQuery account to take advantage of the scalable processing power of Google's infrastructure.
Tighter BigQuery integration
Not only can you upload data directly into BigQuery, Data Studio now supports Standard SQL in BigQuery for custom queries and partitioned tables.
Learn more about these new features
Not sure where to start? You can browse our gallery of Data Studio templates. Need more information on these new features? Visit the Help Center articles for more details:
As always, your feedback and questions are welcome in the Data Studio community forum.
Happy reporting!
Posted by Dave Oleson, Data Studio Product Manager