Tag Archives: Data Studio 360

Google Data Studio: New Feature Roundup

The Data Studio team is constantly working on new features to improve the user experience for both report creators and viewers! In this blog post we’ll highlight some recent launches that you may have missed.

Filter controls: search 
Filters give report viewers a powerful way to slice data by specific segments. But filters with hundreds or even thousands of possible values to choose from were previously difficult to use, requiring scrolling through very long lists of filter items. We recently added a search feature within the filter component, letting users quickly find and select or deselect specific items.


Filter controls: single-select 
There are also scenarios when it only makes sense to filter a report on a single value, as filtering on multiple values would return confusing or nonsensical data. Report creators now have the ability to configure filters to allow for single-selection only.


Combo charts
New Combo charts allow users to create a line chart with a non-time-based dimension on the X-axis (previously only time-based dimensions were supported). The new component can plot a single dimension with up to 5 metrics, or 2 dimensions with a single metric. Learn more about Combo charts here.


Links in tabular data 
Tables in Data Studio reports can now display clickable links! This feature introduces a new type of interactivity, as viewers can now be redirected to to relevant content outside the report. To use this feature, report owners must use a data source containing a column of URLs. Data Studio will detect this column and assign it to the URL field type (if automatic detection does not work data source owners can also set the field type to URL manually). Learn more about this here.


Submitting and voting for new features
The Data Studio team will continue to introduce new features and product enhancements. Have a feature request? You can view requests submitted by other users, upvote your favorites, or create new ones. Learn more here.

Posted by Alon Gotesman, Product Manager, Google Data Studio

New Data Studio Data Control

Today we’ve made it dramatically easier to view your Google Analytics data in Data Studio using the new Data control. When a report is created using the Data Control, all viewers can see their own data in the report, without creating anything.

Check out these quick video to see this feature in action
Try it out now! 
We added the Data control to these templates so you test it out with your data:  

Overview Report

Ecommerce Template

This feature is great if you:
Are an agency or large organization with access to many Google Analytics views and do not want to create a Data Studio report for each view. For example, if you have a set of charts and data you monitor every day, you can now build a report in Data Studio with those charts and data, add the Data Control, and quickly go between any of the views you have access to, allowing you to monitor your entire business very fast.

Are a large organization with many websites across: different brands, different regions, or different business units, and want to unify reporting and KPIs across your entire organization. Now you can build a template report in Data Studio, add the Data Control, and share the report across your organization. Every user will be able to see their data, in your curated report.

The data control is public for all users.

Read the Help Center for more details on how to use it.

If you build an exciting report, please submit to our gallery, so we can showcase it.

Posted By Nick Mihailovski, Product Manager, Data Studio 

Data Studio: Enhanced AdWords MCC Support

An AdWords manager account (MCC) is a powerful tool for handling multiple AdWords accounts. Manager accounts allow users to link several accounts so they can be viewed in a single location, and are frequently used by third-party advertisers such as agencies and marketing professionals.

Today the Data Studio team is releasing an enhanced AdWords connector, giving users the ability to select MCC sub-accounts and set up reports for accounts containing multiple sub-account currencies.

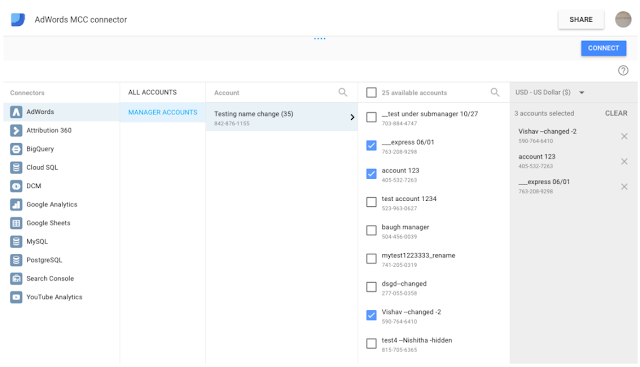
Click image for full-size version
New capabilities

There are two major enhancements to the AdWords connector:

1. Selecting sub-accounts: prior to this release it was only possible to connect to an entire MCC account as the data source for a Data Studio report. This enhancement allows users to define a data source by selecting up to 75 individual sub-accounts within an MCC account.

2. Filtering on currencies: one common challenge with MCC accounts occurs when sub-accounts are set to different currencies. While metrics such as impressions and clicks can be aggregated correctly across these sub-accounts, currency fields like Cost and Average CPC cannot. The enhanced AdWords connector allows MCC account holders to filter sub-accounts by currency to avoid this problem, and removes currency fields from the connector if multiple currencies are present.

Connecting to AdWords MCC accounts
To connect to MCC accounts, create a new Data Studio data source and select the AdWords connector. If you have access to an MCC account, a “MANAGER ACCOUNTS” option will appear. The account holder can then select sub-accounts they are interested in, or use the pull-down menu in the upper-right corner to filter for sub-account currencies.

Note that existing Data Studio connections to MCC accounts must be edited and reconnected or recreated from scratch to take advantage of the new enhancements.

Your feedback and questions is welcomed in the Data Studio community forums

Happy Reporting!

Posted by Alon Gotesman, Google Data Studio team

The New Google Data Studio PostgreSQL Connector

Over the past months, we’ve been hard at work adding and enhancing all of our connectors. After our recent launch of the MySQL connector, many users asked for a PostgreSQL connector.

So today we’ve launched a new PostgreSQL connector in Google Data Studio!

Visualizing your data hasn’t been easier.

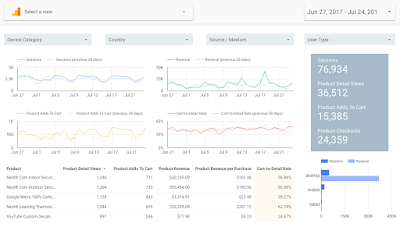
PostgreSQL data visualized in Data Studio
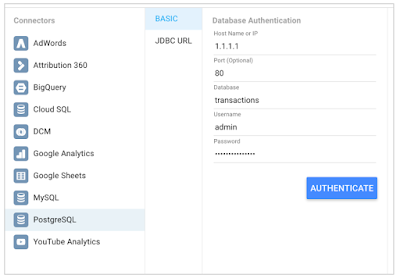
To get started, create a new Report, add a new Data Source, and select the PostgreSQL Connector. Then use the wizard to configure access to your PostgreSQL database. a new Report, add a new Data Source, and select the PostgreSQL Connector. Then use the wizard to configure access to your PostgreSQL database.

The new connector in our ever expanding list
Once connected, you will see a list of all your columns and you can create custom aggregations and calculations over your data directly in Data Studio!

Calculations on top of fields accessed from postgreSQL
We’re excited to learn about what you do with this connector. Visit the Data Studio PostgreSQL connector help center article, for more details on how this connector works.

Finally, we prioritized this connector directly from your feedback. If there are any additional connectors you would like added, please fill out the Data Studio Data Integrations Survey.

Posted By Anand Shah, Product Manager, on behalf of the Google Data Studio team

Data Studio: DoubleClick Campaign Manager Connector

Google Data Studio (beta) allows users to connect, transform, visualize, and share data no matter where it lives. Today we are happy to announce that DoubleClick Campaign Manager (DCM) customers can pull their data into Data Studio dashboards instantly!


With this new connector, DCM customers no longer need to import data into spreadsheets. Users can now quickly create dashboards with over 50 DCM metrics and dimensions. These dashboards are an effective way to track and optimize campaign performance and share reports with client and agency stakeholders.

Creating a new report with DCM data
Ready to get started? The first step is to connect to your DCM network or advertiser through the Data Sources page.


Next you can create a new report from scratch or use our DCM template. With just a few clicks, the dashboard is populated with your data.

Want to learn more? Looking for a new connector in Data Studio?

To learn more about the new DCM connector, please visit our Help Center or post your questions in the Data Studio community forums.

Is there a specific data service you wish to be able to access and visualize through Data Studio? We welcome your feedback via the connector feedback form — we read all responses and use them to prioritize new connectors.

Happy reporting!

The Data Studio team

Spotlight on Data Studio: Beautiful Reports and Collaboration Just Got Easier

We launched Google Data Studio (beta) in the U.S. earlier this year, and last week, we expanded availability to 21 additional countries.* We’re excited to offer Data Studio to companies across the globe so they can easily create and share reports and dashboards, and ultimately use insights and collaboration to make better business decisions.

Organizations today collect an increasingly large amount of data. In a world of web analytics, CRM systems, and third-party sources, data-driven decisions should be easier than ever before. However, all of this data has presented a significant challenge: making it easily accessible and useful.

Having multiple data sources that live in silos within your organization compromises your ability to spot critical business opportunities and issues when they matter most. This is a widespread challenge, with 84% of marketers saying they don’t believe their data sources are well-integrated, according to a 2016 Forrester study.

Data Studio solves this problem by allowing you to easily connect your data and create beautiful, informative reports that are easy to read, easy to share, and fully customizable. Create up to five custom reports with unlimited editing and sharing. All for free.

Get started today so you can:

  • Put all your data to work. Easily access the data sources you need to understand your business and make better decisions.
  • Transform your data. Quickly transform raw data into easy-to-follow reports and dashboards — no code or queries required.
  • Build engaging reports and dashboards. Data Studio gives you the ability to create meaningful, shareable charts and graphs that bring your data to life.
  • Leverage teamwork that works. Work together quickly, from anywhere, by sharing reports via Google Drive.

Not sure where to start? Good news: We’re releasing our first batch of templates today to remove that hurdle. Businesses can use a library of templates to get up and running in a matter of minutes.


Get started for free.

Happy reporting!
The Data Studio team

*Canada, Brazil, Germany, Netherlands, Spain, France, United Kingdom, Italy, Indonesia, India, Japan, South Korea, Australia, Hong Kong, Malaysia, New Zealand, Philippines, Singapore, Thailand, Taiwan, Vietnam

Announcing: Smarter, more sharable analytics innovations


We’re incredibly excited to share with you the new analytics product innovations announced just moments ago at the Google Performance Summit. These innovations for the Analytics 360 Suite are more integrated, more collaborative, and use built-in intelligence to handle more data than ever in our new multi-screen, cross-channel world.

Why are these innovations arriving now? Because across the millions of websites using Google Analytics today, more than half of all web traffic now comes from smartphones and tablets1. And every year, over half of the trillions of searches on Google happen on mobile2.

This shift to mobile has made marketers' jobs more complex. We all have more opportunities than ever to reach consumers all day and measure their behavior in their I-want-to-know, I-want-to-go, I-want-to-do and I want-to-buy moments. But it's also harder to keep all the channels and touchpoints straight. You can’t market effectively in today’s world with products that were designed for a desktop-first world.

Two months ago we announced the Google Analytics 360 Suite, an enterprise-class modern measurement solution built from the ground up to help enterprise marketers and analytics professionals succeed in this new multi-screen world.

Today, we announced new innovations focused on three themes: 


Read on to learn the analytics highlights from today’s announcements.

Enterprise analytics re-imagined for modern marketing 

Google Analytics 360 Suite is beginning to roll out to current customers. This includes Google Analytics 360 (formerly known as Premium), Attribution 360 (formerly known as Adometry), Audience Center 360, and Tag Manager 360 when used as part of Analytics 360. The rollout will occur in phases over the next several months, and users will see an improved and unified product experience and a new look and feel across all Analytics 360 Suite products.

Google Optimize 360, our website testing and personalization product, is now available in paid BETA globally. The results from our closed beta have been amazing: one of our beta customers reduced the time to deploy a site experiment from three days to 10 minutes. Optimize 360’s deep integrations with Analytics 360 increase testing agility and reduce setup times. With just a few clicks, you can use the audiences and goals you’ve already created in Analytics 360 to run experiments with Optimize 360.

Google Data Studio 360, our data visualization product, will start rolling out in paid BETA in the US. This is our enterprise version with licensing starting at 200 users. Data Studio 360 allows you to connect to all your data with native integrations across many popular Google products, as well as non-Google data. Visualize your data by creating reports and dashboards. Share your data across your organization with built-in, real-time collaboration.

Google Data Studio is a completely new, free version of Data Studio 360 that we’re launching today! Starting now, anyone can use Data Studio to create up to 5 reports with unlimited sharing, editing and collaboration. We’re starting the BETA in the U.S. and rolling out to other regions throughout the year.

Succeeding together 

With massive volumes of data being created across screens, channels and touchpoints, built-in intelligence has become foundational in approach to analytics product development. This means we’re doing more of the heavy lifting for you, and we’re seeing a tremendous response from businesses. For example, Smart Goals in Analytics is now enabling more than 60K advertisers to optimize their AdWords performance. You’ll continue to see exciting developments in the future related to intelligence.

As consumers blur the lines between online and offline, it’s more important than ever to build your business in new ways. Google is excited to go on this journey with you, and we're building much more for the multi-screen, cross-channel world. Visit our website to learn more about all the new products in the Analytics 360 Suite.

To see the full range of ads and analytics innovations announced this morning, watch the Google Performance Summit keynote here.


1 Google Analytics 2016 
2 Google 2016