Tag Archives: Attribution 360

Solving the enterprise attribution challenge


On Tuesday, we announced Google Attribution, a new free product to help marketers measure the impact of their marketing across devices and across channels. Our goal is to help every business, large or small, solve the attribution challenge and better understand if their marketing is working. To meet the needs of our largest advertisers, we’re also introducing an updated version of our enterprise attribution product, Google Attribution 360.

Google Attribution 360

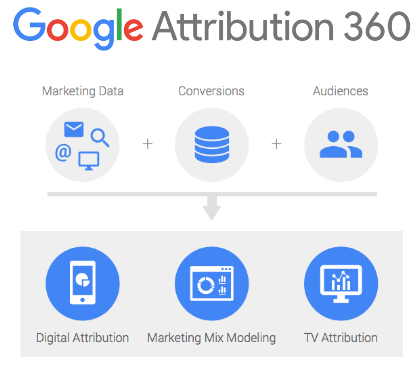
Just like with the free product, Attribution 360 is easy to set up, works across channels and across devices, and makes taking action easy. Both products also offer data-driven attribution, which uses machine learning to determine how much credit to assign to each step in the consumer journey. In addition, Attribution 360 is designed to be highly customizable and can measure ads from DoubleClick Campaign Manager. This means that you can get a view of your marketing performance that matches up with how you view your business. The new version of Attribution 360 is currently in beta, and will launch more broadly later this year.
Here’s how Attribution 360 is designed to solve the enterprise attribution challenge:
Fast setup
Attribution 360 offers seamless integrations with Google Analytics, DoubleClick Campaign Manager, DoubleClick Bid Manager, and DoubleClick Search. You’ll get all your marketing event data in Attribution 360 with no need for retagging and no data loss between systems. You simply link your accounts and reports will usually be available within 48 hours.
“The setup process for Attribution 360 reduced the time to first data from 3 months to just a matter of weeks. Using Google Analytics data was so much easier, we already had our GA tags onsite and validated. It just made life so much easier.” - Eric Bernhard, Marketing Innovation Manager at Dixons
Flexible data
Attribution 360 has a rich set of features to simplify the challenge of importing and managing your external data sources. You can ensure that your data is complete and correct with enhanced preview capabilities, in-product data quality reporting, and the ability to reprocess your data if you make changes to your setup.
Measures TV
The TV Attribution feature within Attribution 360 helps businesses integrate digital and broadcast data to understand their cross-channel performance. Good news: TV Attribution is now included in Attribution 360 with no extra cost and is available directly in the Attribution 360 UI.
Easy to take action
Of course the insights you get are only valuable if you can put them into action. Here are two ways Attribution 360 makes it easy:
  • The in-product Digital Optimizer lets you explore a variety of optimization scenarios to inform future marketing investments and make your media more effective and efficient.
  • Programmatic connectors send results directly to bidding platforms so your media buys use the most accurate attribution data.
Here’s how one of our customers, Confused.com, uses Attribution 360 to improve their search advertising.

Confused.com increases paid search conversions by 28% with Google Attribution 360

Launched in 2001, Confused.com was the first insurance comparison site in the United Kingdom. This 100% e-commerce company helps people save money on car insurance and related services.
Paid search is a critical part of Confused.com’s acquisition strategy. CEO Martin Coriat challenged his marketing team to improve paid search with data-driven insights.
To more deeply understand how people really interact with Confused.com’s marketing messages, the team implemented Attribution 360. Data-driven attribution insights showed each keyword’s role in the customer journey and the associated value to Confused.com. As suspected, data-driven attribution gave Confused.com proof of over-investment on some lower-funnel keywords.
Attribution 360 also revealed opportunities to invest in untapped upper-funnel keywords. Using these insights, the team was able to take immediate action in re-allocating spending to help drive up quote requests by 28% at a lower cost per acquisition.

“With careful data analysis and insights from Attribution 360, we’ve increased our quote volume and lowered our overall cost per acquisition. We’re now able to re-invest what we’ve saved back into paid search and put real pressure on our competitors.” - Sophia Glennon, PPC Manager at Confused.com You can read the full Confused.com case study here.

We look forward to sharing more updates on Attribution and Attribution 360 as we continue to invest in features and expand availability to more marketers.

Which TV Ads Made the Podium During the 2016 Olympics?

Note: Now that the 2016 Games are over, we've updated the analysis from the original opening ceremonies post to look at TV ad performance for the entire Olympics.


When the 2016 Olympics kicked off almost three weeks ago, many TV advertisers were crossing their fingers that their strategy would pay off.  Reaching as many as an estimated 27.9 million total viewers in the U.S., they were hoping their ads delivered relevant and compelling creative to the right audiences.  To answer the pay-off question, advertisers will predominately look at three specific areas of performance:
  1. Which ads were noticed by the audience?
  2. Which ads drove interest, shifted perception, and increased intent?
  3. And, which ads drove actual consumer response?
To get some insights into these questions, Google evaluated the top 12 brands totaling over 3.5 billion impressions that aired ads during the NBC broadcasts of the event.  The analysis is based on a combination of consumer surveys and second-screen (mobile, desktop, and tablet) response data. Presented in a live Google Data Studio dashboard, the result is a unique view into the full-funnel performance of the ads evaluated.

Awareness

Commercials during large, live sporting events like the Olympics are often uniquely created to leverage both the scale of the audience and the context of the event.  Whether it is telling the personal story of an athlete or playing to our passions like patriotism, they are intended to strike an emotional connection, entertain us, or make us stand up and take notice.

Nike's "Unlimited" ads were the big winner with almost 35% of respondents having remembered seeing the ads when prompted. Including an ad with the first quadruple amputee to summit Mount Kilimanjaro, Nike's powerful ads outpaced typical recall rates in the 20%-25% range.  Coca Cola was a close second with their "That's gold" ads which mixed Olympic competition with everyday moments.  Tide, McDonald's, and Samsung rounded out the top five with respectable recall rates. On overage, ad recall rates for the top five improved 3% percentage points from the initial analysis following the opening ceremonies.
Olympics Ad Recall
Almost 35% of respondents remembered seeing the Nike ads.
Additionally, of those respondents recalling the ad, only 37% could recall the specific product or service featured in the ad.  The net is that only about 13% of viewers can recall both the brand and product in a specific advertisement.  Tide's"Small can be powerful" ad with Simone Biles had the highest product recall rate at just over 50%.

Interest

Advertisers also want the ad to shift perceptions and create interest in the product or service featured.  By surveying both viewers who did not see the ad (unexposed) and those who did see the ad (exposed), we are able to get insights into the impact of each ad’s messaging and creative. Overall, the results were impressive.  On average, respondents who saw the ads were 27% more positive about the associated brands than those who did not.  Likewise, respondents who saw the ads were 32% more likely to find out more and/or purchase the product being advertised.

Compared to the lift measured during the opening ceremonies, both favorability and intent increased significantly over the span of the Olympics increasing ten and twelve percentage points respectively.
Ad Lift in Favorability and Intent
Consumers who saw the ads, were on average, 25% more positive about the brand and were 28% more likely to find out more or purchase the product in the ads.
Interestingly, the baseline favorability and purchase intent for both non-sponsors and Olympic sponsors are relatively equal.  However, non-sponsors saw a greater lift than sponsors with three more percentage points for favorability and seven more percentage points for intent.

Desire

These commercials don’t just make us laugh or make us feel better about the brand — they also make us search and visit websites. Second-screen searching—whether it’s to re-engage with the ad or to learn more about the product — is a powerful indication of desire.  By measuring incremental search queries on Google during the broadcast that are specific and modeled to be attributable to ads shown, we are now able to include responses in our analysis.  During the broadcasts, TV ad driven searches were almost exclusively on mobile — 83% compared to an average of 55% for those brands when the ads were not airing.  For brands, that means a presence on the TV screen isn’t complete without a strategy for small screens, as well.
"83% of searches on Google as a result of seeing the ads occurred on phones and another 10% occurred on tablets making a second screen strategy key to TV advertising."
BMW featured multiple products including a "Performance wheelchair" and garnered the top spot on the podium with a response strength index of 3.21.  McDonald’s and Samsung fought it out for the silver and bronze with 2.01 and 1.57 respectively.  The answer to the question “Do emotional ads work as well as product ads?” is, in this instance, “Yes.”  Both emotional and product ad creatives drove 50% more searches on average.  Also interestingly, ads by non-sponsors drove 17% more searches than their sponsor counterparts.
Indexed Ad Driven Response
Compared to the average of the top 12 ads studied, BMW drove 3.2 times more searches.
Finally, Coca Cola was the overall winner with strong full-funnel performance placing in the top three across all three funnel stages.

Whether people are tuning into the Olympics or their favorite TV show, they use their smartphones to search for information triggered by what they’re seeing.  In these micro-moments, advertisers need to be there, be useful, and be accountable.  That means if you advertise on TV, you can now get a new view of performance across each stage of the funnel — using a combination of consumer surveys and digital response, all in a matter of days.  Armed with these new insights, advertisers are now able to better understand and improve the performance of these investments in concert with their digital media.

Sourcing

Using Google Consumer Surveys to provide consumer ad awareness and interest research, an online survey was conducted in the United States during the period 8/19 - 8/21/16 using a validated, representative sample with a minimum of 700 respondents.  Response data is based on incremental TV ad-driven search queries (Google) during the course of the broadcast that are specific to the ad shown and are modeled by Google Attribution 360 to be attributable to the airings of the commercials. Response data is normalized for total ad impressions during the broadcast for each advertiser.

Happy Analyzing,

Which TV Ads Made the Podium During the 2016 Olympics Opening Ceremonies?

When the 2016 Olympics kicked off last Friday, many TV advertisers were crossing their fingers that their strategy would pay off. Reaching an estimated 26.5 million total viewers in the U.S., they were hoping their ads delivered relevant and compelling creative to the right audiences. To answer the pay-off question, advertisers will predominately look at three specific areas of performance:

  1. Which ads were noticed by the audience?
  2. Which ads drove interest, shifted perception, and increased intent?
  3. And, which ads drove actual consumer response?

To get some insights into these questions, Google evaluated the top 10 brands (based on total ad minutes) that aired ads during the live broadcast of the opening ceremonies. The analysis is based on a combination of consumer surveys and second-screen (mobile, desktop, and tablet) response data. Presented in a live Google Data Studio dashboard, the result is a unique view into the full-funnel performance of the ads evaluated.

Awareness

Commercials during large, live sporting events like the Olympics are often uniquely created to leverage both the scale of the audience and the context of the event. Whether it is telling the personal story of an athlete or playing to our passions like patriotism, they are intended to strike an emotional connection, entertain us, or make us stand up and take notice.

Coca Cola was the big winner with almost 35% of respondents having remembered seeing the ad when prompted—a result that outpaces typical recall rates in the 20%-25% range. Not a surprising result from a top CPG brand. Samsung, Chevy, United, and Visa rounded out the top five with respectable recall rates.
TV Ad Awareness Metrics
35% of respondents remembered seeing the Coca Cola ad.
Additionally, of those respondents recalling the ad, only 40% could recall the specific product or service featured in the ad. The net is that only about 8% of viewers can recall both the brand and product in a specific advertisement. For many of the ads this was the first airing and it is reasonable to expect these numbers to improve substantially with increased exposure over the next couple of weeks.

Interest

Advertisers also want the ad to shift perceptions and create interest in the product or service featured. By surveying both viewers who saw the ad (exposed) and those who did not (unexposed), we are able to get insights into the impact of each ad’s messaging and creative. Overall, the results were impressive. On average, respondents who saw the ads were 18% more positive about the associated brands than those who did not. Likewise, respondents who saw the ads were 16% more likely to find out more and/or purchase the product being advertised.
TV Ad Interest Metrics
Consumers who saw the ads were 18% more positive about the brand and were 16% more likely to find out more or purchase the product in the ad.
Interestingly, the baseline favorability and purchase intentions for both non-sponsors and Olympic sponsors are relatively equal. And for the most part, the ad’s impact on both factors was the same across non-sponsors and sponsors.

Desire

These commercials don’t just make us laugh or make us feel better about the brand—they also make us search and visit websites. Second-screen searching—whether it’s to re-engage with the ad or to learn more about the product—is a powerful indication of desire. By measuring incremental search queries on Google and YouTube during the broadcast that are specific and modeled to be attributable to ads shown, we are now able to include responses in our analysis. During the opening ceremonies, TV ad driven searches were almost exclusively on mobile—94% compared to an average of 56% for those brands when the ads were not airing. For brands, that means a presence on the TV screen isn’t complete without a strategy for small screens, as well.
"94% of searches on Google and YouTube as a result of seeing the ads occurred on mobile devices."
McDonald’s took the top spot on the podium with 42% more searches than the average. BMW and Samsung fought it out for second and third with 14% and 12% respectively. The answer to the question “Do emotional and inspiring ads work?” is, in this instance, “Yes.” But so do product-featured ads. Both inspiring and product ad creatives drove 10% more searches on average. Also, ads by sponsors drove 14% more searches than their non-sponsor counterparts.
TV Ad Response Metrics
Compared to the average of the top 10 ads studied, McDonald’s drove 42% more searches.
Finally, the Samsung Galaxy Note 7 ad was the overall winner with strong full-funnel performance placing in the top three across all three funnel stages. Whether people are tuning into the Olympics or their favorite TV show, they use their smartphones to search for information triggered by what they’re seeing. That means if you advertise on TV, you can now get a new view of performance across each stage of the funnel—using a combination of consumer surveys and digital response, all in a matter of days. Armed with these new insights, advertisers are now able to better understand and improve the performance of these investments in concert with their digital media.

Sourcing

Using Google Consumer Surveys to provide consumer ad awareness and interest research, an online survey was conducted in the United States during the period 8/6 - 8/9/16 using a validated, representative sample with a minimum of 750 respondents. Response data is based on incremental TV ad-driven search queries (Google and YouTube) during the course of the broadcast that are specific to the ad shown and are modeled by Google Attribution 360 to be attributable to the airings of the commercials. Response data is normalized for total commercial air time during the broadcast for each advertiser and indexed to the average.

Happy Analyzing,

Spotlight on Attribution 360, part of the Google Analytics 360 Suite

Your marketing strategy isn’t single channel so why should your measurement practices be? 

Looking at marketing performance one channel at a time no longer makes sense. In today’s complex, micro-moment, cross-screen landscape, the lines between marketing efforts are blurred. Traditional marketing and digital marketing overlap, with investments online delivering results offline, and vice versa. Cross-channel marketers have an opportunity to shift away from channel-by-channel thinking to better understand how to optimize their entire marketing strategy.

Google Attribution 360 allows you to measure and optimize marketing spend for all channels, online and off, at once. Use it to uncover insights, make a true impact on the customer journey, and improve ROI.


The Digital Attribution, Marketing Mix Modeling, and TV Attribution capabilities within Attribution 360 allow you to analyze all your available data streams and create a highly accurate model of your full marketing efforts.

  • Digital Attribution helps you combine and interpret siloed data sources, apply data-driven attribution modeling, and optimize your digital marketing mix. Rather than using a limited first-touch, last-touch, or arbitrary rules-based model, Digital Attribution awards the appropriate credit to each and every touchpoint on the customer journey. 
  • Marketing Mix Modeling adds a top-down, aggregated view of performance across all channels, including media such as radio, television, print, out-of-home, and digital. You’ll also get insights into how external factors such as economic conditions, seasonality, and competitive actions impact your marketing efforts. 
  • TV Attribution helps business relying on TV to build awareness and demand to integrate digital and broadcast data and understand their cross-channel performance. Down-to-the-minute TV ad airings data is analyzed alongside digital site and search data to reveal the attributable impact of specific broadcast ad placements. 
Here’s how one of our customers, Open Colleges, uses Attribution 360 to make the connection between TV and digital advertising.

Google Attribution 360 helps Open Colleges see how TV ads turn into online leads 

Open Colleges, Australia’s leader in online learning, felt television advertising could be a powerful tool to reach its audience, but in a data-driven and lead-driven culture they found it difficult to measure and justify the actual impact of TV ads. They wanted to see how TV ads translated into real leads, understand the cross-channel customer journey, and find new opportunities in their marketing mix. That’s when they turned to Google Attribution 360.

For three months in 2015, the team tested Attribution 360 with a series of TV campaigns focused on their key user base of women aged 25-54 who are looking to enhance or change their careers. They ran ads on a variety of TV programming — cooking shows, series, soap operas, and news and morning shows.


Getting results 

With Attribution 360, the Open Colleges team could see clearly what was engaging TV viewers and driving them to search. While news and morning shows delivered larger impression volume, light entertainment shows like Ellen and Grey’s Anatomy had higher impact on leads. Open Colleges also learned that while Saturday was their most engaged day, Monday and Tuesday spots were more cost-efficient by an average of 12%.

“We gained insights into day-parting, 15-second versus 30-second spots, and campaign flighting — just a level of insights we’ve never had before,” says Matt Hill, Head of Brand & Communication for Open Colleges.

They also learned that dual-screen TV viewers were far more engaged on mobile than on desktop, and far more engaged on smartphones than on tablets.

“People sitting on the couch who see a TV ad, they’re not going to run and get their laptop,” notes Hill. “They pull out their phone and search for us right there.” In prime time (6-10pm), for example, 81% of attributed visits were from mobile.

Making adjustments 

As results came in, the Open Colleges team made adjustments to campaigns, ad buys and creatives to capitalize on what they learned. The realized they had to make sure their online ads were at or near top position for web searches using keywords like online courses any time their TV ads were driving response. “Your search bidding strategy has to be aligned with your TV activity,” says Hill. “If your TV ad drives a mobile user to search for online education and you aren’t there, you won’t make the most of your investment.”

In the first three months, Open Colleges saw a significant uplift with its key target audience of women aged 25–54. As a result, the team is now testing many new approaches, like targeting smaller audiences in Western Australia, trying programming alternatives at off-peak hours, and exploring the hours where 15-second ads get the best ROI.

“Traditional metrics just don’t cut it anymore,” says Hill. “You need to understand what your marketing dollars are doing for you in detail, and TV attribution has given us the visibility and confidence that TV does deliver against hard business metrics. If you’re serious about understanding the pathways to conversion and the full impact of your offline spend for maximum ROI, Attribution 360 is a must.”

Read the full case study with Open Colleges for more details.

Stay tuned for more updates on Attribution 360 as we continue to invest in new and exciting capabilities.