Tag Archives: Advanced Topics

Get Facebook, Bing, Twitter & more into Google Data Studio

Google Data Studio is the biggest step forward in Google’s data reporting & visualization offering since the launch of Google Analytics in 2005. It lets you build great-looking, interactive dashboards that you can share in a similar manner as Google Drive files (see for example this web analytics dashboard). It's a giant leap forward from the old Google Analytics dashboards and a game changer for online marketers.

Google Data Studio provides native integration with a few Google platforms (Google Analytics, AdWords, YouTube, BigQuery, Attribution 360). Of course, most marketers, to use Google Data Studio as their primary dashboarding tool, would like to include data from many more sources, such as Facebook Ads, Bing Ads and Twitter Ads.

Fortunately, there’s a really simple method for adding many more data sources into Google Data Studio, using its Google Sheets connector. Here’s a quick step-by-step guide for doing that.

1. Create a Google Sheet with data to be imported 
There are a number of ways to do this. For instance, to get Facebook Ads data, you can go to Facebook Ads Manager to do a CSV export of your data, and then upload it to Google Drive. For some data sources, you can use spreadsheet functions like IMPORTXML. Or you can build your own Google Apps Script connectors.

For a fully automated data importing workflow, I recommend you try our Supermetrics add-on for Google Sheets (available here; free for 30 days, then $49/mo). It has an easy-to-use query builder and connects to a large number of data sources, like Facebook, Bing, Twitter, MailChimp, even Adobe SiteCatalyst.

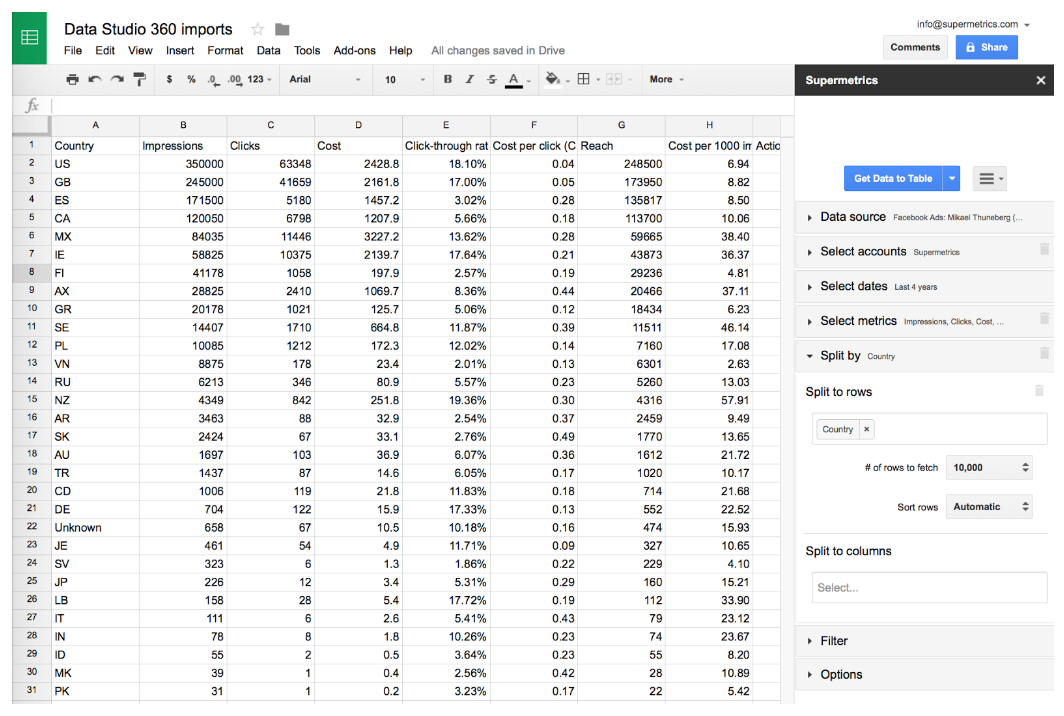
To run a simple query using Supermetrics:

  1. Launch Supermetrics from the Add-ons menu 
  2. Log in to a data source (eg. Facebook Ads) 
  3. Pick a few metrics (eg. impressions and cost) 
  4. Split to rows by one or more dimensions (eg. country) 
  5. Click the blue Get Data to Table button 
After you’ve fetched the data, your Google Sheet should look something like this (here we’re splitting by country):


If you don’t want to test Supermetrics now, you can make a copy of this sheet to try out the following steps.

2. Import the data into Google Data Studio
You can launch Google Data Studio here. If you haven’t yet used Data Studio, you can get the free version here (US only for the time being). 

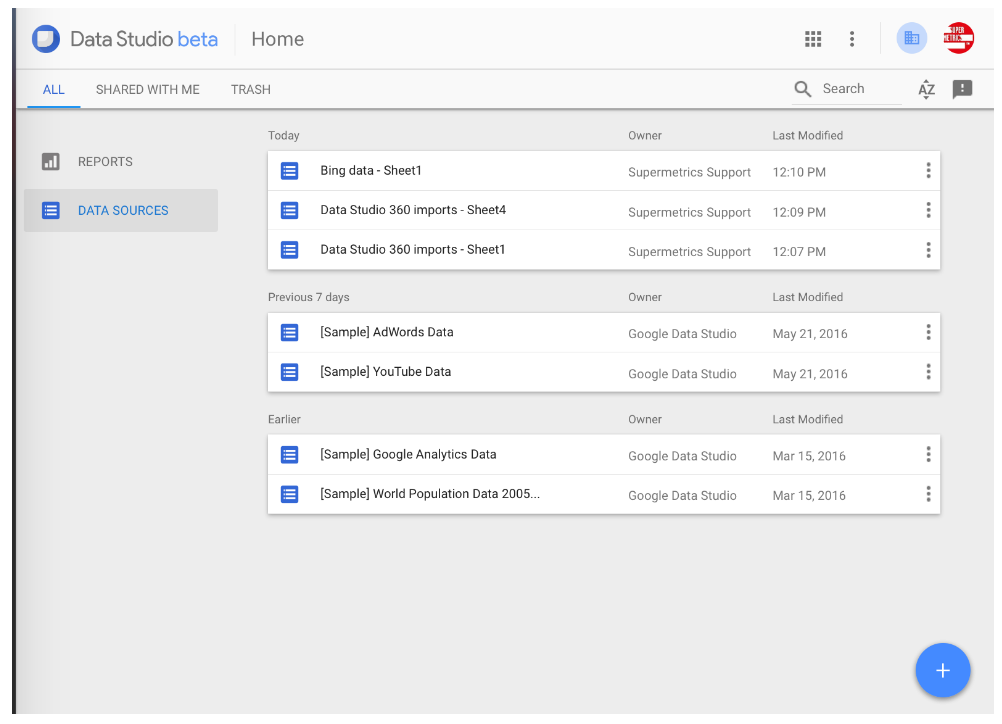
In DATA SOURCES, click the plus button in the lower-right corner:

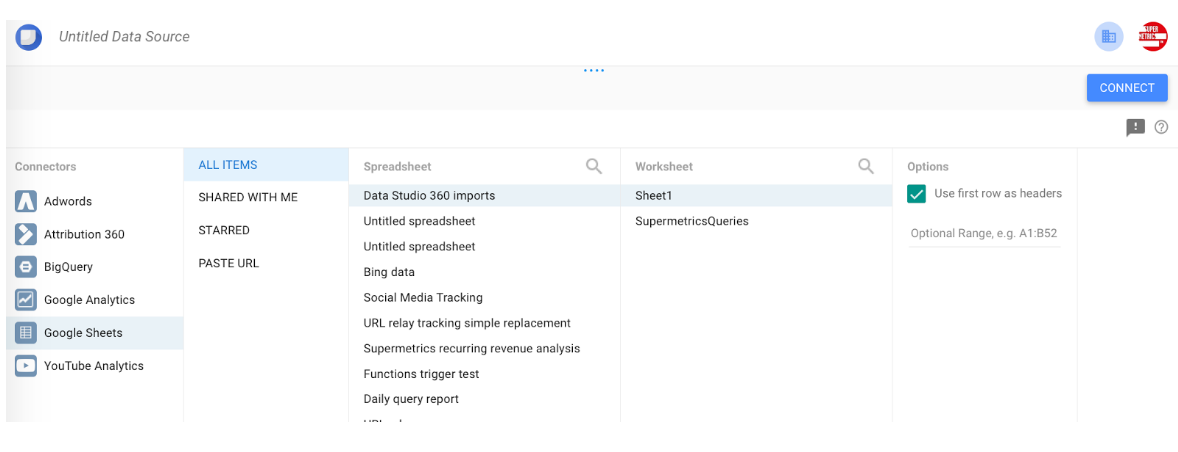
From connectors, select Google Sheets and the file you just created, then click CONNECT


Next, Google shows you a list of fields imported from the Google Sheet. Click CREATE REPORT, and in the next window, ADD TO REPORT.

3. Using the data 
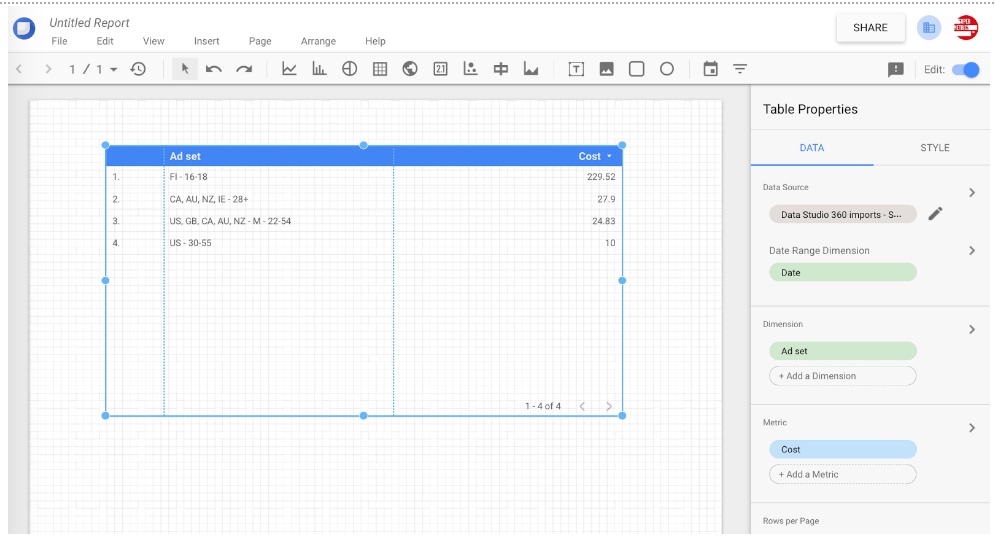
You now have a blank report where you can start working with the data. To check everything has been imported ok, try inserting a table. You can change the columns displayed in the Table Properties sidebar.


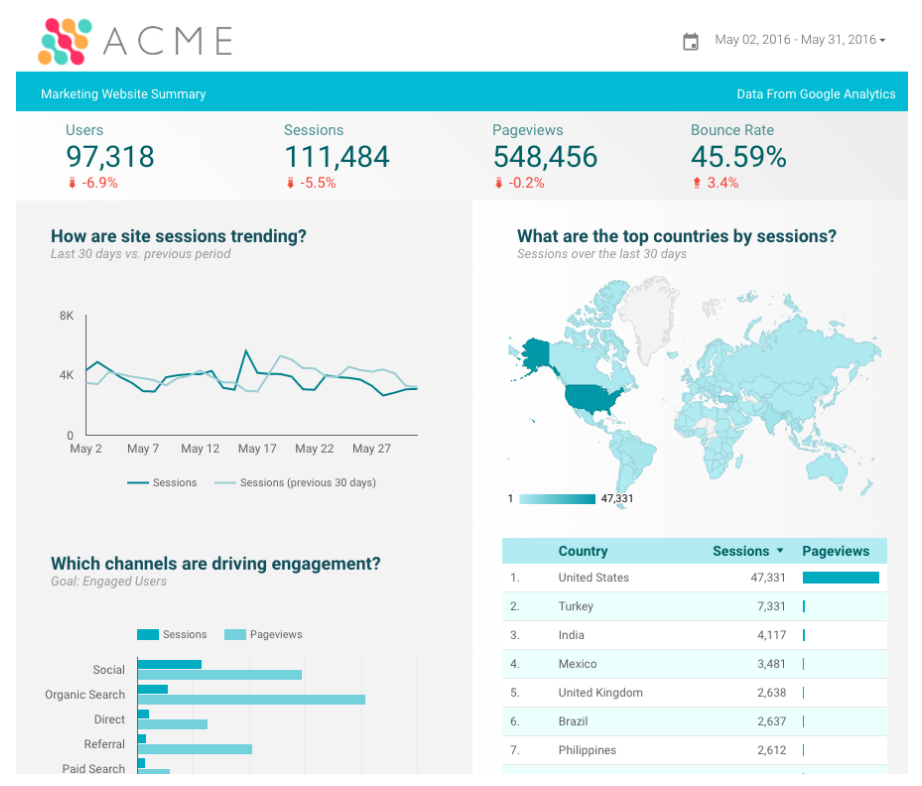
You can then start building your report. After some trying, you’ll be able to make something great like this:


In many cases, you will want to include more than one Google Sheets data connector, to fetch data from different sources or with different metrics & dimensions. This can be done very easily, just repeat step 1 and 2. Go back to Google Sheets to fetch new data, e.g. Twitter Ads, to another sheet. Then in Data Studio, when adding a graph or table, in the properties sidebar press the arrow next to Data Source to add a connection to the new sheet.

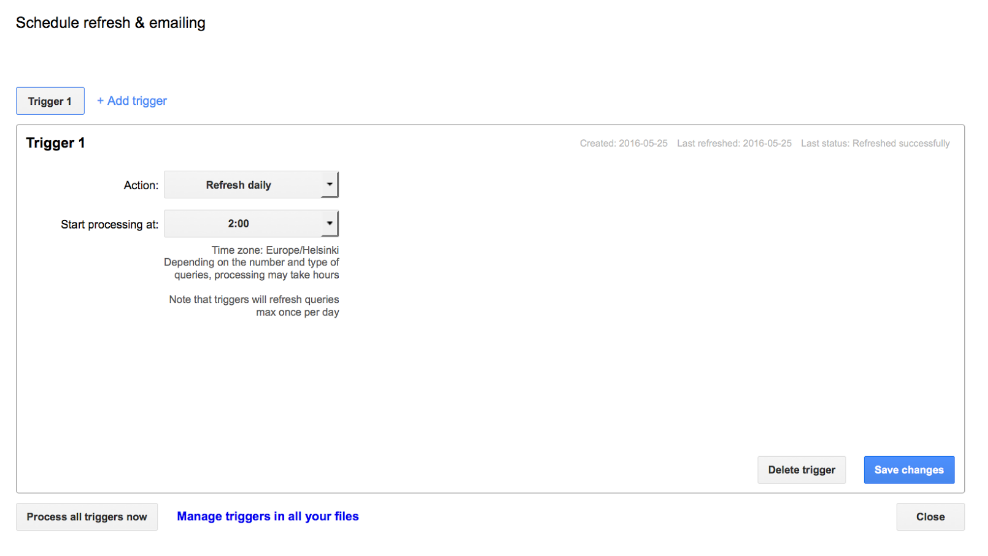
4. Ensure your reports stay up-to-date
If you used the Supermetrics add-on to fetch data into Google Sheets, you can set the those queries to refresh automatically every day, so your Data Studio report will always have the latest data. In Google Sheets, go to Add-ons: Supermetrics: Schedule refresh & emailing, and store a daily refresh trigger.

Final thoughts 
Google Data Studio is a powerful dashboarding tool for any marketer, but by default only works with Google platforms. To make the most of it, use its Google Sheets connector in combination with the Supermetrics Google Sheets add-on to build cross-channel reports.

Posted by Mikael Thuneberg, Google Analytics Certified Partner

Introducing Autotrack for analytics.js


The web has changed a lot since the early days of Google Analytics. Back then, most websites actually consisted of individual pages, and moving from one page to the next involved clicking a link and making a full-page request. With sites like this, it's possible to track the majority of relevant user interactions with a single, one-size-fits-all JavaScript tracking snippet.

But the web of today is much more complex and varied than it used to be. In addition to traditional, static websites, we have full-featured web applications. User interactions aren't limited to clicking links and submitting forms, and a "pageview" doesn't always mean a full-page load.

The web has changed, but analytics implementations have stayed pretty much the same. Most Google Analytics users copy and paste the default tracking snippet and that's it. They know there's more they can do with Google Analytics, but taking the time to learn is often not a priority.

Autotrack for analytics.js is a new solution to this problem. It attempts to leverage as many Google Analytics features as possible while requiring minimal manual implementation. It gives developers a foundation for tracking data relevant to today's modern web.

Features


The autotrack library is built as a collection of analytics.js plugins, making it easy to use the entire library as-is or to pick and choose just the plugins you need. The next few sections describe some of the features autotrack enables.

Outbound link and form tracking

When a user clicks a link that points to another page on a site, that other page typically sends a pageview hit once the user arrives. Because there's a series of pageviews, Google Analytics can figure out on the back end where the user navigated to (and from). But if a user clicks a link or submits a form to an external domain, that action is not captured unless you specifically tell Google Analytics what happened.

Historically, outbound link and form tracking has been tricky to implement because most browsers stop executing JavaScript on the current page once a new page starts to load. Autotrack handles these complications for you, so you get outbound link and form tracking for free.

URL change tracking for single page applications

If you're building a single page application that dynamically loads content and updates the URL using the History API, the default tracking snippet will not suffice -- it only tracks the initial page load. Even if you're sending additional pageviews after successfully loading new content, there can still be complications.

Autotrack automatically detects URL changes made via the History API and tracks those as pageviews. It also keeps the tracker in sync with the updated URL so all subsequent hits (events, social interactions, etc.) are associated with the correct URL.

Declarative event tracking

Sometimes it's easier to declaratively add an event to the HTML than to manually write an event listener in JavaScript. Tracking simple click events is a prime example of this. To track click events with autotrack, you just add data attributes to your markup.

<button data-event-category="Video" data-event-action="play">Play</button>

When a user clicks on the above button, an event with the corresponding category and action (and, optionally, label and value) is sent to Google Analytics.

Media query tracking

Most sites today use responsive design to update the page layout based on the screen size or capabilities of the user's device. If media queries are used to alter the look or functionality of a page, it's important to capture that information to better understand how usage differs when different media queries are active.

Autotrack allows you to register the set of media query values you're using, and those values are automatically tracked via custom dimensions. It also tracks when those values change. (Note that media query tracking requires you to set up custom dimensions in Google Analytics. The process only takes a few minutes, and the instructions are explained in the mediaQueryTracker plugin documentation.)

These are just a few of the features you can enable when using Autotrack. For a complete list of all plugins and instructions on how to use them, refer to the Autotrack documentation on Github.

Who should use autotrack?


While anyone could use and benefit from autotrack, the library is primarily geared toward sites that do not customize their current analytics implementation and would like to take advantage of the features described in this article.

If you're just using the default tracking snippet today, you should consider using autotrack. If you already have a custom implementation of Google Analytics, you should first check the documentation to make sure none of the autotrack features will conflict and no data will be double-counted.

Next steps


To get started using autotrack, check out the usage section of the documentation. If you're curious to see what the data captured by autotrack looks like, the Google Analytics Demos & Tools site uses autotrack and has a page with charts showing the site's own Google Analytics data.

If you want to go deeper, the autotrack library is open source and can be a great learning resource. Have a read through the plugin source code to get a better understanding of how many of the advanced analytics.js features work.

Lastly, if you have feedback or suggestions, please let us know. You can report bugs or submit any issues on Github.

By: Philip Walton, Developer Programs Engineer

How To Setup Enhanced Ecommerce Impressions Using Scroll Tracking

A version of this post originally appeared on Google Analytics Certified Partner InfoTrust's site.
by Nate Denlinger, Web Developer at GACP InfoTrust, LLC

One of our specialities here at InfoTrust is helping ecommerce businesses leverage their web analytics to make better data-driven marketing decisions. This typically starts with installing Google’s Universal Analytics web analytics software and utilizing all of the functionality that is offered with Enhanced Ecommerce tracking capabilities.
Enhanced Ecommerce provides you with a complete picture of what customers on your site are seeing, interacting with and purchasing.
One of the ways you track what your customers are seeing is with product impressions (whenever a user sees an image or description of your products on your website).
Normally, you track what products users see or impressions by simply adding an array of product objects to the DataLayer. These represent the products seen on the page, meaning when any page loads with product images/descriptions, data is sent to Google Analytics that a user saw those specific products. This works well.
However, there is a major issue with this method.  Sometimes you are sending impressions for products that the user never actually sees. This can happen when your page scrolls vertically and some products are off the page or “below the fold”.
For example, lets take a look at a page on Etsy.com:
Sample page on Etsy.com (click for full size)
Here are the results for the search term “Linens”. Currently, you can see sixteen products listed in the search results.  However, in the normal method of sending product impressions, a product impression would be sent for every product on the page.
So, in reality this is what we are telling Google Analytics that the user is seeing (every single product on the page):
Sample page of Etsy.com (click for full-size)

Obviously, no one's screen looks like this, but by sending all products as an impression, we are effectively saying that our customer saw all 63 products. What happens if the user never scrolls past the 16 products shown in the first screenshot?
We are greatly skewing the impressions for the products on the bottom of the page, because often times, users are not scrolling the entire length of the page (and therefore not seeing the additional products).
This could cause you to make incorrect assumptions about how well a product is selling based off of position.
The solution: Scroll-based impression tracking!
Here is how it works at a high level:
  1. Instead of automatically adding all product impressions to the DataLayer, we add it to another variable just for temporary storage. Meaning, we do not send all the products loaded on a page directly to Google Analytics, but rather just identify the products that loaded on the page.
  2. When the page loads, we actually see what products are visible on the page (ones “above the fold” or where the user can actually see them) and add only those products to the DataLayer for product impressions. Now we don’t send any other product impressions unless they are actually visible to the user.
  3. Once the user starts to scroll, we start capturing all the products that haven’t been seen before. We continue to capture these products until the user stops scrolling for a certain amount of time.
  4. We then batch all of those products together and send them to the DataLayer as product impressions. 
  5. If the user starts to scroll again, we start checking again. However, we never send the same product twice on the same page. If they scroll to the bottom then back up, we don’t send the first products twice.
Using our example on the “Linen” search results, right away we would send product impressions for the first 16 products. Then, let’s say the user scrolled halfway down the page and stopped. We would then send product impressions for products 18 through 40. The user then scrolls to the bottom of the page so we would send product impressions for 41 through 63. Finally the user scrolls back to the top of the page before clicking on the first product. No more impressions would be sent as impressions for all products have already been sent.
The result: Product impressions are only sent as users actually navigate through the pages and can see the products. This is a much more accurate form of product impression tracking since it reflects actual user navigation. 
Next steps: for the technical how-to guide + code samples, please see this post on the InfoTrust site.

Boost Conversions by Infusing Google Remarketing with Marketo Real-Time Personalization

Personalization is a hot topic for today’s marketers, a group that spends nearly half of their budget attracting new prospects. But customer expectations have risen; content must be relevant to acquire new customers and move them to convert.

Some pioneering marketers are seeing better performance by using real-time personalization and remarketing simultaneously. Knowing who a customer is and what they do is a big step toward providing the hyper-relevant content that customers crave.

Join Marketo’s Mike Telem and Mike Tomita on January 15th at 10am PT/ 1pm ET as they discuss the importance of real-time personalization for marketing results. Google’s own Dan Stone will give an overview of the ways Google Analytics technology can be used to power advanced remarketing, while the Marketo team will share the ways their company uses real-time personalization and Google Analytics to generate more leads at a lower cost.

Looking for tips on how to get your organization started? Reserve your spot today!


Refreshing “The Customer Journey to Online Purchase” – New Insights into Marketing Channels

Last year we introduced “The Customer Journey to Online Purchase” -- a tool that helped marketers visualize the roles played by marketing channels like paid search, email and display ads in their customers' journeys.

The goal was to help marketers learn more about the customer journeys for their industries. If social makes your customers aware, and email makes them convert -- or vice versa -- you can make sure you're in both places with the right kind of message.

Today we're happy to introduce a new improved version of the Customer Journey to Online Purchase, with a few key enhancements.  We’ve refreshed the data based on millions of consumer interactions, updated the industry classifications, and we’ve split out paid search so you can see the influence of brand and generic search terms on the purchase decision.

In each industry you can now see journeys for small, medium and large companies, which can often be quite different.
Click to enlarge image
For instance, the above image shows the journey for customers of small businesses in the shopping industry. Note that organic search is very often an "assist" interaction for these customers.
Click to enlarge image
Now here's the same journey for large shopping businesses. Note that display clicks and social are strongly assisting interactions -- while display didn’t even appear for the small businesses above. For both small and large businesses, a direct website visit is most likely to be the last interaction. Across industries, the differences from small to large businesses illustrate how different marketing strategies and customer profiles may lead to different buying behavior.

And there's more! Now you can drill down into each marketing channel for a closer look at the role it plays based on its position in the purchase path. Channels that occur more frequently in the beginning of the path are more likely to help generate awareness for your product, while the end of the path is closer to the customer’s purchase decision.
Click to enlarge image
In these charts, for example, we see the different roles that different channels play in the Shopping industry. One interesting insight is that all channels -- even those traditionally thought of as “upper funnel” or “lower funnel” -- occur throughout the purchase path, but a given channel may be more common at particular stages depending on its role (and depending on the industry).

Each marketing campaign and channel may have a different impact on customers depending on when they interact with it. Using what you learn from this tool, you can help adapt your marketing messaging to be more relevant and useful for your customers.

Try the Customer Journey to Online Purchase today. And for more helpful marketing insights, check out Measure What Matters Most: our new guide chock-full of suggestions on how to measure the impact of your marketing -- across channels -- to complement what you learn from the Customer Journey tool and take action to improve your marketing.

Happy analyzing!


Avvo Gains New Insights with Data Import

Companies use many systems to run their business. These may include multiple web advertising networks, CRM and content publishing systems, point of sale systems, inventory databases, etc. Integrating the data from these systems with Google Analytics provides a better understanding for how your customers behave on the web. 

At the 2014 Analytics Summit we announced the new Data Import. Data Import helps unify data from your different business systems, allowing you to organize your data the same way your business is organized. This will allow for more accurate analysis and bringing together previously disparate datasets into one complete picture. Using Data Import, you can upload your brand’s existing data into Google Analytics and join it with GA data for reporting, segmentation and remarketing.

By using the Data Import functionality in Google Analytics Premium, consumer legal services brand Avvo created clear, accurate data, which continues to impact decisions across their organization. While Avvo already had a successful and fast-growing business, the lack of visibility into advertising success made it hard to align key revenue opportunities with actual site usage. Read the full case study here.


“We’ve been very pleased with the results that were realized using Data Import in Google Analytics to analyze client behavior on our website. This exercise has given us better insight into valuable data that will ultimately impact how we segment the market for legal services.” 
- Sendi Widjaja, Co-Founder & CTO, Avvo, Inc.

Data Import also now supports a new Query Time mode that allows you to join your data with historical GA data. With this mode you can:
  • Enhance existing, already processed GA data with imported dimensions and metrics.
  • Upload calculated values after a transaction occurs, like total customer spend, last transaction date, or a loyalty score.
  • Correct any errors in data you have uploaded to GA in the past.
Query Time mode is currently in whitelist release for Premium users. For more information, contact your Premium account manager. You can learn more about Premium here.

Illustration of a new Google Analytics report with data from multiple sources 

We are also introducing a new version of Cost Data import that provides more versatile support for importing historical data. Additionally, cost data  can now be uploaded directly  through the Google Analytics web interface (previously, data import  required using the GA API). Note: Users of the original cost data import  must migrate to the new version. Details can be found in the cost data migration guide.

How to get started using Data Import
For more information, read Data Import on the Google Analytics Help Center. Also check our new developer Data Import guides that will get you up and running in no time. Some features are currently not rolled out to all users. If you’d like to join the beta for full-access, sign-up here.

Posted by Nick Mihailovski, Jieyan Fan, Richard Maher, Rick Elliott and the Google Analytics Team 

Tailored ads, better results: Dynamic Remarketing powered by Google Analytics

Back in August, 2012, we launched Remarketing with Google Analytics, which enabled advertisers to create sophisticated remarketing lists using Google Analytics’ 250+ dimensions and metrics. 
Today, we’re excited to announce a deeper remarketing integration between AdWords and Google Analytics. 

A single set of tags can now power both Google Analytics and Dynamic Remarketing on the Google Display Network using the Google Merchant Center. Retailers (with other verticals in beta) will gain power and precision for their remarketing along with access to detailed product level reporting through this integration.


What is Dynamic Remarketing?
[original article here]

Every customer is unique. Dynamic remarketing takes this into account, letting you create and deliver beautiful customized ads that connect visitors with their past shopping experiences on your site. If you’re a retailer with a Google Merchant Center account, you can use dynamic remarketing to construct remarketing ads on the fly with the products and messages that are predicted to perform best based on visitors’ past actions on your site.
For example: Customers who browsed the winter tires category on an advertiser’s website might see an ad that includes the exact products they’ve already viewed, in addition to related products from the company’s catalog. In the Tirendo example above, the ad also shows details of recently viewed tires, including the prices.
Early users are seeing great results

"We've been thrilled with the performance of Dynamic Remarketing with Google Analytics and Conversion Optimizer, which has so far driven a 203% increase in conversions and 100% increase in conversion rates vs. our display average. Combined with Google Analytics' powerful reporting on these same metrics, we've been able to derive actionable insights which we've put to good use throughout our other campaigns."
- Janina Rix, SEA Manager, tirendo.de

To begin using Dynamic Remarketing

  1. Create one or more remarketing lists using Google Analytics
  2. Update your tags to track Product ID, Cart Value, and Page Type as custom variables (or dimensions)
  3. Enable the Dynamic Link in Admin > Property > Dynamic Attributes. This will let Google Analytics send attributes to your AdWords account. [more below]
  4. Create a Dynamic Remarketing Display campaign in AdWords

    Here’s a quick visual guide to the new interface.

    Step 1: Configure account details


    Step 2: Make sure the attribute names match your custom variables


    Step 3: Click ‘Save’ and finish by creating your first Dynamic Remarketing campaign in AdWords


    Want more help? Download a remarketing starter pack from the solutions gallery. 

    Please stay tuned for more remarketing-related updates in the near future!

    Happy Analyzing, Dan Stone and Lan Huang on behalf of the Google Analytics Team

    Ensuring Data Accuracy with a Tag Management Policy

    The following is a guest post from GACP Michael Loban, CMO at InfoTrust.

    The quality of the website analytics data we have is directly related to the tag management processes adopted by an organization. Most likely, you can remember days when the following incidents may have occurred:
    1. You find that one (or several) of the pages on your site is missing Google Analytics, or some pages had Google Analytics deployed twice causing duplicate pageviews and inflating traffic.
    2. Google Analytics custom variables were inconsistent or missing on some portions of the site, leading to data quality issues.
    3. An unauthorized marketing tag was piggybacking off of another tag.
    4. One of the tags on an international site you managed did not follow the new EU Cookie Laws related to privacy.
    Adopting a Tag Management System like Google Tag Manager is a great way to go, but having a great tool to organize and deploy your tags is often not enough. You still need a system, a process, and ongoing review. Here are the steps for creating a tag management policy for your company:

    1. Know where you are – what tags are currently firing, where and how? Whether you have a small site with a few hundred pages or an international publication with thousands of pages, it is important to assess your current tag deployment. 

    Can you say, with 100% confidence, that your analytics tag are located on every page?  Are you sure the cookies set by your analytics tag/tool are accurate and not over-writing each other?

    Regardless of whether you are confident or not, I suggest using a tool like TagInspector.com (Tag Inspector is an InfoTrust product). It will help you locate:
    1. All the tags on your site, split up by specific pages’ tags, and even pages they are missing from.
    2. Cookies set by various tags and what pages they are set on.
    3. How the tag is deployed – through a tag management system or directly from a page source.
    4. Instances of tag piggybacking – one tag being loaded by another tag.
    Here is a screenshot from an example scan. It shows how tags load (commonly referred to as tag hierarchy). We have removed the website URL, but as you can see there are instances when Google Analytics is being loaded by the TMS, and instances where Google Analytics is being loaded directly from the source of the page. 


    2. Document all approved tags. The average enterprise website might have 25-50 marketing tags. Not all of them have to be present across all pages. However, even if you are considering moving to a Tag Management System, or already are using one, it is not a bad idea to have the following documented and categorized:
    1. Tag name and functionality
    2. Pages or the category pages the tag needs to be on
    3. Information collected through the tag about visitors (cookies set)
    4. Firing rules

    Check out Tagopedia – a wiki of tags to learn more about the many different types of tags.

    3. Consider the implementation of a Tag Management System. There is a reason this is step three, and not step one or two. A lot of companies jump to this step first, thinking that a new technology will miraculously make all tagging issues disappear. The first step in moving to a TMS is knowing what tags you need to keep, and where they are or how they are loaded on your site so you can remove them from the source after the tag management system is deployed.

    When considering the implementation of a tag management system, think about your team. Every website of a TMS vendor says you will no longer need your IT team to make changes to the tags thus simplifying and expediting the process. I have met plenty of marketers who do not want anything to do with a TMS. Even though you will free up your IT resources, you will still need a person or team with the technical training to manage your tags. 

    Naturally, your first step in evaluating Tag Management vendors should be outlining what features you really need. Google Tag Manager is free, and is one of the few TMS systems that works for both mobile websites and native mobile applications. 

    NOTE:  If you do decide to migrate to a TMS or if you have already done so, you still should scan all the pages across your site to ensure that your tags fire correctly, such as, once per page for analytics tags – and only from your TMS. You certainly want to avoid having a tag in the source of your page and inside a TMS – this will inflate your data and cause data quality issues.

    4. Run ongoing site audits to ensure correct tags are deployed across correct pages. Ideally, this will only serve as the insurance. However, ongoing site scans or audits can help you avoid the moments when you realize you did not capture AdWords conversions because your GA or AdWords conversion tag was removed from the conversion page. Keep in mind certain tags might only fire when a user looks at your website on a mobile device, and your scan might need to simulate different user agents.  Doing this manually for all the sites you manage, or across one very large site, can be quite challenging. Again, TagInspector.com can help speed up this process and dramatically reduce the effort required. Here is an example screenshot of the scanning options:


    5. Think ahead – will you be able to innovate? Complete lock down is in nobody’s best interests. What happens if there is a new platform for A/B testing that you would like to try? How long will it take you to get the tag approved, implemented on your site, verify its performance, and launch a campaign? Keep innovation in mind and make it relatively easy for marketers in your company to adopt new technologies.

    One way to go about this is having an application that needs to be completed and approved prior to implementing a new tag. This will help you ensure only tags that meet company standards are implemented on your site. 

    At the end of the day, tag deployment and data collection will only get more complex. If you do not have any process for managing your tags, it is time to start. If you have some kind of process, perhaps it is time for optimization. Get all the stakeholders in the room, and decide who will be your tag management team, and what the first step will be to ensure tag accuracy. You can’t do analysis if the data isn’t accurate. And your data won’t be accurate if your marketing tags aren’t implemented correctly. 

    If you would like to learn more about implementing a tag management policy, we would like to invite you to attend a free webinar on March 26th at 1:00PM EST where we will discus items outlined in this post, and a lot more. 

    Posted by Michael Loban, CMO at Google Analytics Certified Partner InfoTrust

    Richer Insights For B2B Marketing With Google Analytics

    The following is a guest post from Google Analytics Certified Partner Feras Alhlou, Partner & Principal Consultant at E-Nor Inc.
    Marketers and sales professionals want to know who’s visiting their site, what content the target audience is consuming and what converts site visitors to paying customers. 
    In a B2B environment -- where long sales cycles and multiple stakeholders affect sales decision -- “knowing who’s coming to your site” takes on another dimension. 
    Say you’re in charge of marketing an eLearning system, and your target market includes telecom, hi-tech/software companies and universities. Your sales cycle could span several months, and there are multiple personas/stakeholders who will evaluate your company and your product. 
    Some key personas include:
    • Trainers, professors and teachers evaluating user experience and ease of uploading curricula and content 
    • Management/administrators evaluating your company, pricing, client testimonials, case studies, etc.
    • IT assessing technical aspects of products, maintainability, your technical support processes, etc. 
    As a marketer, your job is to ensure your site addresses the needs of each stakeholder, while realizing that the interests/questions each group of stakeholders are likely to be different. It’s critical that the message and content (that you invested so much in creating) “sticks” with the unique personas in each market segment. 
    Easier said than done; measuring and optimizing all the above isn’t for the faint of heart.
    But don’t fret. Integrating Google Analytics with Account-Based Marketing and Firmographic data has come to the rescue. 
    B2B Measurement Framework
    Let’s walk through a typical scenario and highlight key performance indicators (KPIs). The measurement framework our eLearning marketing manager has in mind includes (and yes, they follow GA’s ABC!):
    Acquisition
      1. What percent of my traffic comes from industries I target
        1. Telecom
        2. Hi-tech/software companies
        3. .edu’s
      2. Percentage increase or decrease in traffic from industries I’m not targeting 
      3. Traffic volume and frequency from organizations our sales team targets offline
    Behavior
      1. Landing page stickiness by industry and organization
      2. What content is very popular
      3. What content is most shared
      4. All the above segmented by the three targeted industries
    Conversion
      1. Number of whitepaper downloads by industry and company
      2. Number of demo requests
      3. Sales follow-up call requests 
      4. All the above segmented by the three targeted industries
    If your site visitors aren’t providing you with company and industry data, it’s not possible to report on this data in Google Analytics. Hello Insightera, a marketing personalization platform, enables your to enrich customer’s onsite journey with firmographic data in a seamless integrated fashion (note, another product in the Google Analytics app gallery offering similar functionality is Demandbase).
    Rich Firmographic Data in Google Analytics
    Insightera’s firmographic data is organized by 1) deriving information from site visitors by identifying their ISP 2) determining that organization’s information, including location, industry (and soon company size and company revenue will also be available). 
    With easy-to-navigate firmographic readily available, analytics data takes on a new dimension; advertising dollars can be better targeted, and you have the ability to customize a visitor’s experience in several new ways.
    Here’s a few examples of the rich and super cool data you have access to with Insightera, nicely integrated in the Google Analytics Reports (in Custom Variables):
    1- Traffic Distribution by Industry  
    Within the GA interface you have a nice presentation your traffic by industry. Telecom seems to be strong (24.1% of traffic) in the report below, while Education could use some love from your marketing team. 

    2- Engagement By Industry
    You can also report on your KPIs by industry (e.g. see how “Education” is the number 2 industry in the report below)

    3- Traffic & Engagement By Organization
    This report below shows the platform’s ability to take data segmentation a step further, and highlights specific organizations within the industry visiting the website (e.g. Yale University)

    With firmographic data integrated into Google Analytics, it is possible to optimize paid campaigns such as Google AdWords, LinkedIn, banner ads, etc., and pinpoint how many companies from a specified list visited your site, which industries and what size companies visited the site. It provides the opportunity to then target paid campaigns to those visitors and channels, or increase efforts to reach untapped segments of a targeted audience. 
    Technical Considerations 
    Not a whole lot of considerations. Insightera makes it easy to plug and play. In your ‘Admin’ interface, select your Custom Variables slots for the ‘Industry’ and ‘Organization’ -- and let the rich data flow. Double check that the selected custom variable slots are empty and that you’re not already using them for something else in your Google Analytics implementation. 

    Content Personalization
    Equipped with this new data, you can automate and personalize remarketing efforts and create targeted ads based on any given criteria. In the example above, the education-specific whitepaper can be presented to your higher-ed visitors, while hi-tech/software related content can be presented to your hi-tech/software visitors. 
    Insightera’s recommendation engine filters visitors by location and industry, content preferences and CRM data and digital behavior patterns. This process then predicts which content or channel works best for each visitor.
    Increase the Value of Universal Analytics with more User Centricity 
    If you’re an early adopter of Universal Analytics or planning to migrate to Universal Analytics, Insightera will soon have you covered. The same method described above can be applied and firmographic data can be integrated into Custom Dimensions. 

    With some additional customization, and if you are (and you should be) user-centric, you can take up your implementation a notch up and report on visitors, not just visits, across web, mobile and other devices. Examples include where you have premium/gated content behind registration, user logins or when users self-identify. In these examples, a user-id is associated with each authenticated visitor and stored in a Custom Dimension. Measuring user behavior across multiple sessions and across multiple devices will then be available and you’ll be able to stitch data from different data sources including Insightera as well CRM systems such integrating GA with SalesForce.

    Conclusion
    As advertising and remarketing efforts reach new levels of focus, site owners have the most relevant information to meet their needs thanks to account-based marketing. Combining the power of Google Analytics with the new scope of firmographic data allows a new level of Performance Analytics. This set of tools offers deeper analytic insights into who your potential customers are, what they do, where they come from and what they consume.
    Posted by Feras Alhlou, Principal Consultant, E-Nor, a Google Analytics Authorized Premium Reseller

    Using Universal Analytics to Measure Movement

    The following is a guest post by Benjamin Mangold, Director of Digital & Analytics at Loves Data, a Google Analytics Certified Partner.

    Universal Analytics includes new JavaScript tracking code for websites and new mobile SDKs. But Universal Analytics is a lot more than that - it also gives us the Measurement Protocol, which allows us to send data to Google Analytics without the need to use the tracking code or SDKs.

    Earlier this year, the team at Loves Data used Universal Analytics and the Measurement Protocol to measure their caffeine consumption and tie it to the team’s productivity. Our next challenge: measuring our team’s movement into Google Analytics. With the help of an Xbox Kinect, movement recognition software, and of course the Measurement Protocol, we started getting creative!


    Business Applications and Analysis Opportunities

    So measuring movement is fun and although we can measure total and unique dance moves you might be wondering about the business applications. This is where the power of measuring offline interactions can really start to be seen. The Measurement Protocol enables business applications such as:
    • Measuring in-store purchases and tying purchases to your online data
    • Understanding behaviour across any connected device, including gaming consoles
    • Comparing offline billboard impressions to online display ad impressions
    • Getting insights into your audience’s online to offline journey
    Once you have tied your online and offline data together you can begin to analyze the full impact of your different touch points. For example, if you are collecting contact details online, you can use Google Analytics to then understand who actually converts offline, whether this conversion is attending an information session or making a purchase at a cash register. The analysis possibilities made available by the Measurement Protocol are truly amazing.