Chrome Beta for Android Update

Hi everyone! We've just released Chrome Beta 110 (110.0.5481.64) for Android. It's now available on Google Play.

You can see a partial list of the changes in the Git log. For details on new features, check out the Chromium blog, and for details on web platform updates, check here.

If you find a new issue, please let us know by filing a bug.

Krishna Govind
Google Chrome

Announcing the Search Central Live Brazil roadshow

We're very excited to announce that Search Central Live is coming to Brazil! Following our successful events last year, we're continuing our mission to help you enhance your site's performance in Google Search. We're organizing three events in Brazil, starting with São Paulo on March 9, then Brasília on March 14, and finishing with Belo Horizonte on March 16.

Protection and partnership in today’s Waitangi Day Doodle


“One of the core principles of Te Tiriti o Waitangi is protection and partnership. This tiki artform represents the ambitions of our tipuna, and honours the aspirations of both Māori and the wider community for protection of land, community and partnership.” says Hori-Te-Ariki Mataki (Ae, Ngāi Tahu, Ngāti Kauwhata, Te Whānau-ā-Apanui me Te Āti Haunui a Pāpārangi) of the artwork he has designed for today’s local Google Doodle. 


Shared today for all in Aotearoa to see on New Zealand’s Google homepage, this Doodle celebrates the ambitions of two cultures and their shared desire to protect and provide for their people. Taking its likeness from pounamu, a taonga in Māori culture, the colours represent the physical - land, sea and air - taonga of tangata whenua. “The outstretched arms of the tiki represent the integration of cultures and future innovation to protect these natural domains of our environment, the flora and fauna, for all generations to come.”Hori explained.


Aotearoa New Zealand today recognises Te Tiriti o Waitangi which was signed on 6 February 1840. Kiwi’s search interest in Te Tiriti o Waitangi has tripled over the past 12 months in New Zealand showing a growing desire to lear more. Searches for the Principles of the Treaty of Waitangi reached a ten-year high in May last year. 


Of his work, Hori shared that the use of “language, art forms and philosophies of our ancestors and tikanga Māori allow us to create, communicate and connect. And the latest technologies in design and strategy help our people toward a better future.”


Post content

Google Workspace Updates Weekly Recap – February 3, 2023

3 New updates

Unless otherwise indicated, the features below are fully launched or in the process of rolling out (rollouts should take no more than 15 business days to complete), launching to both Rapid and Scheduled Release at the same time (if not, each stage of rollout should take no more than 15 business days to complete), and available to all Google Workspace and G Suite customers.


In-line replies for email notifications in Google Classroom 
We’re making Classroom email notifications more functional and easier to use. With in-line replies for comments, teachers and students will be able to easily stay up to date and respond to communication within Classroom. Public and private comment notifications will have the freshest information, like the latest comment threads, and you can now easily respond to comments within the email itself. This will enable teachers to quickly reply to their students without having to switch back and forth between their email and Classroom. | Rollout to Rapid Release and Scheduled Release domains began January 30, 2023 and is expected to be completed by February 20, 2023. | Available to Education Fundamentals, Education Plus, Education Standard, the Teaching and Learning Upgrade customers, and users with personal Google Accounts only. | Learn more

Expanding color options in Google Slides, Docs, Sheets and Drawings
In Google Slides, Docs, Sheets and Drawings, you can now select colors in the color palette tool by using RGBA values. In addition, you can also customize colors by using an eyedropper tool and selecting any color on your screen within the color palette. | Rolling out to Rapid Release domains now; launch to Scheduled Release domains planned for February 15, 2023. | Learn more
More ways to work with BigQuery data in Google Sheets
We’re expanding your ability to access, analyze, visualize, and share billions of rows of BigQuery data from Google Sheets:
Available to all Google Workspace customers and users with personal Google Accounts only. Not available to legacy G Suite Basic and Business customers.


Previous announcements

The announcements below were published on the Workspace Updates blog earlier this week. Please refer to the original blog posts for complete details.


Google Sheets adds powerful new functions for advanced analysis
We announced 11 additional functions that will introduce new concepts, provide you with more efficient functions, and help with more advanced analysis | Learn more.


Explore Looker data using Connected Sheets
We added the ability to interactively explore modeled data from Looker, Google Cloud’s modern business intelligence platform, using Connected Sheets. | Available to Google Workspace Essentials, Business Starter, Business Standard, Business Plus, Enterprise Essentials, Enterprise Standard, Enterprise Plus, Education Fundamentals, Education Plus, Education Standard, the Teaching and Learning Upgrade, Frontline, and Nonprofits, as well as users with personal Google Accounts only. | Learn more.


Completed rollouts

The features below completed their rollouts to Rapid Release domainsScheduled Release domains, or both. Please refer to the original blog post for additional details.

Rapid Release Domains: 

Real-time tracking of wildfire boundaries using satellite imagery

As global temperatures rise, wildfires around the world are becoming more frequent and more dangerous. Their effects are felt by many communities as people evacuate their homes or suffer harm even from proximity to the fire and smoke.

As part of Google’s mission to help people access trusted information in critical moments, we use satellite imagery and machine learning (ML) to track wildfires and inform affected communities. Our wildfire tracker was recently expanded. It provides updated fire boundary information every 10–15 minutes, is more accurate than similar satellite products, and improves on our previous work. These boundaries are shown for large fires in the continental US, Mexico, and most of Canada and Australia. They are displayed, with additional information from local authorities, on Google Search and Google Maps, allowing people to keep safe and stay informed about potential dangers near them, their homes or loved ones.

Real-time boundary tracking of the 2021-2022 Wrattonbully bushfire, shown as a red polygon in Google Maps.

Inputs

Wildfire boundary tracking requires balancing spatial resolution and update frequency. The most scalable method to obtain frequent boundary updates is to use geostationary satellites, i.e., satellites that orbit the earth once every 24 hours. These satellites remain at a fixed point above Earth, providing continual coverage of the area surrounding that point. Specifically, our wildfire tracker models use the GOES-16 and GOES-18 satellites to cover North America, and the Himawari-9 and GK2A satellites to cover Australia. These provide continent-scale images every 10 minutes. The spatial resolution is 2km at nadir (the point directly below the satellite), and lower as one moves away from nadir. The goal here is to provide people with warnings as soon as possible, and refer them to authoritative sources for spatially precise, on-the-ground data, as necessary.

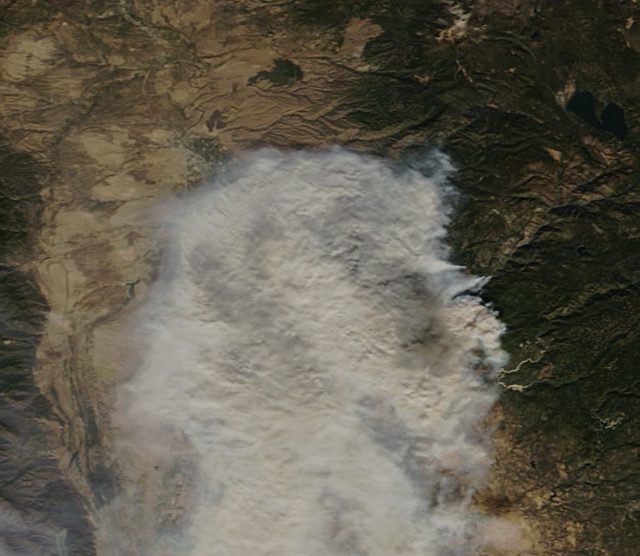
Smoke plumes obscuring the 2018 Camp Fire in California. [Image from NASA Worldview]

Determining the precise extent of a wildfire is nontrivial, since fires emit massive smoke plumes, which can spread far from the burn area and obscure the flames. Clouds and other meteorological phenomena further obscure the underlying fire. To overcome these challenges, it is common to rely on infrared (IR) frequencies, particularly in the 3–4 μm wavelength range. This is because wildfires (and similar hot surfaces) radiate considerably at this frequency band, and these emissions diffract with relatively minor distortions through smoke and other particulates in the atmosphere. This is illustrated in the figure below, which shows a multispectral image of a wildfire in Australia. The visible channels (blue, green, and red) mostly show the triangular smoke plume, while the 3.85 μm IR channel shows the ring-shaped burn pattern of the fire itself. Even with the added information from the IR bands, however, determining the exact extent of the fire remains challenging, as the fire has variable emission strength, and multiple other phenomena emit or reflect IR radiation.

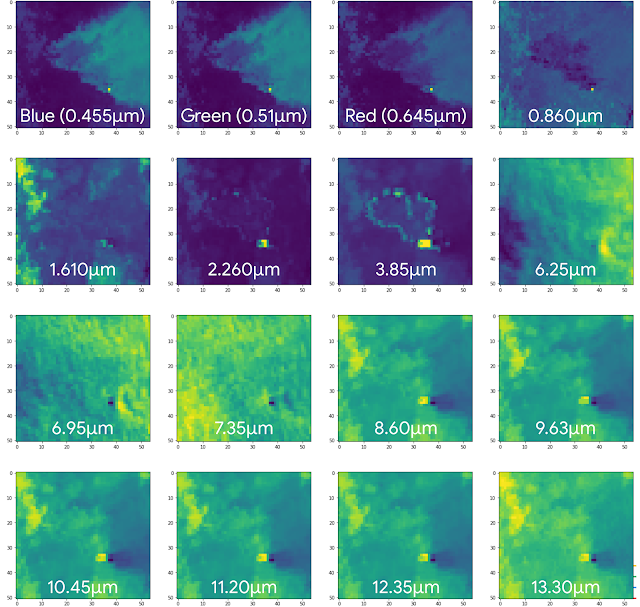
Himawari-8 hyperspectral image of a wildfire. Note the smoke plume in the visible channels (blue, green, and red), and the ring indicating the current burn area in the 3.85μm band.

Model

Prior work on fire detection from satellite imagery is typically based on physics-based algorithms for identifying hotspots from multispectral imagery. For example, the National Oceanic and Atmospheric Administration (NOAA) fire product identifies potential wildfire pixels in each of the GOES satellites, primarily by relying on the 3.9 μm and 11.2 μm frequencies (with auxiliary information from two other frequency bands).

In our wildfire tracker, the model is trained on all satellite inputs, allowing it to learn the relative importance of different frequency bands. The model receives a sequence of the three most recent images from each band so as to compensate for temporary obstructions such as cloud cover. Additionally, the model receives inputs from two geostationary satellites, achieving a super-resolution effect whereby the detection accuracy improves upon the pixel size of either satellite. In North America, we also supply the aforementioned NOAA fire product as input. Finally, we compute the relative angles of the sun and the satellites, and provide these as additional input to the model.

All inputs are resampled to a uniform 1 km–square grid and fed into a convolutional neural network (CNN). We experimented with several architectures and settled on a CNN followed by a 1x1 convolutional layer to yield separate classification heads for fire and cloud pixels (shown below). The number of layers and their sizes are hyperparameters, which are optimized separately for Australia and North America. When a pixel is identified as a cloud, we override any fire detection since heavy clouds obscure underlying fires. Even so, separating the cloud classification task improves the performance of fire detection as we incentivize the system to better identify these edge cases.

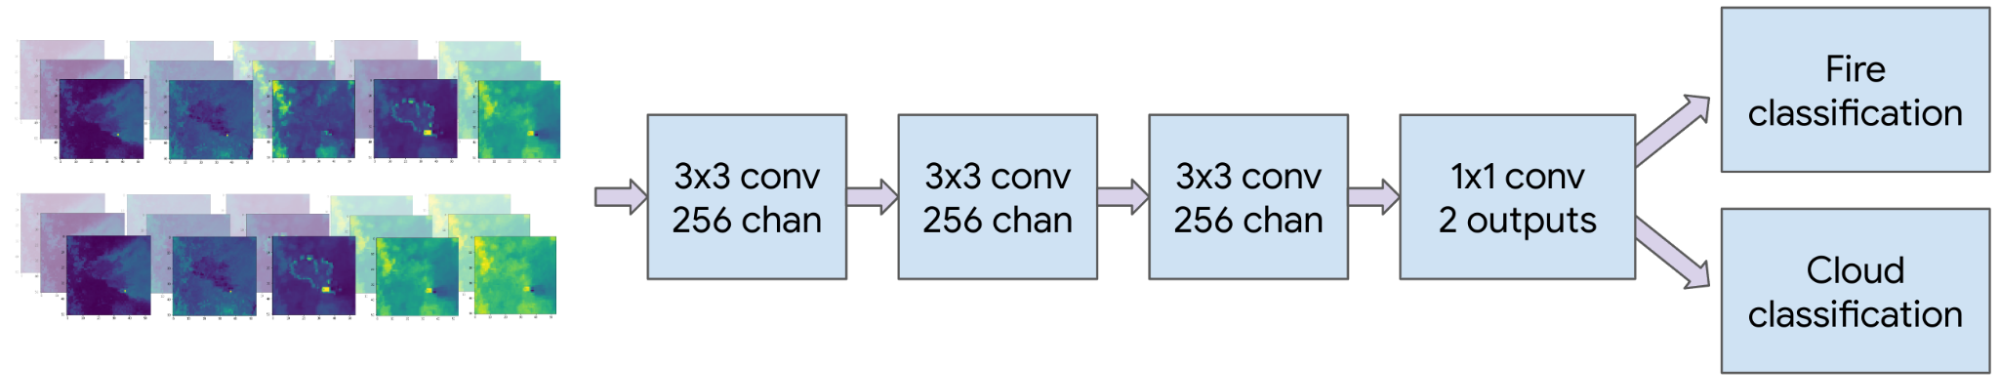
CNN architecture for the Australia model; a similar architecture was used for North America. Adding a cloud classification head improves fire classification performance.

To train the network, we used thermal anomalies data from the MODIS and VIIRS polar-orbiting satellites as labels. MODIS and VIIRS have higher spatial accuracy (750–1000 meters) than the geostationary satellites we use as inputs. However, they cover a given location only once every few hours, which occasionally causes them to miss rapidly-advancing fires. Therefore, we use MODIS and VIIRS to construct a training set, but at inference time we rely on the high-frequency imagery from geostationary satellites.

Even when limiting attention to active fires, most pixels in an image are not currently burning. To reduce the model's bias towards non-burning pixels, we upsampled fire pixels in the training set and applied focal loss to encourage improvements in the rare misclassified fire pixels.

The progressing boundary of the 2022 McKinney fire, and a smaller nearby fire.

Evaluation

High-resolution fire signals from polar-orbiting satellites are a plentiful source for training data. However, such satellites use sensors that are similar to geostationary satellites, which increases the risk of systemic labeling errors (e.g., cloud-related misdetections) being incorporated into the model. To evaluate our wildfire tracker model without such bias, we compared it against fire scars (i.e., the shape of the total burnt area) measured by local authorities. Fire scars are obtained after a fire has been contained and are more reliable than real-time fire detection techniques. We compare each fire scar to the union of all fire pixels detected in real time during the wildfire to obtain an image such as the one shown below. In this image, green represents correctly identified burn areas (true positive), yellow represents unburned areas detected as burn areas (false positive), and red represents burn areas that were not detected (false negative).

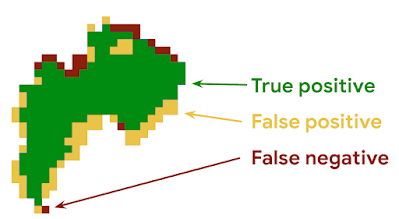
Example evaluation for a single fire. Pixel size is 1km x 1km.

We compare our models to official fire scars using the precision and recall metrics. To quantify the spatial severity of classification errors, we take the maximum distance between a false positive or false negative pixel and the nearest true positive fire pixel. We then average each metric across all fires. The results of the evaluation are summarized below. Most severe misdetections were found to be a result of errors in the official data, such as a missing scar for a nearby fire.

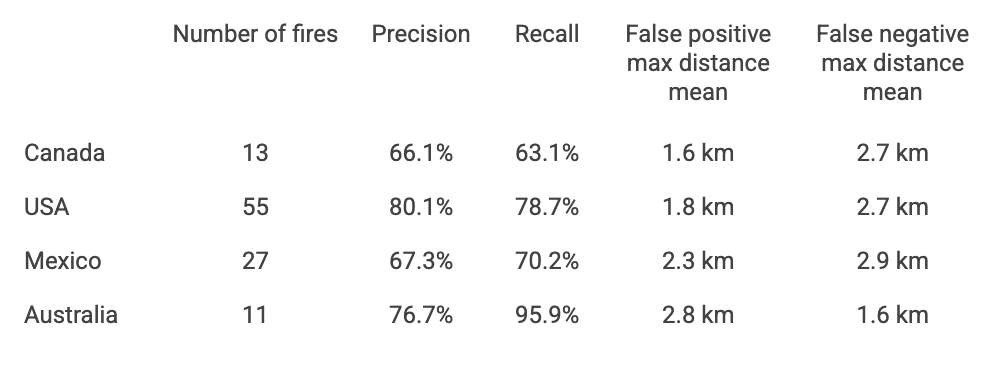
Test set metrics comparing our models to official fire scars.

We performed two additional experiments on wildfires in the United States (see table below). First, we evaluated an earlier model that relies only on NOAA's GOES-16 and GOES-17 fire products. Our model outperforms this approach in all metrics considered, demonstrating that the raw satellite measurements can be used to enhance the existing NOAA fire product.

Next, we collected a new test set consisting of all large fires in the United States in 2022. This test set was not available during training because the model launched before the fire season began. Evaluating the performance on this test set shows performance in line with expectations from the original test set.

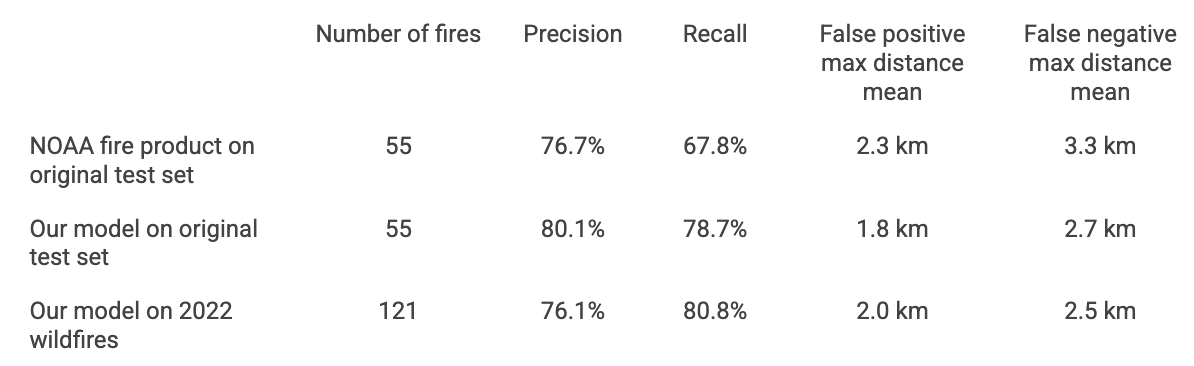
Comparison between models on fires in the United States.


Conclusion

Boundary tracking is part of Google’s wider commitment to bring accurate and up-to-date information to people in critical moments. This demonstrates how we use satellite imagery and ML to track wildfires, and provide real time support to affected people in times of crisis. In the future, we plan to keep improving the quality of our wildfire boundary tracking, to expand this service to more countries and continue our work helping fire authorities access critical information in real time.


Acknowledgements

This work is a collaboration between teams from Google Research, Google Maps and Crisis Response, with support from our partnerships and policy teams. We would also like to thank the fire authorities whom we partner with around the world.


Source: Google AI Blog


Enable fast pass development with Google Wallet demo mode

Posted by Google Pay Developers team

What is demo mode?

We want to make it easier for you to develop and test Google Wallet passes so that you can create new, engaging experiences for your customers. Today, you can sign up in the Google Pay & Wallet Console and start using the Google Wallet API immediately in “demo mode.”

When you sign up for a Google Wallet Issuer account for the first time, your account will be in demo mode. Demo mode includes the same features and functionality as publishing mode. However, access to issue Google Wallet passes to users is restricted to any “test users” you add in the console. While in demo mode, any user who is not included in your list of test users will not be able to add a pass you create to their Google Wallet app. By default, all administrators and developers who have access to your Issuer account are already test users. The passes created by issuers in demo mode will contain the text “[TEST ONLY]” in the top of the pass until the issuer is approved to be in publishing mode.

While in demo mode, you can do any of the following:

When you are in the Google Pay & Wallet Console, you will see two different indicators that your Issuer account is in demo mode.

On the Dashboard page, the Google Wallet API integration card will include a Demo mode tag.
Google Wallet API integration card on the console dashboard
Figure 1 - The Google Wallet API integration card on the console dashboard

On the Google Wallet API page, on the Manage tab, you will see a larger notice stating “You’re in demo mode,” along with additional information and a link to learn more.
The demo mode notice on the Google Wallet API console page
Figure 2 - The demo mode notice on the Google Wallet API console page

How can developers use the Google Wallet API?

It’s simple! Just follow the below steps and you’ll have access to your issuer account in demo.

  1. Create a business in the Google Pay & Wallet Console
  2. Select Google Wallet API
  3. Select Build your first pass
  4. Agree to the Google Wallet API Terms of Service

Some additional steps differ depending on whether you use the Android SDK or Web API. Please refer to the Google Wallet Developer Documentation for these other steps. After you’ve completed the steps, you’ll be ready to create your own classes and issue passes to your test users.

How does demo mode affect new and existing accounts?

If you have an existing account and have requested publishing access by submitting a support request, no changes are required on your end. Your Issuer account is already in publishing mode and this will be reflected in the console.

For new accounts, this will depend on two factors:

  • The user or service account is associated with an existing Issuer account
  • The new account is being created using the issuer.insert method or the Google Pay & Wallet Console

No existing account

Existing account
(demo mode)
Existing account
(publishing mode)
ConsoleDemo mode

Demo modePublishing mode

issuer.insert

Request fails*

Request fails*

Publishing mode

*Note - Issuer accounts in demo mode are unable to create additional accounts using the issuer.insert method.

How are test users managed?

To add and/or remove test users without granting them access to your Issuer account, follow the below steps:

  1. Navigate to the Google Pay & Wallet Console
  2. Select Google Wallet API
  3. In the Manage tab, select Set up test accounts
  4. Add each test user’s Google Account email address on a separate line
Select Update testers
The test accounts window
Figure 3 - The test accounts window where you can add test users

How do developers go to publishing mode?

When you’re ready to go to start issuing passes to real users, you will need to complete the following before you are able to request publishing access:

  • Create at least one pass class
  • Complete your business profile
Once complete, you can submit the publishing access request form. A Google contact will reach out to you requesting screenshots of the pass classes and objects you are creating to ensure they adhere to our brand guidelines and acceptable use policy. This can take up to two business days to process. You will be notified by email when your request is approved, and your Issuer account will be converted to publishing mode. The status of your pass classes will not change, and any pass classes that are in APPROVED state will be available for issuing pass objects to users.

Next steps

Try creating a Generic pass class and object by following the Web or Android codelabs! In these codelabs, you will have the option to create a new Issuer account and try out demo mode. Follow @GooglePayDevs on Twitter for future updates. If you have questions, tag @GooglePayDevs and include #AskGooglePayDevs in your tweets.

Google Ads API Video Roundup – Feb 2023

The Google Ads Developers Channel is your source for release notes, best practices, new feature integrations, code walkthroughs, and video tutorials. Check out some of the recently released and popular videos and playlists below, and remember to subscribe to our channel to stay up to date with the latest video content.

Performance Max for Developers [New Series]

In this series, we navigate the entire developer journey of creating standard Performance Max campaigns and Performance Max campaigns for online sales with a product feed. We discuss how to think about Performance Max as compared with other campaign types and walk through the process of creating Performance Max campaigns conceptually. In addition, we explore several implementation options with the use of the new Performance Max Interactive Guide, which you can use to easily follow along and jumpstart your integration.

Five episodes have been published with an additional three more on the way. Subscribe to our channel to be notified when new episodes are released.

Testing Your Integration [New Series]

In the first two episodes of this miniseries, we begin to look at testing with the Google Ads API. In the introductory episode, we discuss Google Ads test accounts and test account alternatives. In the second episode, we demonstrate test account usage in practice. Subscribe to our channel to be notified when the next episode about testing best practices becomes available.

Campaign Primary Status [New Video]

The Google Ads API introduced two new fields on the campaign resource in v12, called primary_status and primary_status_reason. In this video, we discuss how they can help you understand what is going on with your campaigns and how to optimize their serving.

Meet the Team [New Episodes]

Check out the two new episodes in our Meet the Team series to catch in-depth discussions with Eric Schwelm, who is a Software Engineer and Tech Lead on the Google Ads API, and Carolyn Chou, who is a Product Manager working on Performance Max campaigns in the Google Ads API.


For additional topics, including Release Notes, Authentication and Authorization and Working with REST, check out the Google Ads Developers YouTube channel.

As always, feel free to reach out to us with any questions via the Google Ads API forum or at [email protected].