 We’re making it easier to find Mother’s Day gifts with a new shopping experience.
A new Mother’s Day gift experience on Google Search
We’re making it easier to find Mother’s Day gifts with a new shopping experience.
We’re making it easier to find Mother’s Day gifts with a new shopping experience.
We’re making it easier to find Mother’s Day gifts with a new shopping experience.


 Every May, Google recognizes a companywide event we call “Honoring Asian and Pasifika Ancestry Month.” This celebration builds on the broader observance of Asian Pacific…
The Beta channel is being updated to OS version: 15853.16.0 Browser version: 125.0.6422.19 for most ChromeOS devices.
If you find new issues, please let us know one of the following ways
Interested in switching channels? Find out how.
Matt Nelson
Google ChromeOS
Hello, Everyone! We've just released Chrome 124 (124.0.6367.113) for Android: it'll become available on Google Play over the next few days.
This release includes stability and performance improvements. You can see a full list of the changes in the Git log. If you find a new issue, please let us know by filing a bug.
The Stable channel has been updated to 124.0.6367.118/.119 for Windows, Mac and 124.0.6367.118 for Linux which will roll out over the coming days/weeks. A full list of changes in this build is available in the Log.
The Extended Stable channel has been updated to 124.0.6367.118 for Mac and Windows which will roll out over the coming days/weeks.
Security Fixes and Rewards
Note: Access to bug details and links may be kept restricted until a majority of users are updated with a fix. We will also retain restrictions if the bug exists in a third party library that other projects similarly depend on, but haven’t yet fixed.
This update includes 2 security fixes. Below, we highlight fixes that were contributed by external researchers. Please see the Chrome Security Page for more information.
[$3000][335003891] High CVE-2024-4331: Use after free in Picture In Picture. Reported by Zhenghang Xiao (@Kipreyyy) on 2024-04-16
[TBD][333508731] High CVE-2024-4368: Use after free in Dawn. Reported by wgslfuzz on 2024-04-09
We would also like to thank all security researchers that worked with us during the development cycle to prevent security bugs from ever reaching the stable channel.
Interested in switching release channels? Find out how here. If you find a new issue, please let us know by filing a bug. The community help forum is also a great place to reach out for help or learn about common issues.
Daniel Yip
Google Chrome

Android Studio Jellyfish (2023.3.1) is making waves with its official stable release! 🪼🌊 Dive into cutting-edge AI features like Gemini in Android Studio, seamless Google services integrations like Android Device Streaming, and much more. All designed to supercharge your Android development to build next-generation, high-quality apps. Surf below to learn more about all the updates, product quality improvements, and new features across your key flows in Android Studio Jellyfish, and download the latest stable version today to try them out!
Today, Gemini in Android Studio is available in over 200+ countries and territories, including a new set of countries in Europe. Thanks to all of the valuable feedback you’ve provided us over the last year, we’re excited to bring Gemini in Android Studio (formerly Studio Bot) into this stable release of Android Studio, as your AI-powered development companion in Android Studio, ready to level up your productivity. Ask your Android development questions and get help instantly: whether it’s to generate code, find resources, or explain best practices, Gemini in Android Studio is here to save you valuable time. Plus, it integrates seamlessly with your workflow:
Onboard and then opt-in with the built-in AI privacy controls, and learn more about how the current capabilities of Gemini in Android Studio can accelerate your development workflow.
To provide you with more precise control over the permissions you grant for specific features, the new sign-in flow lets you select only the Google Service integrations you want to enable. This means you decide exactly which features, like Gemini for Android Studio, App Quality Insights, and Android Device Streaming, are able to access the required Google services using your Google account.


Android Device Streaming, powered by Firebase, lets you securely connect to remote physical Android devices hosted in Google's secure data centers. It’s a fast and easy way to test your app against physical units of some of the latest Android devices, including the Google Pixel 8 and 8 Pro, Pixel Fold, select Samsung devices, and more.

After connecting to a device, you can deploy your app, view the display, interact with the device (including rotating or unfolding the device), and anything else you might do with a device using a direct ADB over SSL connection—all without leaving Android Studio. When you're done using the device, Google wipes all your data and factory resets the device before making it available to another developer.
Android Device Streaming is currently available as a no-cost trial after you sign in to Android Studio with your Google account and select a Firebase project to use. If you don’t already have a Firebase project, it’s easy to create one.
Dive deeper into App Quality Insights (AQI) crash reports with Android Studio Jellyfish! We've listened to your feedback and made analyzing crashes easier than ever:

In Android Studio Jellyfish, Layout Inspector is now embedded by default in the Running Devices tool window. This integration saves screen real-estate, centralizes your workflow in a single tool window, and delivers significant performance gains - with a 50% improvement in rendering speeds. You can effortlessly toggle between deeply inspecting and interacting with your app, and use snapshots for 3D visualizations of your UI. Discover the full range of features here.
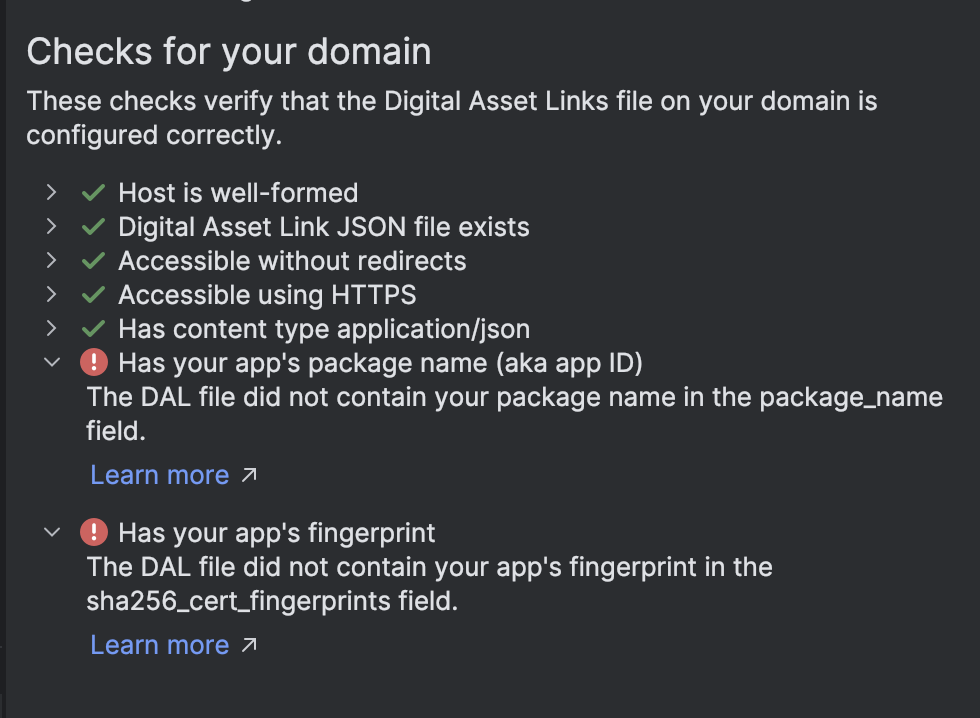
App Links Assistant now supports web association file validation. This new feature streamlines deep linking by helping you identify and fix errors in your deep links setup (both in your Android manifest file and the corresponding Digital Asset Links JSON file). Ensure a seamless user experience by validating that your JSON file is correctly formatted for upload to your domain.
Baseline Profiles improve code execution speed by about 30% from the first launch by avoiding interpretation and just-in-time (JIT) compilation steps for included code paths. While Android Studio has included Baseline Profiles in builds for years now, these were only actually compiled by the OS in production (often by Play Store).
Android Studio Jellyfish now compiles these Baseline Profiles when any non-debuggable app build is installed on a device. This applies to release builds, as well as when you're profiling with low-overhead.
This means — as long as you aren't using a debug variant of your app — the performance you see when installing from Studio / CLI now much more closely matches production by taking advantage of profiles from a Baseline Profile generator module and libraries like Compose.
Beyond new features, we also continue to improve the overall quality and stability of Android Studio. In fact, over 900 bugs were addressed during the Jellyfish/AGP-8.4 cycle, and memory errors are down by 40%.
Android Studio Jellyfish (2023.3.1) includes the IntelliJ 2023.3 platform release, which has many new features such as comprehensive support for the latest Java 21 programing language features, an intuitive floating toolbar with editing actions, and a Run to Cursor inlay option in the debugger to speed up your workflow. Learn more.
To recap, Android Studio Jellyfish 🪼includes the following enhancements and features:
Develop
Debug
Optimize
Quality Improvements
IntelliJ Platform Update
Ready for next-level Android development? Download Android Studio Jellyfish 🪼 and unlock cutting-edge features today! As always, your feedback is important to us – check known issues, report bugs, suggest improvements, and be part of our vibrant community on LinkedIn, Medium, YouTube, or X. Let's build the future of Android apps together!
Chromium's sandboxed process model defends well from malicious web content, but there are limits to how well the application can protect itself from malware already on the computer. Cookies and other credentials remain a high value target for attackers, and we are trying to tackle this ongoing threat in multiple ways, including working on web standards like DBSC that will help disrupt the cookie theft industry since exfiltrating these cookies will no longer have any value.
Where it is not possible to prevent the theft of credentials and cookies by malware, the next best thing is making the attack more observable by antivirus, endpoint detection agents, or enterprise administrators with basic log analysis tools.
This blog describes one set of signals for use by system administrators or endpoint detection agents that should reliably flag any access to the browser’s protected data from another application on the system. By increasing the likelihood of an attack being detected, this changes the calculus for those attackers who might have a strong desire to remain stealthy, and might cause them to rethink carrying out these types of attacks against our users.
Background
Chromium based browsers on Windows use the DPAPI (Data Protection API) to secure local secrets such as cookies, password etc. against theft. DPAPI protection is based on a key derived from the user's login credential and is designed to protect against unauthorized access to secrets from other users on the system, or when the system is powered off. Because the DPAPI secret is bound to the logged in user, it cannot protect against local malware attacks — malware executing as the user or at a higher privilege level can just call the same APIs as the browser to obtain the DPAPI secret.
Since 2013, Chromium has been applying the CRYPTPROTECT_AUDIT flag to DPAPI calls to request that an audit log be generated when decryption occurs, as well as tagging the data as being owned by the browser. Because all of Chromium's encrypted data storage is backed by a DPAPI-secured key, any application that wishes to decrypt this data, including malware, should always reliably generate a clearly observable event log, which can be used to detect these types of attacks.
There are three main steps involved in taking advantage of this log:
This blog will also show how the logging works in practice by testing it against a python password stealer.
Step 1: Enable logging on the system
DPAPI events are logged into two places in the system. Firstly, there is the 4693 event that can be logged into the Security Log. This event can be enabled by turning on "Audit DPAPI Activity" and the steps to do this are described here, the policy itself sits deep within Security Settings -> Advanced Audit Policy Configuration -> Detailed Tracking.
Here is what the 4693 event looks like:
The issue with the 4693 event is that while it is generated if there is DPAPI activity on the system, it unfortunately does not contain information about which process was performing the DPAPI activity, nor does it contain information about which particular secret is being accessed. This is because the Execution ProcessID field in the event will always be the process id of lsass.exe because it is this process that manages the encryption keys for the system, and there is no entry for the description of the data.
It was for this reason that, in recent versions of Windows a new event type was added to help identify the process making the DPAPI call directly. This event was added to the Microsoft-Windows-Crypto-DPAPI stream which manifests in the Event Log in the Applications and Services Logs > Microsoft > Windows > Crypto-DPAPI part of the Event Viewer tree.
The new event is called DPAPIDefInformationEvent and has id 16385, but unfortunately is only emitted to the Debug channel and by default this is not persisted to an Event Log, unless Debug channel logging is enabled. This can be accomplished by enabling it directly in powershell:
Once this log is enabled then you should start to see 16385 events generated, and these will contain the real process ids of applications performing DPAPI operations. Note that 16385 events are emitted by the operating system even for data not flagged with CRYPTPROTECT_AUDIT, but to identify the data as owned by the browser, the data description is essential. 16385 events are described later.
You will also want to enable Audit Process Creation in order to be able to know a current mapping of process ids to process names — more details on that later. You might want to also consider enabling logging of full command lines.
Step 2: Collect the events
The events you want to collect are:
These should be collected from all workstations, and persisted into your enterprise logging system for analysis.
Step 3: Write detection logic to detect theft.
With these two events is it now possible to detect when an unauthorized application calls into DPAPI to try and decrypt browser secrets.
The general approach is to generate a map of process ids to active processes using the 4688 events, then every time a 16385 event is generated, it is possible to identify the currently running process, and alert if the process does not match an authorized application such as Google Chrome. You might find your enterprise logging software can already keep track of which process ids map to which process names, so feel free to just use that existing functionality.
Let's dive deeper into the events.
A 4688 event looks like this - e.g. here is Chrome browser launching from explorer:
The important part here is the NewProcessId, in hex 0x17eac which is 97964.
A 16385 event looks like this:
The important parts here are the OperationType, the DataDescription and the CallerProcessID.
For DPAPI decrypts, the OperationType will be SPCryptUnprotect.
Each Chromium based browser will tag its data with the product name, e.g. Google Chrome, or Microsoft Edge depending on the owner of the data. This will always appear in the DataDescription field, so it is possible to distinguish browser data from other DPAPI secured data.
Finally, the CallerProcessID will map to the process performing the decryption. In this case, it is 97964 which matches the process ID seen in the 4688 event above, showing that this was likely Google Chrome decrypting its own data! Bear in mind that since these logs only contain the path to the executable, for a full assurance that this is actually Chrome (and not malware pretending to be Chrome, or malware injecting into Chrome), additional protections such as removing administrator access, and application allowlisting could also be used to give a higher assurance of this signal. In recent versions of Chrome or Edge, you might also see logs of decryptions happening in the elevation_service.exe process, which is another legitimate part of the browser's data storage.
To detect unauthorized DPAPI access, you will want to generate a running map of all processes using 4688 events, then look for 16385 events that have a CallerProcessID that does not match a valid caller – Let's try that now.
Testing with a python password stealer
We can test that this works with a public script to decrypt passwords taken from a public blog. It generates two events, as expected:
Here is the 16385 event, showing that a process is decrypting the "Google Chrome" key.
Since the data description being decrypted was "Google Chrome" we know this is an attempt to read Chrome secrets, but to determine the process behind 68768 (0x10ca0), we need to correlate this with a 4688 event.
Here is the corresponding 4688 event from the Security Log (a process start for python3.exe) with the matching process id:
In this case, the process id matches the python3 executable running a potentially malicious script, so we know this is likely very suspicious behavior, and should trigger an alert immediately! Bear in mind process ids on Windows are not unique so you will want to make sure you use the 4688 event with the timestamp closest, but earlier than, the 16385 event.
Summary
This blog has described a technique for strong detection of cookie and credential theft. We hope that all defenders find this post useful. Thanks to Microsoft for adding the DPAPIDefInformationEvent log type, without which this would not be possible.
 Here’s a look at the work we’ve done in Nevada to support local water stewardship, data center water usage and regional economic impact.