Author Archives: Google AI

Experimenting with Automatic Video Creation From a Web Page

At Google, we're actively exploring how people can use creativity tools powered by machine learning and computational methods when producing multimedia content, from creating music and reframing videos, to drawing and more. One creative process in particular, video production, can especially benefit from such tools, as it requires a series of decisions about what content is best suited to a target audience, how to position the available assets within the field of view, and what temporal arrangement will yield the most compelling narrative. But what if one could leverage existing assets, such as a website, to get a jump-start on video creation? Businesses commonly host websites that contain rich visual representations about their services or products, all of which could be repurposed for other multimedia formats, such as videos, potentially enabling those without extensive resources the ability to reach a broader audience.

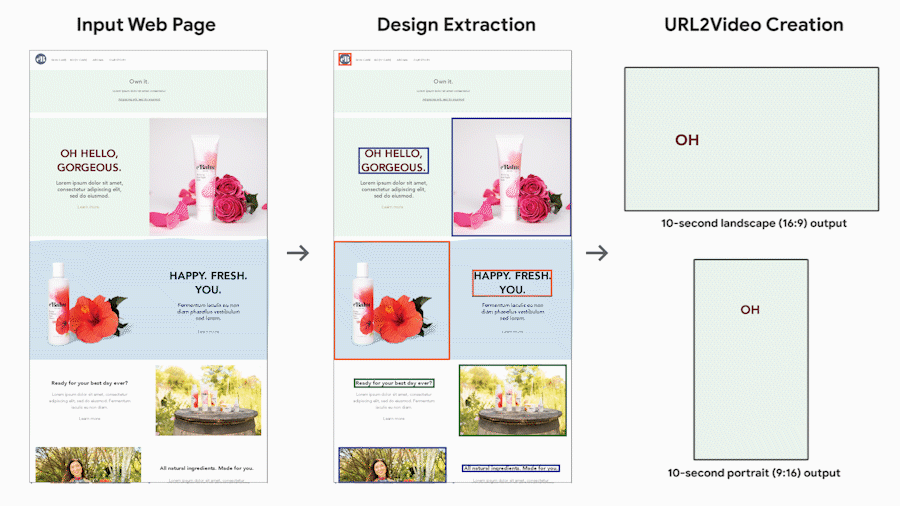
In “Automatic Video Creation From a Web Page”, published at UIST 2020, we introduce URL2Video, a research prototype pipeline to automatically convert a web page into a short video, given temporal and visual constraints provided by the content owner. URL2Video extracts assets (text, images, or videos) and their design styles (including fonts, colors, graphical layouts, and hierarchy) from HTML sources and organizes the visual assets into a sequence of shots, while maintaining a look-and-feel similar to the source page. Given a user-specified aspect ratio and duration, it then renders the repurposed materials into a video that is ideal for product and service advertising.

URL2Video Overview
Assume a user provides an URL to a web page that illustrates their business. The URL2Video pipeline automatically selects key content from the page and decides the temporal and visual presentation of each asset, based on a set of heuristics derived from an interview study with designers who were familiar with web design and video ad creation. These designer-informed heuristics capture common video editing styles, including content hierarchy, constraining the amount of information in a shot and its time duration, providing consistent color and style for branding, and more. Using this information, the URL2Video pipeline parses a web page, analyzing the content and selecting visually salient text or images while preserving their design styles, which it organizes according to the video specifications provided by the user.

By extracting the structural content and design from the input web page, URL2Video makes automatic editing decisions to present key messages in a video. It considers the temporal (e.g., the duration in seconds) and spatial (e.g., the aspect ratio) constraints of the output video defined by users.

Webpage Analysis
Given a webpage URL, URL2Video extracts document object model (DOM) information and multimedia materials. For the purposes of our research prototype, we limited the domain to static web pages that contain salient assets and headings preserved in an HTML hierarchy that follows recent web design principles, which encourage the use of prominent elements, distinct sections, and an order of visual focus that guides readers in perceiving information. URL2Video identifies such visually-distinguishable elements as a candidate list of asset groups, each of which may contain a heading, a product image, detailed descriptions, and call-to-action buttons, and captures both the raw assets (text and multimedia files) and detailed design specifications (HTML tags, CSS styles, and rendered locations) for each element. It then ranks the asset groups by assigning each a priority score based on their visual appearance and annotations, including their HTML tags, rendered sizes, and ordering shown on the page. In this way, an asset group that occupies a larger area at the top of the page receives a higher score.

Constraints-Based Asset Selection
We consider two goals when composing a video: (1) each video shot should provide concise information, and (2) the visual design should be consistent with the source page. Based on these goals and the video constraints provided by the user, including the intended video duration (in seconds) and aspect ratio (commonly 16:9, 4:3, 1:1, etc.), URL2Video automatically selects and orders the asset groups to optimize the total priority score. To make the content concise, it presents only dominant elements from a page, such as a headline and a few multimedia assets. It constrains the duration of each visual element for viewers to perceive the content. In this way, a short video highlights the most salient information from the top of the page, and a longer video contains more campaigns or products.

Scene Composition & Video Rendering
Given an ordered list of assets based on the DOM hierarchy, URL2Video follows the design heuristics obtained from interview studies to make decisions about both the temporal and spatial arrangement to present the assets in individual shots. It transfers the graphical layout of elements into the video’s aspect ratio, and applies the style choices including fonts and colors. To make a video more dynamic and engaging, it adjusts the presentation timing of assets. Finally, it renders the content into a video in the MPEG-4 container format.

User Control
The interface to the research prototype allows the user to review the design attributes in each video shot extracted from the source page, reorder the materials, change the detailed design, such as colors and fonts, and adjust the constraints to generate a new video.

In URL2Video's authoring interface (left), users specify the input URL to a source page, size of the target page view, and the output video parameters. URL2Video analyzes the web page and extracts major visual components. It composes a series of scenes and visualizes the key frames as a storyboard. These components are rendered into an output video that satisfies the input temporal and spatial constraints. Users can playback the video, examine the design attributes (bottom-right), and make adjustments to generate video variation, such as reordering the scenes (top-right).

URL2Video Use Cases
We demonstrate the performance of the end-to-end URL2Video pipeline on a variety of existing web pages. Below we highlight an example result where URL2Video converts a page that embeds multiple short video clips into a 12-second output video. Note how the pipeline makes automatic editing decisions on font and color choices, timing, and content ordering in a video captured from the source page.

URL2Video identifies key content from our Google Search introduction page (top), including headings and video assets. It converts them into a video by considering the presentation flow, the source design and the output constraints (a 12-second landscape video; bottom).

The video below provides further demonstration:

To evaluate the automatically-generated videos, we conducted a user study with designers at Google. Our results show that URL2Video effectively extracted design elements from a web page and supported designers by bootstrapping the video creation process.

Next steps
While this current research focuses on the visual presentation, we are developing new techniques that support the audio track and a voiceover in video editing. All in all, we envision a future where creators focus on making high-level decisions and an ML model interactively suggests detailed temporal and graphical edits for a final video creation on multiple platforms.

Acknowledgments
We greatly thank our paper co-authors, Zheng Sun (Research) and Katrina Panovich (YouTube). We would also like to thank our colleagues who contributed to URL2Video, (in alphabetical order of last name) Jordan Canedy, Brian Curless, Nathan Frey, Madison Le, Alireza Mahdian, Justin Parra, Emily Ryan, Mogan Shieh, Sandor Szego, and Weilong Yang. We are grateful to receive the support from our leadership, Tomas Izo, Rahul Sukthankar, and Jay Yagnik.

Source: Google AI Blog


Estimating the Impact of Training Data with Reinforcement Learning

Recent work suggests that not all data samples are equally useful for training, particularly for deep neural networks (DNNs). Indeed, if a dataset contains low-quality or incorrectly labeled data, one can often improve performance by removing a significant portion of training samples. Moreover, in cases where there is a mismatch between the train and test datasets (e.g., due to difference in train and test location or time), one can also achieve higher performance by carefully restricting samples in the training set to those most relevant for the test scenario. Because of the ubiquity of these scenarios, accurately quantifying the values of training samples has great potential for improving model performance on real-world datasets.


Top: Examples of low-quality samples (noisy/crowd-sourced); Bottom: Examples of a train and test mismatch.

In addition to improving model performance, assigning a quality value to individual data can also enable new use cases. It can be used to suggest better practices for data collection, e.g., what kinds of additional data would benefit the most, and can be used to construct large-scale training datasets more efficiently, e.g., by web searching using the labels as keywords and filtering out less valuable data.

In “Data Valuation Using Deep Reinforcement Learning”, accepted at ICML 2020, we address the challenge of quantifying the value of training data using a novel approach based on meta-learning. Our method integrates data valuation into the training procedure of a predictor model that learns to recognize samples that are more valuable for the given task, improving both predictor and data valuation performance. We have also launched four AI Hub Notebooks that exemplify the use cases of DVRL and are designed to be conveniently adapted to other tasks and datasets, such as domain adaptationcorrupted sample discovery and robust learningtransfer learning on image data and data valuation.

Quantifying the Value of Data
Not all data are equal for a given ML model — some have greater relevance for the task at hand or are more rich in informative content than others. So how does one evaluate the value of a single datum? At the granularity of a full dataset, it is straightforward; one can simply train a model on the entire dataset and use its performance on a test set as its value. However, estimating the value of a single datum is far more difficult, especially for complex models that rely on large-scale datasets, because it is computationally infeasible to re-train and re-evaluate a model on all possible subsets.

To tackle this, researchers have explored permutation-based methods (e.g., influence functions), and game theory-based methods (e.g., data Shapley). However, even the best current methods are far from being computationally feasible for large datasets and complex models, and their data valuation performance is limited. Concurrently, meta learning-based adaptive weight assignment approaches have been developed to estimate the weight values using a meta-objective. But rather than prioritizing learning from high value data samples, their data value mapping is typically based on gradient descent learning or other heuristic approaches that alter the conventional predictor model training dynamics, which can result in performance changes that are unrelated to the value of individual data points.

Data Valuation Using Reinforcement Learning (DVRL)
To infer the data values, we propose a data value estimator (DVE) that estimates data values and selects the most valuable samples to train the predictor model. This selection operation is fundamentally non-differentiable and thus conventional gradient descent-based methods cannot be used. Instead, we propose to use reinforcement learning (RL) such that the supervision of the DVE is based on a reward that quantifies the predictor performance on a small (but clean) validation set. The reward guides the optimization of the policy towards the action of optimal data valuation, given the state and input samples. Here, we treat the predictor model learning and evaluation framework as the environment, a novel application scenario of RL-assisted machine learning.

Training with Data Value Estimation using Reinforcement Learning (DVRL). When training the data value estimator with an accuracy reward, the most valuable samples (denoted with green dots) are used more and more, whereas the least valuable samples (red dots) are used less frequently.

Results
We evaluate the data value estimation quality of DVRL on multiple types of datasets and use cases.

  • Model performance after removing high/low value samples
    Removing low value samples from the training dataset can improve the predictor model performance, especially in the cases where the training dataset contains corrupted samples. On the other hand, removing high value samples, especially if the dataset is small, decreases the performance significantly. Overall, the performance after removing high/low value samples is a strong indicator for the quality of data valuation.
    Accuracy with the removal of most and least valuable samples, where 20% of the labels are noisy by design. By removing such noisy labels as the least valuable samples, a high-quality data valuation method achieves better accuracy. We demonstrate that DVRL outperforms other methods significantly from this perspective.
    DVRL shows the fastest performance degradation after removing the most important samples and the slowest performance degradation after removing the least important samples in most cases, underlining the superiority of DVRL in identifying noisy labels compared to competing methods (Leave-One-Out and Data Shapley).

  • Robust learning with noisy labels
    We consider how reliably DVRL can learn with noisy data in an end-to-end way, without removing the low-value samples. Ideally, noisy samples should get low data values as DVRL converges and a high performance model would be returned.
    Robust learning with noisy labels. Test accuracy for ResNet-32 and WideResNet-28-10 on CIFAR-10 and CIFAR-100 datasets with 40% of uniform random noise on labels. DVRL outperforms other popular methods that are based on meta-learning.
    We show state-of-the-art results with DVRL in minimizing the impact of noisy labels. These also demonstrate that DVRL can scale to complex models and large-scale datasets.

  • Domain adaptation
    We consider the scenario where the training dataset comes from a substantially different distribution from the validation and testing datasets. Data valuation is expected to be beneficial for this task by selecting the samples from the training dataset that best match the distribution of the validation dataset. We focus on the three cases: (1) a training set based on image search results (low-quality web-scraped) applied to the task of predicting skin lesion classification using HAM 10000 data (high-quality medical); (2) an MNIST training set for a digit recognition task on USPS data (different visual domain); (3) e-mail spam data to detect spam applied to an SMS dataset (different task). DVRL yields significant improvements for domain adaptation, by jointly optimizing the data valuator and corresponding predictor model.

Conclusions
We propose a novel meta learning framework for data valuation which determines how likely each training sample will be used in training of the predictor model. Unlike previous works, our method integrates data valuation into the training procedure of the predictor model, allowing the predictor and DVE to improve each other's performance. We model this data value estimation task using a DNN trained through RL with a reward obtained from a small validation set that represents the target task performance. In a computationally-efficient way, DVRL can provide high quality ranking of training data that is useful for domain adaptation, corrupted sample discovery and robust learning. We show that DVRL significantly outperforms alternative methods on diverse types of tasks and datasets.

Acknowledgements
We gratefully acknowledge the contributions of Tomas Pfister.

Source: Google AI Blog


Rethinking Attention with Performers

Transformer models have achieved state-of-the-art results across a diverse range of domains, including natural language, conversation, images, and even music. The core block of every Transformer architecture is the attention module, which computes similarity scores for all pairs of positions in an input sequence. This however, scales poorly with the length of the input sequence, requiring quadratic computation time to produce all similarity scores, as well as quadratic memory size to construct a matrix to store these scores.

For applications where long-range attention is needed, several fast and more space-efficient proxies have been proposed such as memory caching techniques, but a far more common way is to rely on sparse attention. Sparse attention reduces computation time and the memory requirements of the attention mechanism by computing a limited selection of similarity scores from a sequence rather than all possible pairs, resulting in a sparse matrix rather than a full matrix. These sparse entries may be manually proposed, found via optimization methods, learned, or even randomized, as demonstrated by such methods as Sparse Transformers, Longformers, Routing Transformers, Reformers, and Big Bird. Since sparse matrices can also be represented by graphs and edges, sparsification methods are also motivated by the graph neural network literature, with specific relationships to attention outlined in Graph Attention Networks. Such sparsity-based architectures usually require additional layers to implicitly produce a full attention mechanism.

Standard sparsification techniques. Left: Example of a sparsity pattern, where tokens attend only to other nearby tokens. Right: In Graph Attention Networks, tokens attend only to their neighbors in the graph, which should have higher relevance than other nodes. See Efficient Transformers: A Survey for a comprehensive categorization of various methods.

Unfortunately, sparse attention methods can still suffer from a number of limitations. (1) They require efficient sparse-matrix multiplication operations, which are not available on all accelerators; (2) they usually do not provide rigorous theoretical guarantees for their representation power; (3) they are optimized primarily for Transformer models and generative pre-training; and (4) they usually stack more attention layers to compensate for sparse representations, making them difficult to use with other pre-trained models, thus requiring retraining and significant energy consumption. In addition to these shortcomings, sparse attention mechanisms are often still not sufficient to address the full range of problems to which regular attention methods are applied, such as Pointer Networks. There are also some operations that cannot be sparsified, such as the commonly used softmax operation, which normalizes similarity scores in the attention mechanism and is used heavily in industry-scale recommender systems.

To resolve these issues, we introduce the Performer, a Transformer architecture with attention mechanisms that scale linearly, thus enabling faster training while allowing the model to process longer lengths, as required for certain image datasets such as ImageNet64 and text datasets such as PG-19. The Performer uses an efficient (linear) generalized attention framework, which allows a broad class of attention mechanisms based on different similarity measures (kernels). The framework is implemented by our novel Fast Attention Via Positive Orthogonal Random Features (FAVOR+) algorithm, which provides scalable low-variance and unbiased estimation of attention mechanisms that can be expressed by random feature map decompositions (in particular, regular softmax-attention). We obtain strong accuracy guarantees for this method while preserving linear space and time complexity, which can also be applied to standalone softmax operations.

Generalized Attention
In the original attention mechanism, the query and key inputs, corresponding respectively to rows and columns of a matrix, are multiplied together and passed through a softmax operation to form an attention matrix, which stores the similarity scores. Note that in this method, one cannot decompose the query-key product back into its original query and key components after passing it into the nonlinear softmax operation. However, it is possible to decompose the attention matrix back to a product of random nonlinear functions of the original queries and keys, otherwise known as random features, which allows one to encode the similarity information in a more efficient manner.

LHS: The standard attention matrix, which contains all similarity scores for every pair of entries, formed by a softmax operation on the query and keys, denoted by q and k. RHS: The standard attention matrix can be approximated via lower-rank randomized matrices Q′ and K′ with rows encoding potentially randomized nonlinear functions of the original queries/keys. For the regular softmax-attention, the transformation is very compact and involves an exponential function as well as random Gaussian projections.

Regular softmax-attention can be seen as a special case with these nonlinear functions defined by exponential functions and Gaussian projections. Note that we can also reason inversely, by implementing more general nonlinear functions first, implicitly defining other types of similarity measures, or kernels, on the query-key product. We frame this as generalized attention, based on earlier work in kernel methods. Although for most kernels, closed-form formulae do not exist, our mechanism can still be applied since it does not rely on them.

To the best of our knowledge, we are the first to show that any attention matrix can be effectively approximated in downstream Transformer-applications using random features. The novel mechanism enabling this is the use of positive random features, i.e., positive-valued nonlinear functions of the original queries and keys, which prove to be crucial for avoiding instabilities during training and provide more accurate approximation of the regular softmax attention mechanism.

Towards FAVOR+: Fast Attention via Matrix Associativity
The decomposition described above allows one to store the implicit attention matrix with linear, rather than quadratic, memory complexity. One can also obtain a linear time attention mechanism using this decomposition. While the original attention mechanism multiplies the stored attention matrix with the value input to obtain the final result, after decomposing the attention matrix, one can rearrange matrix multiplications to approximate the result of the regular attention mechanism, without explicitly constructing the quadratic-sized attention matrix. This ultimately leads to FAVOR+.

Left: Standard attention module computation, where the final desired result is computed by performing a matrix multiplication with the attention matrix A and value tensor V. Right: By decoupling matrices Q′ and K′ used in lower rank decomposition of A and conducting matrix multiplications in the order indicated by dashed-boxes, we obtain a linear attention mechanism, never explicitly constructing A or its approximation.

The above analysis is relevant for so-called bidirectional attention, i.e., non-causal attention where there is no notion of past and future. For unidirectional (causal) attention, where tokens do not attend to other tokens appearing later in the input sequence, we slightly modify the approach to use prefix-sum computations, which only store running totals of matrix computations rather than storing an explicit lower-triangular regular attention matrix.

Left: Standard unidirectional attention requires masking the attention matrix to obtain its lower-triangular part. Right: Unbiased approximation on the LHS can be obtained via a prefix-sum mechanism, where the prefix-sum of the outer-products of random feature maps for keys and value vectors is built on the fly and left-multiplied by query random feature vector to obtain the new row in the resulting matrix.

Properties
We first benchmark the space- and time-complexity of the Performer and show that the attention speedups and memory reductions are empirically nearly optimal, i.e., very close to simply not using an attention mechanism at all in the model.

Bidirectional timing for the regular Transformer model in log-log plot with time (T) and length (L). Lines end at the limit of GPU memory. The black line (X) denotes the maximum possible memory compression and speedups when using a “dummy” attention block, which essentially bypasses attention calculations and demonstrates the maximum possible efficiency of the model. The Performer model is nearly able to reach this optimal performance in the attention component.

We further show that the Performer, using our unbiased softmax approximation, is backwards compatible with pretrained Transformer models after a bit of fine-tuning, which could potentially lower energy costs by improving inference speed, without having to fully retrain pre-existing models.

Using the One Billion Word Benchmark (LM1B) dataset, we transferred the original pre-trained Transformer weights to the Performer model, which produces an initial non-zero 0.07 accuracy (dotted orange line). Once fine-tuned however, the Performer quickly recovers accuracy in a small fraction of the original number of gradient steps.

Example Application: Protein Modeling
Proteins are large molecules with complex 3D structures and specific functions that are essential to life. Like words, proteins are specified as linear sequences where each character is one of 20 amino acid building blocks. Applying Transformers to large unlabeled corpora of protein sequences (e.g. UniRef) yields models that can be used to make accurate predictions about the folded, functional macromolecule. Performer-ReLU (which uses ReLU-based attention, an instance of generalized attention that is different from softmax) performs strongly at modeling protein sequence data, while Performer-Softmax matches the performance of the Transformer, as predicted by our theoretical results.

Performance at modeling protein sequences. Train = Dashed, Validation = Solid, Unidirectional = (U), Bidirectional = (B). We use the 36-layer model parameters from ProGen (2019) for all runs, each using a 16×16 TPU-v2. Batch sizes were maximized for each run, given the corresponding compute constraints.

Below we visualize a protein Performer model, trained using the ReLU-based approximate attention mechanism. Using the Performer to estimate similarity between amino acids recovers similar structure to well-known substitution matrices obtained by analyzing evolutionary substitution patterns across carefully curated sequence alignments. More generally, we find local and global attention patterns consistent with Transformer models trained on protein data. The dense attention approximation of the Performer has the potential to capture global interactions across multiple protein sequences. As a proof of concept, we train models on long concatenated protein sequences, which overloads the memory of a regular Transformer model, but not the Performer due to its space efficiency.

Left: Amino acid similarity matrix estimated from attention weights. The model recognizes highly similar amino acid pairs such as (D,E) and (F,Y), despite only having access to protein sequences without prior information about biochemistry. Center: Attention matrices from 4 layers (rows) and 3 selected heads (columns) for the BPT1_BOVIN protein, showing local and global attention patterns.
Performance on sequences up to length 8192 obtained by concatenating individual protein sequences. To fit into TPU memory, the Transformer’s size (number of layers and embedding dimensions) was reduced.

Conclusion
Our work contributes to the recent efforts on non-sparsity based methods and kernel-based interpretations of Transformers. Our method is interoperable with other techniques like reversible layers and we have even integrated FAVOR with the Reformer’s code. We provide the links for the paper, Performer code, and the Protein Language Modeling code. We believe that our research opens up a brand new way of thinking about attention, Transformer architectures, and even kernel methods.

Acknowledgements
This work was performed by the core Performer designers Krzysztof Choromanski (Google Brain Team, Tech and Research Lead), Valerii Likhosherstov (University of Cambridge) and Xingyou Song (Google Brain Team), with contributions from David Dohan, Andreea Gane, Tamas Sarlos, Peter Hawkins, Jared Davis, Afroz Mohiuddin, Lukasz Kaiser, David Belanger, Lucy Colwell, and Adrian Weller. We give special thanks to the Applied Science Team for jointly leading the research effort on applying efficient Transformer architectures to protein sequence data.

We additionally wish to thank Joshua Meier, John Platt, and Tom Weingarten for many fruitful discussions on biological data and useful comments on this draft, along with Yi Tay and Mostafa Dehghani for discussions on comparing baselines. We further thank Nikita Kitaev and Wojciech Gajewski for multiple discussions on the Reformer, and Aurko Roy and Ashish Vaswani for multiple discussions on the Routing Transformer.

Announcing the Recipients of the 2020 Award for Inclusion Research

At Google, it is our ongoing goal to support faculty who are conducting innovative research that will have positive societal impact. As part of that goal, earlier this year we launched the Award for Inclusion Research program, a global program that supports academic research in computing and technology addressing the needs of underrepresented populations. The Award for Inclusion Research program allows faculty and Google researchers an opportunity to partner on their research initiatives and build new and constructive long-term relationships.

We received 100+ applications from over 100 universities, globally, and today we are excited to announce the 16 proposals chosen for funding, focused on an array of topics around diversity and inclusion, algorithmic bias, education innovation, health tools, accessibility, gender bias, AI for social good, security, and social justice. The proposals include 25 principal investigators who focus on making the community stronger through their research efforts.

Congratulations to announce this year’s recipients:

"Human Centred Technology Design for Social Justice in Africa"
Anicia Peters (University of Namibia) and Shaimaa Lazem (City for Scientific Research and Technological Applications, Egypt)

"Modern NLP for Regional and Dialectal Language Variants"
Antonios Anastasopoulos (George Mason University)

"Culturally Relevant Collaborative Health Tracking Tools for Motivating Heart-Healthy Behaviors Among African Americans"
Aqueasha Martin-Hammond (Indiana University - Purdue University Indianapolis) and Tanjala S. Purnell (Johns Hopkins University)

"Characterizing Energy Equity in the United States"
Destenie Nock and Constantine Samaras (Carnegie Mellon University)

"Developing a Dialogue System for a Culturally-Responsive Social Programmable Robot"
Erin Walker (University of Pittsburgh) and Leshell Hatley (Coppin State University)

"Eliminating Gender Bias in NLP Beyond English"
Hinrich Schuetze (LMU Munich)

"The Ability-Based Design Mobile Toolkit: Enabling Accessible Mobile Interactions through Advanced Sensing and Modeling"
Jacob O. Wobbrock (University of Washington)

"Mutual aid and community engagement: Community-based mechanisms against algorithmic bias"
Jasmine McNealy (University of Florida)

"Empowering Syrian Girls through Culturally Sensitive Mobile Technology and Media Literacy
Karen Elizabeth Fisher (University of Washington) and Yacine Ghamri-Doudane (University of La Rochelle)

"Broadening participation in data science through examining the health, social, and economic impacts of gentrification"
Latifa Jackson (Howard University) and Hasan Jackson (Howard University)

"Understanding How Peer and Near Peer Mentors co-Facilitating the Active Learning Process of Introductory Data Structures Within an Immersive Summer Experience Effected Rising Sophomore Computer Science Student Persistence and Preparedness for Careers in Silicon Valley"
Legand Burge (Howard University) and Marlon Mejias (University of North Carolina at Charlotte)

"Who is Most Likely to Advocate for this Case? A Machine Learning Approach"
Maria De-Arteaga (University of Texas at Austin)

"Contextual Rendering of Equations for Visually Impaired Persons"
Meenakshi Balakrishnan (Indian Institute of Technology Delhi, India) and Volker Sorge (University of Birmingham)

"Measuring the Cultural Competence of Computing Students and Faculty Nationwide to Improve Diversity, Equity, and Inclusion"
Nicki Washington (Duke University)

"Designing and Building Collaborative Tools for Mixed-Ability Programming Teams"
Steve Oney (University of Michigan)

"Iterative Design of a Black Studies Research Computing Initiative through `Flipped Research’"
Timothy Sherwood and Sharon Tettegah (University of California, Santa Barbara)

Source: Google AI Blog


Recreating Historical Streetscapes Using Deep Learning and Crowdsourcing

For many, gazing at an old photo of a city can evoke feelings of both nostalgia and wonder — what was it like to walk through Manhattan in the 1940s? How much has the street one grew up on changed? While Google Street View allows people to see what an area looks like in the present day, what if you want to explore how places looked in the past?

To create a rewarding “time travel” experience for both research and entertainment purposes, we are launching (pronounced as re”turn"), an open source, scalable system running on Google Cloud and Kubernetes that can reconstruct cities from historical maps and photos, representing an implementation of our suite of open source tools launched earlier this year. Referencing the common prefix meaning again or anew, is meant to represent the themes of reconstruction, research, recreation and remembering behind this crowdsourced research effort, and consists of three components:

  • A crowdsourcing platform, which allows users to upload historical maps of cities, georectify (i.e., match them to real world coordinates), and vectorize them
  • A temporal map server, which shows how maps of cities change over time
  • A 3D experience platform, which runs on top of the map server, creating the 3D experience by using deep learning to reconstruct buildings in 3D from limited historical images and maps data.

Our goal is for to become a compendium that allows history enthusiasts to virtually experience historical cities around the world, aids researchers, policy makers and educators, and provides a dose of nostalgia to everyday users.

Bird’s eye view of Chelsea, Manhattan with a time slider from 1890 to 1970, crafted from historical photos and maps and using ’s 3D reconstruction pipeline and colored with a preset Manhattan-inspired palette.

Crowdsourcing Data from Historical Maps
Reconstructing how cities used to look at scale is a challenge — historical image data is more difficult to work with than modern data, as there are far fewer images available and much less metadata captured from the images. To help with this difficulty, the maps module is a suite of open source tools that work together to create a map server with a time dimension, allowing users to jump back and forth between time periods using a slider. These tools allow users to upload scans of historical print maps, georectify them to match real world coordinates, and then convert them to vector format by tracing their geographic features. These vectorized maps are then served on a tile server and rendered as slippy maps, which lets the user zoom in and pan around.

Sub-modules of the suite of tools

The entry point of the maps module is Warper, a web app that allows users to upload historical images of maps and georectify them by finding control points on the historical map and corresponding points on a base map. The next app, Editor, allows users to load the georectified historical maps as the background and then trace their geographic features (e.g., building footprints, roads, etc.). This traced data is stored in an OpenStreetMap (OSM) vector format. They are then converted to vector tiles and served from the Server app, a vector tile server. Finally, our map renderer, Kartta, visualizes the spatiotemporal vector tiles allowing the users to navigate space and time on historical maps. These tools were built on top of numerous open source resources including OpenStreetMap, and we intend for our tools and data to be completely open source as well.

Warper and Editor work together to let users upload a map, anchor it to a base map using control points, and trace geographic features like building footprints and roads.

3D Experience
The 3D Models module aims to reconstruct the detailed full 3D structures of historical buildings using the associated images and maps data, organize these 3D models properly in one repository, and render them on the historical maps with a time dimension.

In many cases, there is only one historical image available for a building, which makes the 3D reconstruction an extremely challenging problem. To tackle this challenge, we developed a coarse-to-fine reconstruction-by-recognition algorithm.

High-level overview of ’s 3D reconstruction pipeline, which takes annotated images and maps and prepares them for 3D rendering.

Starting with footprints on maps and façade regions in historical images (both are annotated by crowdsourcing or detected by automatic algorithms), the footprint of one input building is extruded upwards to generate its coarse 3D structure. The height of this extrusion is set to the number of floors from the corresponding metadata in the maps database.

In parallel, instead of directly inferring the detailed 3D structures of each façade as one entity, the 3D reconstruction pipeline recognizes all individual constituent components (e.g., windows, entries, stairs, etc.) and reconstructs their 3D structures separately based on their categories. Then these detailed 3D structures are merged with the coarse one for the final 3D mesh. The results are stored in a 3D repository and ready for 3D rendering.

The key technology powering this feature is a number of state-of-art deep learning models:

  • Faster region-based convolutional neural networks (RCNN) were trained using the façade component annotations for each target semantic class (e.g., windows, entries, stairs, etc), which are used to localize bounding-box level instances in historical images.
  • DeepLab, a semantic segmentation model, was trained to provide pixel-level labels for each semantic class.
  • A specifically designed neural network was trained to enforce high-level regularities within the same semantic class. This ensured that windows generated on a façade were equally spaced and consistent in shape with each other. This also facilitated consistency across different semantic classes such as stairs to ensure they are placed at reasonable positions and have consistent dimensions relative to the associated entry ways.

Key Results

Street level view of 3D-reconstructed Chelsea, Manhattan

Conclusion
With , we have developed tools that facilitate crowdsourcing to tackle the main challenge of insufficient historical data when recreating virtual cities. The 3D experience is still a work-in-progress and we aim to improve it with future updates. We hope acts as a nexus for an active community of enthusiasts and casual users that not only utilizes our historical datasets and open source code, but actively contributes to both.

Acknowledgements
This effort has been successful thanks to the hard work of many people, including, but not limited to the following (in alphabetical order of last name): Yale Cong, Feng Han, Amol Kapoor, Raimondas Kiveris, Brandon Mayer, Mark Phillips, Sasan Tavakkol, and Tim Waters (Waters Geospatial Ltd).

Source: Google AI Blog


Measuring Gendered Correlations in Pre-trained NLP Models

Natural language processing (NLP) has seen significant progress over the past several years, with pre-trained models like BERT, ALBERT, ELECTRA, and XLNet achieving remarkable accuracy across a variety of tasks. In pre-training, representations are learned from a large text corpus, e.g., Wikipedia, by repeatedly masking out words and trying to predict them (this is called masked language modeling). The resulting representations encode rich information about language and correlations between concepts, such as surgeons and scalpels. There is then a second training stage, fine-tuning, in which the model uses task-specific training data to learn how to use the general pre-trained representations to do a concrete task, like classification. Given the broad adoption of these representations in many NLP tasks, it is crucial to understand the information encoded in them and how any learned correlations affect performance downstream, to ensure the application of these models aligns with our AI Principles.

In “Measuring and Reducing Gendered Correlations in Pre-trained Models” we perform a case study on BERT and its low-memory counterpart ALBERT, looking at correlations related to gender, and formulate a series of best practices for using pre-trained language models. We present experimental results over public model checkpoints and an academic task dataset to illustrate how the best practices apply, providing a foundation for exploring settings beyond the scope of this case study. We will soon release a series of checkpoints, Zari1, which reduce gendered correlations while maintaining state-of-the-art accuracy on standard NLP task metrics.

Measuring Correlations
To understand how correlations in pre-trained representations can affect downstream task performance, we apply a diverse set of evaluation metrics for studying the representation of gender. Here, we’ll discuss results from one of these tests, based on coreference resolution, which is the capability that allows models to understand the correct antecedent to a given pronoun in a sentence. For example, in the sentence that follows, the model should recognize his refers to the nurse, and not to the patient.

The standard academic formulation of the task is the OntoNotes test (Hovy et al., 2006), and we measure how accurate a model is at coreference resolution in a general setting using an F1 score over this data (as in Tenney et al. 2019). Since OntoNotes represents only one data distribution, we also consider the WinoGender benchmark that provides additional, balanced data designed to identify when model associations between gender and profession incorrectly influence coreference resolution. High values of the WinoGender metric (close to one) indicate a model is basing decisions on normative associations between gender and profession (e.g., associating nurse with the female gender and not male). When model decisions have no consistent association between gender and profession, the score is zero, which suggests that decisions are based on some other information, such as sentence structure or semantics.

BERT and ALBERT metrics on OntoNotes (accuracy) and WinoGender (gendered correlations). Low values on the WinoGender metric indicate that a model does not preferentially use gendered correlations in reasoning.

In this study, we see that neither the (Large) BERT or ALBERT public model achieves zero score on the WinoGender examples, despite achieving impressive accuracy on OntoNotes (close to 100%). At least some of this is due to models preferentially using gendered correlations in reasoning. This isn’t completely surprising: there are a range of cues available to understand text and it is possible for a general model to pick up on any or all of these. However, there is reason for caution, as it is undesirable for a model to make predictions primarily based on gendered correlations learned as priors rather than the evidence available in the input.

Best Practices
Given that it is possible for unintended correlations in pre-trained model representations to affect downstream task reasoning, we now ask: what can one do to mitigate any risk this poses when developing new NLP models?

  • It is important to measure for unintended correlations: Model quality may be assessed using accuracy metrics, but these only measure one dimension of performance, especially if the test data is drawn from the same distribution as the training data. For example, the BERT and ALBERT checkpoints have accuracy within 1% of each other, but differ by 26% (relative) in the degree to which they use gendered correlations for coreference resolution. This difference might be important for some tasks; selecting a model with low WinoGender score could be desirable in an application featuring texts about people in professions that may not conform to historical social norms, e.g., male nurses.
  • Be careful even when making seemingly innocuous configuration changes: Neural network model training is controlled by many hyperparameters that are usually selected to maximize some training objective. While configuration choices often seem innocuous, we find they can cause significant changes for gendered correlations, both for better and for worse. For example, dropout regularization is used to reduce overfitting by large models. When we increase the dropout rate used for pre-training BERT and ALBERT, we see a significant reduction in gendered correlations even after fine-tuning. This is promising since a simple configuration change allows us to train models with reduced risk of harm, but it also shows that we should be mindful and evaluate carefully when making any change in model configuration.
    Impact of increasing dropout regularization in BERT and ALBERT.
  • There are opportunities for general mitigations: A further corollary from the perhaps unexpected impact of dropout on gendered correlations is that it opens the possibility to use general-purpose methods for reducing unintended correlations: by increasing dropout in our study, we improve how the models reason about WinoGender examples without manually specifying anything about the task or changing the fine-tuning stage at all. Unfortunately, OntoNotes accuracy does start to decline as the dropout rate increases (which we can see in the BERT results), but we are excited about the potential to mitigate this in pre-training, where changes can lead to model improvements without the need for task-specific updates. We explore counterfactual data augmentation as another mitigation strategy with different tradeoffs in our paper.

What’s Next
We believe these best practices provide a starting point for developing robust NLP systems that perform well across the broadest possible range of linguistic settings and applications. Of course these techniques on their own are not sufficient to capture and remove all potential issues. Any model deployed in a real-world setting should undergo rigorous testing that considers the many ways it will be used, and implement safeguards to ensure alignment with ethical norms, such as Google's AI Principles. We look forward to developments in evaluation frameworks and data that are more expansive and inclusive to cover the many uses of language models and the breadth of people they aim to serve.

Acknowledgements
This is joint work with Xuezhi Wang, Ian Tenney, Ellie Pavlick, Alex Beutel, Jilin Chen, Emily Pitler, and Slav Petrov. We benefited greatly throughout the project from discussions with Fernando Pereira, Ed Chi, Dipanjan Das, Vera Axelrod, Jacob Eisenstein, Tulsee Doshi, and James Wexler.


1 Zari is an Afghan Muppet designed to show that ‘a little girl could do as much as everybody else’.

Source: Google AI Blog