Tag Archives: Graph Mining

Graph neural networks in TensorFlow

Objects and their relationships are ubiquitous in the world around us, and relationships can be as important to understanding an object as its own attributes viewed in isolation — take for example transportation networks, production networks, knowledge graphs, or social networks. Discrete mathematics and computer science have a long history of formalizing such networks as graphs, consisting of nodes connected by edges in various irregular ways. Yet most machine learning (ML) algorithms allow only for regular and uniform relations between input objects, such as a grid of pixels, a sequence of words, or no relation at all.

Graph neural networks, or GNNs for short, have emerged as a powerful technique to leverage both the graph’s connectivity (as in the older algorithms DeepWalk and Node2Vec) and the input features on the various nodes and edges. GNNs can make predictions for graphs as a whole (Does this molecule react in a certain way?), for individual nodes (What’s the topic of this document, given its citations?) or for potential edges (Is this product likely to be purchased together with that product?). Apart from making predictions about graphs, GNNs are a powerful tool used to bridge the chasm to more typical neural network use cases. They encode a graph's discrete, relational information in a continuous way so that it can be included naturally in another deep learning system.

We are excited to announce the release of TensorFlow GNN 1.0 (TF-GNN), a production-tested library for building GNNs at large scales. It supports both modeling and training in TensorFlow as well as the extraction of input graphs from huge data stores. TF-GNN is built from the ground up for heterogeneous graphs, where types of objects and relations are represented by distinct sets of nodes and edges. Real-world objects and their relations occur in distinct types, and TF-GNN's heterogeneous focus makes it natural to represent them.

Inside TensorFlow, such graphs are represented by objects of type tfgnn.GraphTensor. This is a composite tensor type (a collection of tensors in one Python class) accepted as a first-class citizen in tf.data.Dataset, tf.function, etc. It stores both the graph structure and its features attached to nodes, edges and the graph as a whole. Trainable transformations of GraphTensors can be defined as Layers objects in the high-level Keras API, or directly using the tfgnn.GraphTensor primitive.


GNNs: Making predictions for an object in context

For illustration, let’s look at one typical application of TF-GNN: predicting a property of a certain type of node in a graph defined by cross-referencing tables of a huge database. For example, a citation database of Computer Science (CS) arXiv papers with one-to-many cites and many-to-one cited relationships where we would like to predict the subject area of each paper.

Like most neural networks, a GNN is trained on a dataset of many labeled examples (~millions), but each training step consists only of a much smaller batch of training examples (say, hundreds). To scale to millions, the GNN gets trained on a stream of reasonably small subgraphs from the underlying graph. Each subgraph contains enough of the original data to compute the GNN result for the labeled node at its center and train the model. This process — typically referred to as subgraph sampling — is extremely consequential for GNN training. Most existing tooling accomplishes sampling in a batch way, producing static subgraphs for training. TF-GNN provides tooling to improve on this by sampling dynamically and interactively.

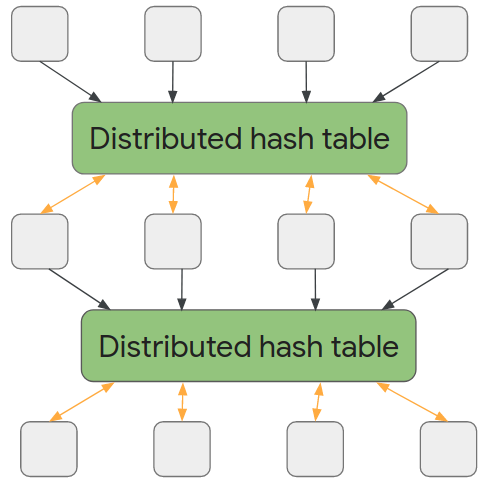
Pictured, the process of subgraph sampling where small, tractable subgraphs are sampled from a larger graph to create input examples for GNN training.

TF-GNN 1.0 debuts a flexible Python API to configure dynamic or batch subgraph sampling at all relevant scales: interactively in a Colab notebook (like this one), for efficient sampling of a small dataset stored in the main memory of a single training host, or distributed by Apache Beam for huge datasets stored on a network filesystem (up to hundreds of millions of nodes and billions of edges). For details, please refer to our user guides for in-memory and beam-based sampling, respectively.

On those same sampled subgraphs, the GNN’s task is to compute a hidden (or latent) state at the root node; the hidden state aggregates and encodes the relevant information of the root node's neighborhood. One classical approach is message-passing neural networks. In each round of message passing, nodes receive messages from their neighbors along incoming edges and update their own hidden state from them. After n rounds, the hidden state of the root node reflects the aggregate information from all nodes within n edges (pictured below for n = 2). The messages and the new hidden states are computed by hidden layers of the neural network. In a heterogeneous graph, it often makes sense to use separately trained hidden layers for the different types of nodes and edges

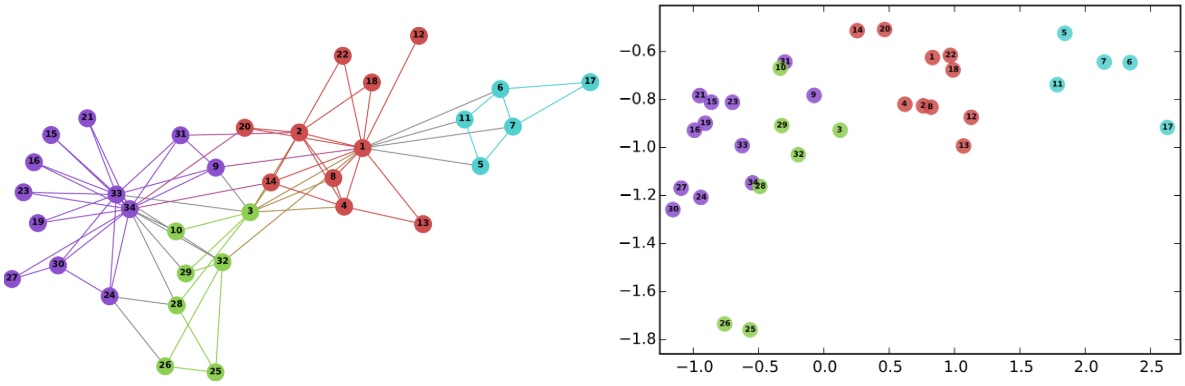
Pictured, a simple message-passing neural network where, at each step, the node state is propagated from outer to inner nodes where it is pooled to compute new node states. Once the root node is reached, a final prediction can be made.

The training setup is completed by placing an output layer on top of the GNN’s hidden state for the labeled nodes, computing the loss (to measure the prediction error), and updating model weights by backpropagation, as usual in any neural network training.

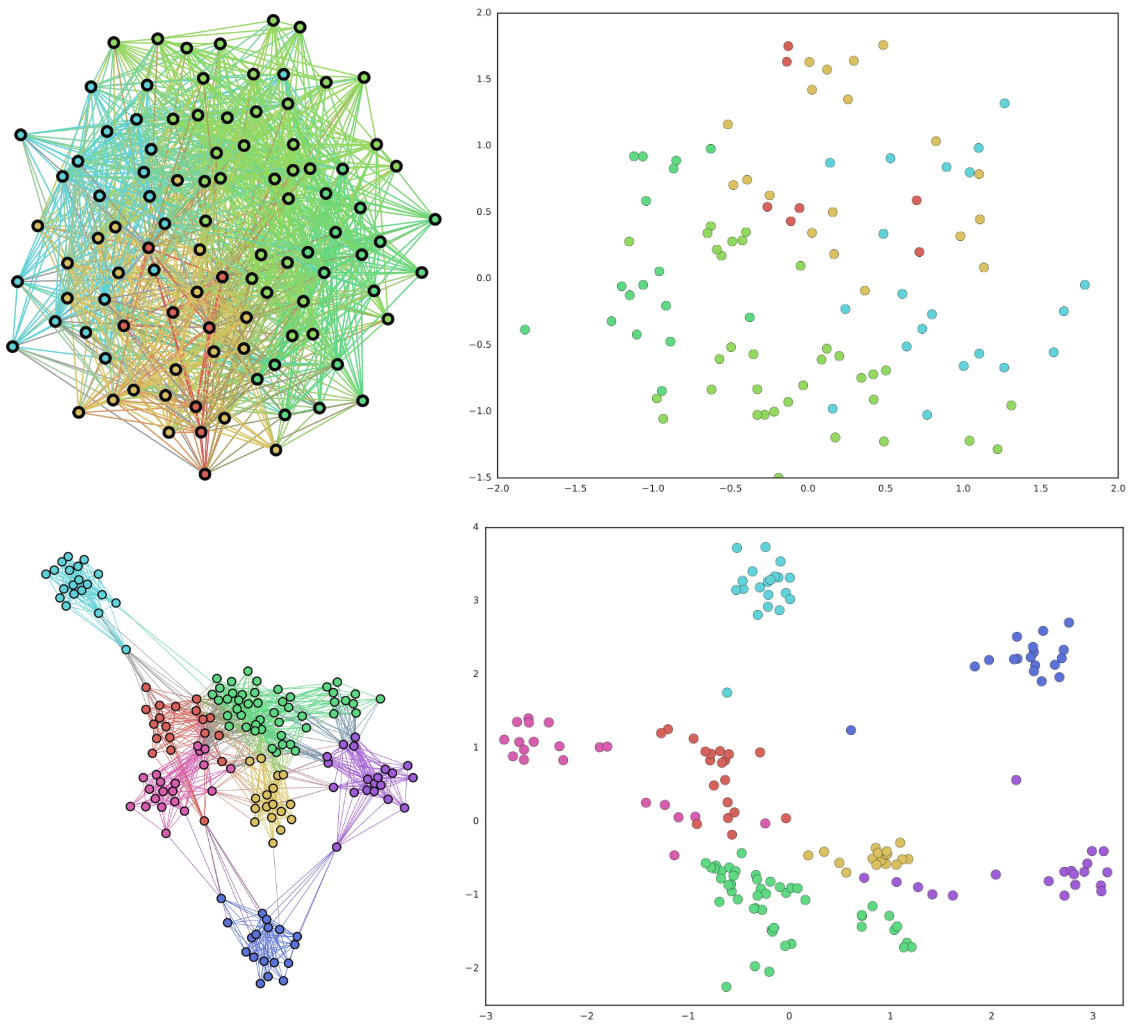
Beyond supervised training (i.e., minimizing a loss defined by labels), GNNs can also be trained in an unsupervised way (i.e., without labels). This lets us compute a continuous representation (or embedding) of the discrete graph structure of nodes and their features. These representations are then typically utilized in other ML systems. In this way, the discrete, relational information encoded by a graph can be included in more typical neural network use cases. TF-GNN supports a fine-grained specification of unsupervised objectives for heterogeneous graphs.


Building GNN architectures

The TF-GNN library supports building and training GNNs at various levels of abstraction.

At the highest level, users can take any of the predefined models bundled with the library that are expressed in Keras layers. Besides a small collection of models from the research literature, TF-GNN comes with a highly configurable model template that provides a curated selection of modeling choices that we have found to provide strong baselines on many of our in-house problems. The templates implement GNN layers; users need only to initialize the Keras layers.

At the lowest level, users can write a GNN model from scratch in terms of primitives for passing data around the graph, such as broadcasting data from a node to all its outgoing edges or pooling data into a node from all its incoming edges (e.g., computing the sum of incoming messages). TF-GNN’s graph data model treats nodes, edges and whole input graphs equally when it comes to features or hidden states, making it straightforward to express not only node-centric models like the MPNN discussed above but also more general forms of GraphNets. This can, but need not, be done with Keras as a modeling framework on the top of core TensorFlow. For more details, and intermediate levels of modeling, see the TF-GNN user guide and model collection.


Training orchestration

While advanced users are free to do custom model training, the TF-GNN Runner also provides a succinct way to orchestrate the training of Keras models in the common cases. A simple invocation may look like this:

The Runner provides ready-to-use solutions for ML pains like distributed training and tfgnn.GraphTensor padding for fixed shapes on Cloud TPUs. Beyond training on a single task (as shown above), it supports joint training on multiple (two or more) tasks in concert. For example, unsupervised tasks can be mixed with supervised ones to inform a final continuous representation (or embedding) with application specific inductive biases. Callers only need substitute the task argument with a mapping of tasks:

Additionally, the TF-GNN Runner also includes an implementation of integrated gradients for use in model attribution. Integrated gradients output is a GraphTensor with the same connectivity as the observed GraphTensor but its features replaced with gradient values where larger values contribute more than smaller values in the GNN prediction. Users can inspect gradient values to see which features their GNN uses the most.


Conclusion

In short, we hope TF-GNN will be useful to advance the application of GNNs in TensorFlow at scale and fuel further innovation in the field. If you’re curious to find out more, please try our Colab demo with the popular OGBN-MAG benchmark (in your browser, no installation required), browse the rest of our user guides and Colabs, or take a look at our paper.


Acknowledgements

The TF-GNN release 1.0 was developed by a collaboration between Google Research: Sami Abu-El-Haija, Neslihan Bulut, Bahar Fatemi, Johannes Gasteiger, Pedro Gonnet, Jonathan Halcrow, Liangze Jiang, Silvio Lattanzi, Brandon Mayer, Vahab Mirrokni, Bryan Perozzi, Anton Tsitsulin, Dustin Zelle, Google Core ML: Arno Eigenwillig, Oleksandr Ferludin, Parth Kothari, Mihir Paradkar, Jan Pfeifer, Rachael Tamakloe, and Google DeepMind: Alvaro Sanchez-Gonzalez and Lisa Wang.

Source: Google AI Blog


Teaching old labels new tricks in heterogeneous graphs

Industrial applications of machine learning are commonly composed of various items that have differing data modalities or feature distributions. Heterogeneous graphs (HGs) offer a unified view of these multimodal data systems by defining multiple types of nodes (for each data type) and edges (for the relation between data items). For instance, e-commerce networks might have [user, product, review] nodes or video platforms might have [channel, user, video, comment] nodes. Heterogeneous graph neural networks (HGNNs) learn node embeddings summarizing each node’s relationships into a vector. However, in real world HGs, there is often a label imbalance issue between different node types. This means that label-scarce node types cannot exploit HGNNs, which hampers the broader applicability of HGNNs.

In “Zero-shot Transfer Learning within a Heterogeneous Graph via Knowledge Transfer Networks”, presented at NeurIPS 2022, we propose a model called a Knowledge Transfer Network (KTN), which transfers knowledge from label-abundant node types to zero-labeled node types using the rich relational information given in a HG. We describe how we pre-train a HGNN model without the need for fine-tuning. KTNs outperform state-of-the-art transfer learning baselines by up to 140% on zero-shot learning tasks, and can be used to improve many existing HGNN models on these tasks by 24% (or more).

KTNs transform labels from one type of information (squares) through a graph to another type (stars).


What is a heterogeneous graph?

A HG is composed of multiple node and edge types. The figure below shows an e-commerce network presented as a HG. In e-commerce, “users” purchase “products” and write “reviews”. A HG presents this ecosystem using three node types [user, product, review] and three edge types [user-buy-product, user-write-review, review-on-product]. Individual products, users, and reviews are then presented as nodes and their relationships as edges in the HG with the corresponding node and edge types.

E-commerce heterogeneous graph.

In addition to all connectivity information, HGs are commonly given with input node attributes that summarize each node’s information. Input node attributes could have different modalities across different node types. For instance, images of products could be given as input node attributes for the product nodes, while text can be given as input attributes to review nodes. Node labels (e.g., the category of each product or the category that most interests each user) are what we want to predict on each node.


HGNNs and label scarcity issues

HGNNs compute node embeddings that summarize each node’s local structures (including the node and its neighbor’s information). These node embeddings are utilized by a classifier to predict each node’s label. To train a HGNN model and a classifier to predict labels for a specific node type, we require a good amount of labels for the type.

A common issue in industrial applications of deep learning is label scarcity, and with their diverse node types, HGNNs are even more likely to face this challenge. For instance, publicly available content node types (e.g., product nodes) are abundantly labeled, whereas labels for user or account nodes may not be available due to privacy restrictions. This means that in most standard training settings, HGNN models can only learn to make good inferences for a few label-abundant node types and can usually not make any inferences for any remaining node types (given the absence of any labels for them).


Transfer learning on heterogeneous graphs

Zero-shot transfer learning is a technique used to improve the performance of a model on a target domain with no labels by using the knowledge learned by the model from another related source domain with adequately labeled data. To apply transfer learning to solve this label scarcity issue for certain node types in HGs, the target domain would be the zero-labeled node types. Then what would be the source domain? Previous work commonly sets the source domain as the same type of nodes located in a different HG, assuming those nodes are abundantly labeled. This graph-to-graph transfer learning approach pre-trains a HGNN model on the external HG and then runs the model on the original (label-scarce) HG.

However, these approaches are not applicable in many real-world scenarios for three reasons. First, any external HG that could be used in a graph-to-graph transfer learning setting would almost surely be proprietary, thus, likely unavailable. Second, even if practitioners could obtain access to an external HG, it is unlikely the distribution of that source HG would match their target HG well enough to apply transfer learning. Finally, node types suffering from label scarcity are likely to suffer the same issue on other HGs (e.g., privacy issues on user nodes).


Our approach: Transfer learning between node types within a heterogeneous graph

Here, we shed light on a more practical source domain, other node types with abundant labels located on the same HG. Instead of using extra HGs, we transfer knowledge within a single HG (assumed to be fully owned by the practitioners) across different types of nodes. More specifically, we pre-train a HGNN model and a classifier on a label-abundant (source) node type, then reuse the models on the zero-labeled (target) node types located in the same HG without additional fine-tuning. The one requirement is that the source and target node types share the same label set (e.g., in the e-commerce HG, product nodes have a label set describing product categories, and user nodes share the same label set describing their favorite shopping categories).


Why is it challenging?

Unfortunately, we cannot directly reuse the pre-trained HGNN and classifier on the target node type. One crucial characteristic of HGNN architectures is that they are composed of modules specialized to each node type to fully learn the multiplicity of HGs. HGNNs use distinct sets of modules to compute embeddings for each node type. In the figure below, blue- and red-colored modules are used to compute node embeddings for the source and target node types, respectively.

HGNNs are composed of modules specialized to each node type and use distinct sets of modules to compute embeddings of different node types. More details can be found in the paper.

While pre-training HGNNs on the source node type, source-specific modules in the HGNNs are well trained, however target-specific modules are under-trained as they have only a small amount of gradients flowing into them. This is shown below, where we see that the L2 norm of gradients for target node types (i.e., Mtt) are much lower than for source types (i.e., Mss). In this case a HGNN model outputs poor node embeddings for the target node type, which results in poor task performance.

In HGNNs, target type-specific modules receive zero or only a small amount of gradients during pre-training on the source node type, leading to poor performance on the target node type.

KTN: Trainable cross-type transfer learning for HGNNs

Our work focuses on transforming the (poor) target node embeddings computed by a pre-trained HGNN model to follow the distribution of the source node embeddings. Then the classifier, pre-trained on the source node type, can be reused for the target node type. How can we map the target node embeddings to the source domain? To answer this question, we investigate how HGNNs compute node embeddings to learn the relationship between source and target distributions.

HGNNs aggregate connected node embeddings to augment a target node’s embeddings in each layer. In other words, the node embeddings for both source and target node types are updated using the same input — the previous layer’s node embeddings of any connected node types. This means that they can be represented by each other. We prove this relationship theoretically and find there is a mapping matrix (defined by HGNN parameters) from the target domain to the source domain (more details in Theorem 1 in the paper). Based on this theorem, we introduce an auxiliary neural network, which we refer to as a Knowledge Transfer Network (KTN), that receives the target node embeddings and then transforms them by multiplying them with a (trainable) mapping matrix. We then define a regularizer that is minimized along with the performance loss in the pre-training phase to train the KTN. At test time, we map the target embeddings computed from the pre-trained HGNN to the source domain using the trained KTN for classification.

In HGNNs, the final node embeddings of both source and target types are computed from different mathematical functions (f(): source, g(): target) which use the same input — the previous layer’s node embeddings.

Experimental results

To examine the effectiveness of KTNs, we ran 18 different zero-shot transfer learning tasks on two public heterogeneous graphs, Open Academic Graph and Pubmed. We compare KTN with eight state-of-the-art transfer learning methods (DAN, JAN, DANN, CDAN, CDAN-E, WDGRL, LP, EP). Shown below, KTN consistently outperforms all baselines on all tasks, beating transfer learning baselines by up to 140% (as measured by Normalized Discounted Cumulative Gain, a ranking metric).

Zero-shot transfer learning on Open Academic Graph (OAG-CS) and Pubmed datasets. The colors represent different categories of transfer learning baselines against which the results are compared. Yellow: Use statistical properties (e.g., mean, variance) of distributions. Green: Use adversarial models to transfer knowledge. Orange: Transfer knowledge directly via graph structure using label propagation.

Most importantly, KTN can be applied to almost all HGNN models that have node and edge type-specific parameters and improve their zero-shot performance on target domains. As shown below, KTN improves accuracy on zero-labeled node types across six different HGNN models(R-GCN, HAN, HGT, MAGNN, MPNN, H-MPNN) by up to 190%.

KTN can be applied to six different HGNN models and improve their zero-shot performance on target domains.

Takeaways

Various ecosystems in industry can be presented as heterogeneous graphs. HGNNs summarize heterogeneous graph information into effective representations. However, label scarcity issues on certain types of nodes prevent the wider application of HGNNs. In this post, we introduced KTN, the first cross-type transfer learning method designed for HGNNs. With KTN, we can fully exploit the richness of heterogeneous graphs via HGNNs regardless of label scarcity. See the paper for more details.


Acknowledgements

This paper is joint work with our co-authors John Palowitch (Google Research), Dustin Zelle (Google Research), Ziniu Hu (Intern, Google Research), and Russ Salakhutdinov (CMU). We thank Tom Small for creating the animated figure in this blog post.

Source: Google AI Blog


GraphWorld: Advances in Graph Benchmarking

Graphs are very common representations of natural systems that have connected relational components, such as social networks, traffic infrastructure, molecules, and the internet. Graph neural networks (GNNs) are powerful machine learning (ML) models for graphs that leverage their inherent connections to incorporate context into predictions about items within the graph or the graph as a whole. GNNs have been effectively used to discover new drugs, help mathematicians prove theorems, detect misinformation, and improve the accuracy of arrival time predictions in Google Maps.

A surge of interest in GNNs during the last decade has produced thousands of GNN variants, with hundreds introduced each year. In contrast, methods and datasets for evaluating GNNs have received far less attention. Many GNN papers re-use the same 5–10 benchmark datasets, most of which are constructed from easily labeled academic citation networks and molecular datasets. This means that the empirical performance of new GNN variants can be claimed only for a limited class of graphs. Confounding this issue are recently published works with rigorous experimental designs that cast doubt on the performance rankings of popular GNN models reported in seminal papers.

Recent workshops and conference tracks devoted to GNN benchmarking have begun addressing these issues. The recently-introduced Open Graph Benchmark (OGB) is an open-source package for benchmarking GNNs on a handful of massive-scale graph datasets across a variety of tasks, facilitating consistent GNN experimental design. However, the OGB datasets are sourced from many of the same domains as existing datasets, such as citation and molecular networks. This means that OGB does not solve the dataset variety problem we mention above. Therefore, we ask: how can the GNN research community keep up with innovation by experimenting on graphs with the large statistical variance seen in the real-world?

To match the scale and pace of GNN research, in “GraphWorld: Fake Graphs Bring Real Insights for GNNs”, we introduce a methodology for analyzing the performance of GNN architectures on millions of synthetic benchmark datasets. Whereas GNN benchmark datasets featured in academic literature are just individual “locations” on a fully-diverse “world” of potential graphs, GraphWorld directly generates this world using probability models, tests GNN models at every location on it, and extracts generalizable insights from the results. We propose GraphWorld as a complementary GNN benchmark that allows researchers to explore GNN performance on regions of graph space that are not covered by popular academic datasets. Furthermore, GraphWorld is cost-effective, running hundreds-of-thousands of GNN experiments on synthetic data with less computational cost than one experiment on a large OGB dataset.

Illustration of the GraphWorld pipeline. The user provides configurations for the graph generator and the GNN models to test. GraphWorld spawns workers, each one simulating a new graph with diverse properties and testing all specified GNN models. The test metrics from the workers are then aggregated and stored for the user.

The Limited Variety of GNN Benchmark Datasets
To illustrate the motivation for GraphWorld, we compare OGB graphs to a much larger collection (5,000+) of graphs from the Network Repository. While the vast majority of Network Repository graphs are unlabelled, and therefore cannot be used in common GNN experiments, they represent a large space of graphs that are available in the real world. We computed two properties of the OGB and Network Repository graphs: the clustering coefficient (how interconnected nodes are to nearby neighbors) and the degree distribution gini coefficient (the inequality among the nodes' connection counts). We found that OGB datasets exist in a limited and sparsely-populated region of this metric space.

The distribution of graphs from the Open Graph Benchmark does not match the larger population of graphs from the Network Repository.

Dataset Generators in GraphWorld
A researcher using GraphWorld to investigate GNN performance on a given task first chooses a parameterized generator (example below) that can produce graph datasets for stress-testing GNN models on the task. A generator parameter is an input that controls high-level features of the output dataset. GraphWorld uses parameterized generators to produce populations of graph datasets that are varied enough to test the limits of state-of-the-art GNN models.

For instance, a popular task for GNNs is node classification, in which a GNN is trained to infer node labels that represent some unknown property of each node, such as user interests in a social network. In our paper, we chose the well-known stochastic block model (SBM) to generate datasets for this task. The SBM first organizes a pre-set number of nodes into groups or "clusters", which serve as node labels to be classified. It then generates connections between nodes according to various parameters that (each) control a different property of the resulting graph.

One SBM parameter that we expose to GraphWorld is the "homophily" of the clusters, which controls the likelihood that two nodes from the same cluster are connected (relative to two nodes from different clusters). Homophily is a common phenomenon in social networks in which users with similar interests (e.g., the SBM clusters) are more likely to connect. However, not all social networks have the same level of homophily. GraphWorld uses the SBM to generate graphs with high homophily (below on the left), graphs with low homophily (below on the right), and millions more graphs with any level of homophily in-between. This allows a user to analyze GNN performance on graphs with all levels of homophily without depending on the availability of real-world datasets curated by other researchers.

Examples of graphs produced by GraphWorld using the stochastic block model. The left graph has high homophily among node classes (represented by different colors); the right graph has low homophily.

GraphWorld Experiments and Insights
Given a task and parameterized generator for that task, GraphWorld uses parallel computing (e.g., Google Cloud Platform Dataflow) to produce a world of GNN benchmark datasets by sampling the generator parameter values. Simultaneously, GraphWorld tests an arbitrary list of GNN models (chosen by the user, e.g., GCN, GAT, GraphSAGE) on each dataset, and then outputs a massive tabular dataset joining graph properties with the GNN performance results.

In our paper, we describe GraphWorld pipelines for node classification, link prediction, and graph classification tasks, each featuring different dataset generators. We found that each pipeline took less time and computational resources than state-of-the-art experiments on OGB graphs, which means that GraphWorld is accessible to researchers with low budgets.

The animation below visualizes GNN performance data from the GraphWorld node classification pipeline (using the SBM as the dataset generator). To illustrate the impact of GraphWorld, we first map classic academic graph datasets to an x-y plane that measures the cluster homophily (x-axis) and the average of the node degrees (y-axis) within each graph (similar to the scatterplot above that includes the OGB datasets, but with different measurements). Then, we map each simulated graph dataset from GraphWorld to the same plane, and add a third z-axis that measures GNN model performance over each dataset. Specifically, for a particular GNN model (like GCN or GAT), the z-axis measures the mean reciprocal rank of the model against the 13 other GNN models evaluated in our paper, where a value closer to 1 means the model is closer to being the top performer in terms of node classification accuracy.

The animation illustrates two related conclusions. First, GraphWorld generates regions of graph datasets that extend well-beyond the regions covered by the standard datasets. Second, and most importantly, the rankings of GNN models change when graphs become dissimilar from academic benchmark graphs. Specifically, the homophily of classic datasets like Cora and CiteSeer are high, meaning that nodes are well-separated in the graph according to their classes. We find that as GNNs traverse toward the space of less-homophilous graphs, their rankings change quickly. For example, the comparative mean reciprocal rank of GCN moves from higher (green) values in the academic benchmark region to lower (red) values away from that region. This shows that GraphWorld has the potential to reveal critical headroom in GNN architecture development that would be invisible with only the handful of individual datasets that academic benchmarks provide.

Relative performance results of three GNN variants (GCN, APPNP, FiLM) across 50,000 distinct node classification datasets. We find that academic GNN benchmark datasets exist in GraphWorld regions where model rankings do not change. GraphWorld can discover previously unexplored graphs that reveal new insights about GNN architectures.

Conclusion
GraphWorld breaks new ground in GNN experimentation by allowing researchers to scalably test new models on a high-dimensional surface of graph datasets. This allows fine-grained analysis of GNN architectures against graph properties on entire subspaces of graphs that are distal from Cora-like graphs and those in the OGB, which appear only as individual points in a GraphWorld dataset. A key feature of GraphWorld is its low cost, which enables individual researchers without access to institutional resources to quickly understand the empirical performance of new models.

With GraphWorld, researchers can also investigate novel random/generative graph models for more-nuanced GNN experimentation, and potentially use GraphWorld datasets for GNN pre-training. We look forward to supporting these lines of inquiry with our open-source GraphWorld repository and follow-up projects.

Acknowledgements
GraphWorld is joint work with Brandon Mayer and Bryan Perozzi from Google Research. Thanks to Tom Small for visualizations.

Source: Google AI Blog


Massively Parallel Graph Computation: From Theory to Practice

Graphs are useful theoretical representations of the connections between groups of entities, and have been used for a variety of purposes in data science, from ranking web pages by popularity and mapping out social networks, to assisting with navigation. In many cases, such applications require the processing of graphs containing hundreds of billions of edges, which is far too large to be processed on a single consumer-grade machine. A typical approach to scaling graph algorithms is to run in a distributed setting, i.e., to partition the data (and the algorithm) among multiple computers to perform the computation in parallel. While this approach allows one to process graphs with trillions of edges, it also introduces new challenges. Namely, because each computer only sees a small piece of the input graph at a time, one needs to handle inter-machine communication and design algorithms that can be split across multiple computers.

A framework for implementing distributed algorithms, MapReduce, was introduced in 2008. It transparently handled communication between machines while offering good fault-tolerance capabilities and inspired the development of a number of distributed computation frameworks, including Pregel, Apache Hadoop, and many others. Still, the challenge of developing algorithms for distributed computation on very large graphs remained, and designing efficient algorithms in this context even for basic problems, such as connected components, maximum matching or shortest paths, has been an active area of research. While recent work has demonstrated new algorithms for many problems, including our algorithms for connected components (both in theory and practice) and hierarchical clustering, there was still a need for methods that could solve a range of problems more quickly.

Today we present a pair of recent papers that address this problem by first constructing a theoretical model for distributed graph algorithms and then demonstrating how the model can be applied. The proposed model, Adaptive Massively Parallel Computation (AMPC), augments the theoretical capabilities of MapReduce, providing a pathway to solve many graph problems in fewer computation rounds. We also show how the AMPC model can be effectively implemented in practice. The suite of algorithms we describe, which includes algorithms for maximal independent set, maximum matching, connected components and minimum spanning tree, work up to 7x faster than current state-of-the-art approaches.

Limitations of MapReduce
In order to understand the limitations of MapReduce for developing graph algorithms, consider a simplified variant of the connected components problem. The input is a collection of rooted trees, and the goal is to compute, for each node, the root of its tree. Even this seemingly simple problem is not easy to solve in MapReduce. In fact, in the Massively Parallel Computation (MPC) model — the theoretical model behind MapReduce, Pregel, Apache Giraph and many other distributed computation frameworks — this problem is widely believed to require at least a number of rounds of computation proportional to log n, where n is the total number of nodes in the graph. While log n may not seem to be a large number, algorithms processing trillion-edge graphs often write hundreds of terabytes of data to disk in each round, and thus even a small reduction in the number of rounds may bring significant resource savings.

The problem of finding root nodes. Nodes are represented by blue circles. Gray arrows point from each node to its parent. The root nodes are the nodes with no parents. The orange arrows illustrate the path an algorithm would follow from a node to the root of the tree to which it belongs.

A similar subproblem showed up in our algorithms for finding connected components and computing a hierarchical clustering. We observed that one can bypass the limitations of MapReduce by implementing these algorithms through the use of a distributed hash table (DHT), a service that is initialized with a collection of key-value pairs and then returns a value associated with a provided key in real-time. In our implementation, for each node, the DHT stores its parent node. Then, a machine that processes a graph node can use the DHT and “walk up” the tree until it reaches the root. While the use of a DHT worked well for this particular problem (although it relied on the input trees being not too deep), it was unclear if the idea could be applied more broadly.

The Adaptive Massively Parallel Computation Model
To extend this approach to other problems, we started by developing a model to theoretically analyze algorithms that utilize a DHT. The resulting AMPC model builds upon the well-established MPC model and formally describes the capabilities brought by the use of a distributed hash table.

In the MPC model there is a collection of machines, which communicate via message passing in synchronous rounds. Messages sent in one round are delivered in the beginning of the following round and constitute that round’s entire input (i.e., the machines do not retain information from one round to the next). In the first round, one can assume that the input is randomly distributed across the machines. The goal is to minimize the number of computation rounds, while assuring load-balancing between machines in each round.

Computation in the MPC model. Each column represents one machine in subsequent computation rounds. Once all machines have completed a round of computation, all messages sent in that round are delivered, and the following round begins.

We then formalized the AMPC model by introducing a new approach, in which machines write to a write-only distributed hash table each round, instead of communicating via messages. Once a new round starts, the hash table from the previous round becomes read-only and a new write-only output hash table becomes available. What is important is that only the method of communication changes — the amount of communication and available space per machine is constrained exactly in the same way as in the MPC model. Hence, at a high level the added capability of the AMPC model is that each machine can choose what data to read, instead of being provided a piece of data.

Computation in the AMPC model. Once all machines have completed a round of computation, the data they produced is saved to a distributed hash table. In the following round, each machine can read arbitrary values from this distributed hash table and write to a new distributed hash table.

Algorithms and Empirical Evaluation
This seemingly small difference in the way machines communicate allowed us to design much faster algorithms to a number of basic graph problems. In particular, we show that it is possible to find connected components, minimum spanning tree, maximal matching and maximal independent set in a constant number of rounds, regardless of the size of the graph.

To investigate the practical applicability of the AMPC algorithms, we have instantiated the model by combining Flume C++ (a C++ counterpart of FlumeJava) with a DHT communication layer. We have evaluated our AMPC algorithms for minimum spanning tree, maximal independent set and maximum matching and observed that we can achieve up to 7x speedups over implementations that did not use a DHT. At the same time, the AMPC implementations used 10x fewer rounds on average to complete, and also wrote less data to disk.

Our implementation of the AMPC model took advantage of hardware-accelerated remote direct memory access (RDMA), a technology that allows reading from the memory of a remote machine with a latency of a few microseconds, which is just an order of magnitude slower than reading from local memory. While some of the AMPC algorithms communicated more data than their MPC counterparts, they were overall faster, as they performed mostly fast reads using RDMA, instead of costly writes to disk.

Conclusion
With the AMPC model, we built a theoretical framework inspired by practically efficient implementations, and then developed new theoretical algorithms that delivered good empirical performance and maintained good fault-tolerance properties. We've been happy to see that the AMPC model has already been the subject of further study and are excited to learn what other problems can be solved more efficiently using the AMPC model or its practical implementations.

Acknowledgements
Co-authors on the two papers covered in this blog post include Soheil Behnezhad, Laxman Dhulipala, Hossein Esfandiari, and Warren Schudy. We also thank members of the Graph Mining team for their collaborations, and especially Mohammad Hossein Bateni for his input on this post. To learn more about our recent work on scalable graph algorithms, see videos from our recent Graph Mining and Learning workshop.

Source: Google AI Blog


Understanding the Shape of Large-Scale Data


Understanding the differences and similarities between complex datasets is an interesting challenge that often arises when working with data. One way to formalize this question is to view each dataset as a graph, a mathematical model for how items relate to each other. Graphs are widely used to model relationships between objects — the Internet graph connects pages referencing each other, social graphs link together friends, and molecule graphs connect atoms bonding with each other.
Graphs are discrete objects that can model the relationships between many different types of data, including web pages (left), social connections (center), or molecules (right).
Once there is a collection of multiple graphs, it is common to want to predict some property of each one as an aggregate (i.e., one label per graph). For example, consider the task of predicting protein function from structure: each dataset here is one protein, and the prediction task is whether the final structure encodes an enzyme or not. Since one wants a model to actually compute the prediction, we need a representation that lets us generalize across different protein structures. Ideally, one would want a way to represent graphs as vectors without costly labelling. The problem becomes harder with increasing graph size — in the molecule case humans possess some knowledge about their properties, however, reasoning about larger, more complex datasets becomes increasingly difficult.

In this post we highlight some recent advances in the area of graph representation learning with “Just SLaQ When You Approximate: Accurate Spectral Distances for Web-Scale Graphs” (published at WWW'20), a publication that improves on the scalability of our earlier research, “DDGK: Learning Graph Representations for Deep Divergence Graph Kernels” (published at WWW’19). SLaQ introduces a way to scale computations to approximate a certain class of graph statistics, allowing one to quickly and efficiently characterize large graphs. We are also happy to announce that we have released the code for both papers in the Google Research GitHub repository for graph embeddings.

Fully Unsupervised Learning of Graph Similarity
In our 2019 paper, we showed that it is possible to learn representations for graph similarity with neither domain knowledge nor supervision. We propose deep divergence graph kernels (DDGK), an unsupervised method for learning representations over graphs that encode mappings of similarities between them. Unlike previous work, our unsupervised method jointly learns node representations, graph representations, and an attention-based alignment between graphs.
Here is a t-SNE visualization of the latent representations learned by DDGK to compare proteins. Blue points indicate proteins that encode enzymes and the red points are for those that do not. We can see that the encoding correlates with a structural property of the protein (whether or not it encodes enzymes), even though this context was not provided during training. (Note that this is a projection of the representations, and so the absolute axis values aren’t meaningful.)
In the example above, we demonstrate how these representations can automatically learn to represent graphs and align them in a way that encodes their latent functional similarity. Experiments on other datasets show we can capture similarities and differences across graphs of different types (language, biology, and social interactions).
The pairwise distance between different datasets encoded and aligned using DDGK. Color indicates distance in the latent space, and the scale of similarity ranges from 0 (identical) to 1.0 (very different). We see that the representations can be clustered to group similar datasets together — for example, the datasets nci1 and ptc are both datasets of chemical compounds.
Fast and Accurate Approximation of Spectral Descriptors
A graph’s spectrum is a powerful representation that encodes its properties, including connectivity patterns between graph nodes and clustering information. The spectrum has been shown to convey rich information about the properties of different objects such as the sound of a drum, 3D shapes, graphs, and general high-dimensional data. Applications of spectral graph descriptors include AutoML systems, anomaly detection in dynamic graphs, and chemical molecule characterization.

Currently, learning-based systems such as DDGK do not scale to either large graphs or large graph collections. Alternatively, one can use the spectral information without the learning component to attain more desirable scaling properties. However, computing spectral descriptors for large graphs is computationally prohibitive. Our more recent paper addresses this problem by proposing SLaQ, a method for approximating a family of graph descriptors. Our approach uses a randomized approximation algorithm for computing traces of spectrum functions that allows us to study several well-known spectral graph characteristics like Von Neumann Graph Entropy, Estrada Index, graph energy, and NetLSD.

For example, we use SLaQ to monitor anomalous changes in the Wikipedia graph structure. SLaQ allows us to discern meaningful changes in the structure of the page graph from trivial ones such as mass page renames. Our experiments show two orders of magnitude improvement in approximation accuracy, on average.
Left: The well-known Karate graph represents the social interactions of two martial arts clubs. Right: The spectral descriptors (NetLSD, VNGE, and Estrada Index) computed for the original graph in blue and the version with removed edges in red.
Conclusions
Unsupervised representation learning for graphs is an important problem, and we believe that the methods we highlight here are exciting steps forward in this area! Specifically, SLaQ allows us to compute principled representations for vast datasets, and DDGK introduces a mechanism for automatically learning alignments between datasets. We hope that our contributions will help advance the analysis of large datasets, and will be useful for understanding changes to time-varying graph datasets, like those used in recommendation systems.

Acknowledgements
We thank Marina Munkhoeva, Rami Al-Rfou, and Dustin Zelle who contributed to these works. For more information on the Graph Mining team (part of Algorithm and Optimization Group) visit our pages.

Source: Google AI Blog


Innovations in Graph Representation Learning


Relational data representing relationships between entities is ubiquitous on the Web (e.g., online social networks) and in the physical world (e.g., in protein interaction networks). Such data can be represented as a graph with nodes (e.g., users, proteins), and edges connecting them (e.g., friendship relations, protein interactions). Given the widespread prevalence of graphs, graph analysis plays a fundamental role in machine learning, with applications in clustering, link prediction, privacy, and others. To apply machine learning methods to graphs (e.g., predicting new friendships, or discovering unknown protein interactions) one needs to learn a representation of the graph that is amenable to be used in ML algorithms.

However, graphs are inherently combinatorial structures made of discrete parts like nodes and edges, while many common ML methods, like neural networks, favor continuous structures, in particular vector representations. Vector representations are particularly important in neural networks, as they can be directly used as input layers. To get around the difficulties in using discrete graph representations in ML, graph embedding methods learn a continuous vector space for the graph, assigning each node (and/or edge) in the graph to a specific position in a vector space. A popular approach in this area is that of random-walk-based representation learning, as introduced in DeepWalk.

Left: The well-known Karate graph representing a social network. Right: A continuous space embedding of the nodes in the graph using DeepWalk.
Here we present the results of two recent papers on graph embedding: “Is a Single Embedding Enough? Learning Node Representations that Capture Multiple Social Contexts” presented at WWW’19 and “Watch Your Step: Learning Node Embeddings via Graph Attention” at NeurIPS’18. The first paper introduces a novel technique to learn multiple embeddings per node, enabling a better characterization of networks with overlapping communities. The second addresses the fundamental problem of hyperparameter tuning in graph embeddings, allowing one to easily deploy graph embeddings methods with less effort. We are also happy to announce that we have released the code for both papers in the Google Research github repository for graph embeddings.

Learning Node Representations that Capture Multiple Social Contexts
In virtually all cases, the crucial assumption of standard graph embedding methods is that a single embedding has to be learned for each node. Thus, the embedding method can be said to seek to identify the single role or position that characterizes each node in the geometry of the graph. Recent work observed, however, that nodes in real networks belong to multiple overlapping communities and play multiple roles—think about your social network where you participate in both your family and in your work community. This observation motivates the following research question: is it possible to develop methods where nodes are embedded in multiple vectors, representing their participation in overlapping communities?

In our WWW’19 paper, we developed Splitter, an unsupervised embedding method that allows the nodes in a graph to have multiple embeddings to better encode their participation in multiple communities. Our method is based on recent innovations in overlapping clustering based on ego-network analysis, using the persona graph concept, in particular. This method takes a graph G, and creates a new graph P (called the persona graph), where each node in G is represented by a series of replicas called the persona nodes. Each persona of a node represents an instantiation of the node in a local community to which it belongs. For each node U in the graph, we analyze the ego-network of the node (i.e., the graph connecting the node to its neighbors, in this example A, B, C, D) to discover local communities to which the node belongs. For instance, in the figure below, node U belongs to two communities: Cluster 1 (with the friends A and B, say U’s family members) and Cluster 2 (with C and D, say U’s colleagues).
Ego-net of node U
Then, we use this information to “split” node U into its two personas U1 (the family persona) and U2 (the work persona). This disentangles the two communities, so that they no longer overlap.
The ego-splitting method separating the U nodes in 2 personas.
This technique has been used to improve the state-of-the-art results in graph embedding methods, showing up to 90% reduction in link prediction (i.e., predicting which link will form in the future) error on a variety of graphs. The key reason for this improvement is the ability of the method to disambiguate highly overlapping communities found in social networks and other real-world graphs. We further validate this result with an in-depth analysis of co-authorship graphs where authors belong to overlapping research communities (e.g., machine learning and data mining).
Top Left: A typical graphs with highly overlapping communities. Top Right: A traditional embedding of the graph on the left using node2vec. Bottom Left: A persona graph of the graph above. Bottom Right: The Splitter embedding of the persona graph. Notice how the persona graph clearly disentangles the overlapping communities of the original graph and Splitter outputs well-separated embeddings.
Automatic hyper-parameter tuning via graph attention.
Graph embedding methods have shown outstanding performance on various ML-based applications, such as link prediction and node classification, but they have a number of hyper-parameters that must be manually set. For example, are nearby nodes more important to capture when learning embeddings than nodes that are further away? Even though experts may be able to fine tune these hyper-parameters, one must do so independently for each graph. To obviate such manual work, in our second paper, we proposed a method to learn the optimal hyper-parameters automatically.

Specifically, many graph embedding methods, like DeepWalk, employ random walks to explore the context around a given node (i.e. the direct neighbors, the neighbors of the neighbors, etc). Such random walks can have many hyper-parameters that allow tuning of the local exploration of the graph, thus regulating the attention given by the embeddings to nearby nodes. Different graphs may present different optimal attention patterns and hence different optimal hyperparameters (see the picture below, where we show two different attention distributions). Watch Your Step formulates a model for the performance of the embedding methods based on the above mentioned hyper-parameters. Then we optimize the hyper-parameters to maximize the performance predicted by the model, using standard backpropagation. We found that the values learned by backpropagation agree with the optimal hyper-parameters obtained by grid search.
Our new method for automatic hyper-parameter tuning, Watch Your Step, uses an attention model to learn different graph context distributions. Shown above are two example local neighborhoods about a center node (in yellow) and the context distributions (red gradient) that was learned by the model. The left-side graph shows a more diffused attention model, while the distribution on the right shows one concentrated on direct neighbors.
This work falls under the growing family of AutoML, where we want to alleviate the burden of optimizing the hyperparameters—a common problem in practical machine learning. Many AutoML methods use neural architecture search. This paper instead shows a variant, where we use the mathematical connection between the hyperparameters in the embeddings and graph-theoretic matrix formulations. The “Auto” portion corresponds to learning the graph hyperparameters by backpropagation.

We believe that our contributions will further advance the state of the research in graph embedding in various directions. Our method for learning multiple node embeddings draws a connection between the rich and well-studied field of overlapping community detection, and the more recent one of graph embedding which we believe may result in fruitful future research. An open problem in this area is the use of multiple-embedding methods for classification. Furthermore, our contribution on learning hyperparameters will foster graph embedding adoption by reducing the need for expensive manual tuning. We hope the release of these papers and code will help the research community pursue these directions.

Acknowledgements
We thank Sami Abu-el-Haija who contributed to this work and is now a Ph.D. student at USC.

Source: Google AI Blog


Balanced Partitioning and Hierarchical Clustering at Scale


Solving large-scale optimization problems often starts with graph partitioning, which means partitioning the vertices of the graph into clusters to be processed on different machines. The need to make sure that clusters are of near equal size gives rise to the balanced graph partitioning problem. In simple terms, we need to partition the vertices of a given graph into k almost equal clusters, while we minimize the number of edges that are cut by the partition. This NP-hard problem is notoriously difficult in practice because the best approximation algorithms for small instances rely on semidefinite programming which is impractical for larger instances.

This post presents the distributed algorithm we developed which is more applicable to large instances. We introduced this balanced graph-partitioning algorithm in our WSDM 2016 paper, and have applied this approach to several applications within Google. Our more recent NIPS 2017 paper provides more details of the algorithm via a theoretical and empirical study.

Balanced Partitioning via Linear Embedding
Our algorithm first embeds vertices of the graph onto a line, and then processes vertices in a distributed manner guided by the linear embedding order. We examine various ways to find the initial embedding, and apply four different techniques (such as local swaps and dynamic programming) to obtain the final partition. The best initial embedding is based on “affinity clustering”.

Affinity Hierarchical Clustering
Affinity clustering is an agglomerative hierarchical graph clustering based on Borůvka’s classic Maximum-cost Spanning Tree algorithm. As discussed above, this algorithm is a critical part of our balanced partitioning tool. The algorithm starts by placing each vertex in a cluster of its own: v0, v1, and so on. Then, in each iteration, the highest-cost edge out of each cluster is selected in order to induce larger merged clusters: A0, A1, A2, etc. in the first round and B0, B1, etc. in the second round and so on. The set of merges naturally produces a hierarchical clustering, and gives rise to a linear ordering of the leaf vertices (vertices with degree one). The image below demonstrates this, with the numbers at the bottom corresponding to the ordering of the vertices.
Our NIPS’17 paper explains how we run affinity clustering efficiently in the massively parallel computation (MPC) model, in particular using distributed hash tables (DHTs) to significantly reduce running time. This paper also presents a theoretical study of the algorithm. We report clustering results for graphs with tens of trillions of edges, and also observe that affinity clustering empirically beats other clustering algorithms such as k-means in terms of “quality of the clusters”. This video contains a summary of the result and explains how this parallel algorithm may produce higher-quality clusters even compared to a sequential single-linkage agglomerative algorithm.

Comparison to Previous Work
In comparing our algorithm to previous work in (distributed) balanced graph partitioning, we focus on FENNEL, Spinner, METIS, and a recent label propagation-based algorithm. We report results on several public social networks as well as a large private map graph. For a Twitter followership graph, we see a consistent improvement of 15–25% over previous results (Ugander and Backstrom, 2013), and for LiveJournal graph, our algorithm outperforms all the others for all cases except k = 2, where ours is slightly worse than FENNEL's.

The following table presents the fraction of cut edges in the Twitter graph obtained via different algorithms for various values of k, the number of clusters. The numbers given in parentheses denote the size imbalance factor: i.e., the relative difference of the sizes of largest and smallest clusters. Here “Vanilla Affinity Clustering” denotes the first stage of our algorithm where only the hierarchical clustering is built and no further processing is performed on the cuts. Notice that this is already as good as the best previous work (shown in the first two columns below), cutting a smaller fraction of edges while achieving a perfect (and thus better) balance (i.e., 0% imbalance). The last column in the table includes the final result of our algorithm with the post-processing.

k
UB13
(5%)
Vanilla Affinity
Clustering
(0%)
Final Algorithm
(0%)
20
37.0%
38.0%
35.71%
27.50%
40
43.0%
40.0%
40.83%
33.71%
60
46.0%
43.0%
43.03%
36.65%
80
47.5%
44.0%
43.27%
38.65%
100
49.0%
46.0%
45.05%
41.53%

Applications
We apply balanced graph partitioning to multiple applications including Google Maps driving directions, the serving backend for web search, and finding treatment groups for experimental design. For example, in Google Maps the World map graph is stored in several shards. The navigational queries spanning multiple shards are substantially more expensive than those handled within a shard. Using the methods described in our paper, we can reduce 21% of cross-shard queries by increasing the shard imbalance factor from 0% to 10%. As discussed in our paper, live experiments on real traffic show that the number of multi-shard queries from our cut-optimization techniques is 40% less compared to a baseline Hilbert embedding technique. This, in turn, results in less CPU usage in response to queries. In a future blog post, we will talk about application of this work in the web search serving backend, where balanced partitioning helped us design a cache-aware load balancing system that dramatically reduced our cache miss rate.

Acknowledgements
We especially thank Vahab Mirrokni whose guidance and technical contribution were instrumental in developing these algorithms and writing this post. We also thank our other co-authors and colleagues for their contributions: Raimondas Kiveris, Soheil Behnezhad, Mahsa Derakhshan, MohammadTaghi Hajiaghayi, Silvio Lattanzi, Aaron Archer and other members of NYC Algorithms and Optimization research team.

Source: Google AI Blog


A Summary of the Google Zürich Algorithms & Optimization Workshop


Recently, we hosted a workshop on Algorithms and Optimization in our office in Zürich, with the goal of fostering collaboration between researchers from academia and Google by providing a forum to exchange ideas in machine learning theory and large-scale graph mining. As part of the topics discussed, we additionally highlighted our aim to build a group similar to the NYC algorithms research team in Google’s Zürich office.
Silvio Lattanzi presenting the work of the Graph Mining team
The workshop was structured in five sessions (see the full agenda here), each consisting of talks by attendees that touched the following research areas:
Overall, it was a great day with many excellent talks and with many opportunities for discussing interesting problems. All the presentations, including videos, can be found on our workshop website, here.

Google at KDD’17: Graph Mining and Beyond


The 23rd ACM conference on Knowledge Discovery and Data Mining (KDD’17), a main venue for academic and industry research in data science, information retrieval, data mining and machine learning, was held last week in Halifax, Canada. Google has historically been an active participant in KDD, and this year was no exception, with Googlers’ contributing numerous papers and participating in workshops.

In addition to our overall participation, we are happy to congratulate fellow Googler Bryan Perozzi for receiving the SIGKDD 2017 Doctoral Dissertation Award, which serves to recognize excellent research by doctoral candidates in the field of data mining and knowledge discovery. This award was given in recognition of his thesis on the topic of machine learning on graphs performed at Stony Brook University, under the advisorship of Steven Skiena. Part of his thesis was developed during his internships at Google. The thesis dealt with using a restricted set of local graph primitives (such as ego-networks and truncated random walks) to effectively exploit the information around each vertex for classification, clustering, and anomaly detection. Most notably, the work introduced the random-walk paradigm for graph embedding with neural networks in DeepWalk.

DeepWalk: Online Learning of Social Representations, originally presented at KDD'14, outlines a method for using a series of local information obtained from truncated random walks to learn latent representations of nodes in a graph (e.g. users in a social network). The core idea was to treat each segment of a random walk as a sentence “in the language of the graph.” These segments could then be used as input for neural network models to learn representations of the graph’s nodes, using sequence modeling methods like word2vec (which had just been developed at the time). This research continues at Google, most recently with Learning Edge Representations via Low-Rank Asymmetric Projections.

The full list of Google contributions at KDD’17 is listed below (Googlers highlighted in blue).

Organizing Committee
Panel Chair: Andrew Tomkins
Research Track Program Chair: Ravi Kumar
Applied Data Science Track Program Chair: Roberto J. Bayardo
Research Track Program Committee: Sergei Vassilvitskii, Alex Beutel, Abhimanyu Das, Nan Du, Alessandro Epasto, Alex Fabrikant, Silvio Lattanzi, Kristen Lefevre, Bryan Perozzi, Karthik Raman, Steffen Rendle, Xiao Yu
Applied Data Science Program Track Committee: Edith Cohen, Ariel Fuxman, D. Sculley, Isabelle Stanton, Martin Zinkevich, Amr Ahmed, Azin Ashkan, Michael Bendersky, James Cook, Nan Du, Balaji Gopalan, Samuel Huston, Konstantinos Kollias, James Kunz, Liang Tang, Morteza Zadimoghaddam

Awards
Doctoral Dissertation Award: Bryan Perozzi, for Local Modeling of Attributed Graphs: Algorithms and Applications.

Doctoral Dissertation Runner-up Award: Alex Beutel, for User Behavior Modeling with Large-Scale Graph Analysis.

Papers
Ego-Splitting Framework: from Non-Overlapping to Overlapping Clusters
Alessandro Epasto, Silvio Lattanzi, Renato Paes Leme

HyperLogLog Hyperextended: Sketches for Concave Sublinear Frequency Statistics
Edith Cohen

Google Vizier: A Service for Black-Box Optimization
Daniel Golovin, Benjamin Solnik, Subhodeep Moitra, Greg Kochanski, John Karro, D. Sculley

Quick Access: Building a Smart Experience for Google Drive
Sandeep Tata, Alexandrin Popescul, Marc Najork, Mike Colagrosso, Julian Gibbons, Alan Green, Alexandre Mah, Michael Smith, Divanshu Garg, Cayden Meyer, Reuben KanPapers

TFX: A TensorFlow­ Based Production ­Scale Machine Learning Platform
Denis Baylor, Eric Breck, Heng-Tze Cheng, Noah Fiedel, Chuan Yu Foo, Zakaria Haque, Salem Haykal, Mustafa Ispir, Vihan Jain, Levent Koc, Chiu Yuen Koo, Lukasz Lew, Clemens MewaldAkshay Modi, Neoklis Polyzotis, Sukriti Ramesh, Sudip Roy, Steven Whang, Martin Wicke Jarek Wilkiewicz, Xin Zhang, Martin Zinkevich

Construction of Directed 2K Graphs
Balint Tillman, Athina Markopoulou, Carter T. Butts, Minas Gjoka

A Practical Algorithm for Solving the Incoherence Problem of Topic Models In Industrial Applications
Amr Ahmed, James Long, Dan Silva, Yuan Wang

Train and Distribute: Managing Simplicity vs. Flexibility in High-­Level Machine Learning Frameworks
Heng-Tze Cheng, Lichan Hong, Mustafa Ispir, Clemens Mewald, Zakaria Haque, Illia Polosukhin, Georgios Roumpos, D Sculley, Jamie Smith, David Soergel, Yuan Tang, Philip Tucker, Martin Wicke, Cassandra Xia, Jianwei Xie

Learning to Count Mosquitoes for the Sterile Insect Technique
Yaniv Ovadia, Yoni Halpern, Dilip Krishnan, Josh Livni, Daniel Newburger, Ryan Poplin, Tiantian Zha, D. Sculley

Workshops
13th International Workshop on Mining and Learning with Graphs
Keynote Speaker: Vahab Mirrokni - Distributed Graph Mining: Theory and Practice
Contributed talks include:
HARP: Hierarchical Representation Learning for Networks
Haochen Chen, Bryan Perozzi, Yifan Hu and Steven Skiena

Fairness, Accountability, and Transparency in Machine Learning
Contributed talks include:
Fair Clustering Through Fairlets
Flavio Chierichetti, Ravi Kumar, Silvio Lattanzi, Sergei Vassilvitskii
Data Decisions and Theoretical Implications when Adversarially Learning Fair Representations
Alex Beutel, Jilin Chen, Zhe Zhao, Ed H. Chi

Tutorial
TensorFlow
Rajat Monga, Martin Wicke, Daniel ‘Wolff’ Dobson, Joshua Gordon