Posted by the Android team
As the largest domestic streaming and digital content service in Japan, U-NEXT is always looking for new ways to connect its users to their favorite content. With just a single application, the platform hosts an extensive library of over 840,000 titles, ranging from movies, anime, and live streams to manga, magazines, and e-books.
Always looking for ways to improve its UX for its expanding user base, U-NEXT recently turned to the growing market of large screens and foldables, which includes devices like tablets and Chromebooks. Here, U-NEXT engineers saw an opportunity to create a better way to view content by focusing on what makes these devices special. For example, better multi-window support on larger screens could offer a more visually rich UX, while an improved foldable UX might better mimic the experience readers get with a traditional paperback.
But some users bumped into bugs while using the U-NEXT app with these larger and foldable viewing formats. For instance, the app would often hide important buttons when users opened U-NEXT on larger screens, forcing them to search the page for those navigation tools.
To optimize a UX overhaul to support these formats, the U-NEXT team tackled the project in two phases: remove any existing bugs, then add the features that its large-screen users would benefit from the most.
 |
Clearing out the bugs
To fix the visibility issue for important in-app navigation buttons, U-NEXT engineers used a ConstraintLayout to set constraint barriers. These barriers prevented UI elements from being pushed off-screen while ensuring they’re always oriented correctly, no matter the screen size.
What’s more, U-NEXT’s application didn’t always display properly on larger screens. For example, pages displaying browsable video lists typically consist of a header and a curated list of content. These lists are supposed to occupy most of the space on the page. But on larger screens, the headers occupied the most on-screen real estate, making video content harder to navigate. The U-NEXT team resolved this issue by restricting the width of the header image on larger screens, giving the list more space and making browsing easier for large-screen users.
When users view books on the U-NEXT application, they can tap the screen to reveal a horizontal, scrollable wheel that lets them quickly and easily navigate their place in the text. But when users tried to access this navigation tool on Chromebooks, it wouldn’t appear on the page.
“Originally, we used SystemUiVisibility to determine whether a Chromebook was full-screen when a user tapped it,” said Tomoya Miwa, principal engineer at U-NEXT. “If SystemUiVisibility detected it wasn’t full screen, it’s supposed to display the controller. However, this listener isn’t called on when SystemUiVisibility is changed on Chromebooks, so the controller couldn’t be displayed.”
This meant U-NEXT had to change how they manage the visibility of the controller when SystemUiVisibility changes on Chromebooks. After this bug fix, the application would hide and display the controller at the same time when the screen is tapped on a Chromebook, resolving the issue for these users.
The last bug U-NEXT devs tackled was one that temporarily disrupted video when users folded their device during viewing. Switching device orientation while viewing content is supposed to be seamless, but the automatic deletion and recreation of the Activity during orientation changes caused videos to momentarily cut out.
Instead of letting Android handle these configuration changes automatically, U-NEXT developers changed the app to handle them manually. Using onConfigurationChanged(), the team overrode the change and prevented the UI elements from automatically being deleted and recreated, letting the app preserve them and prevent any viewing interruptions.
Making the most with more form factors
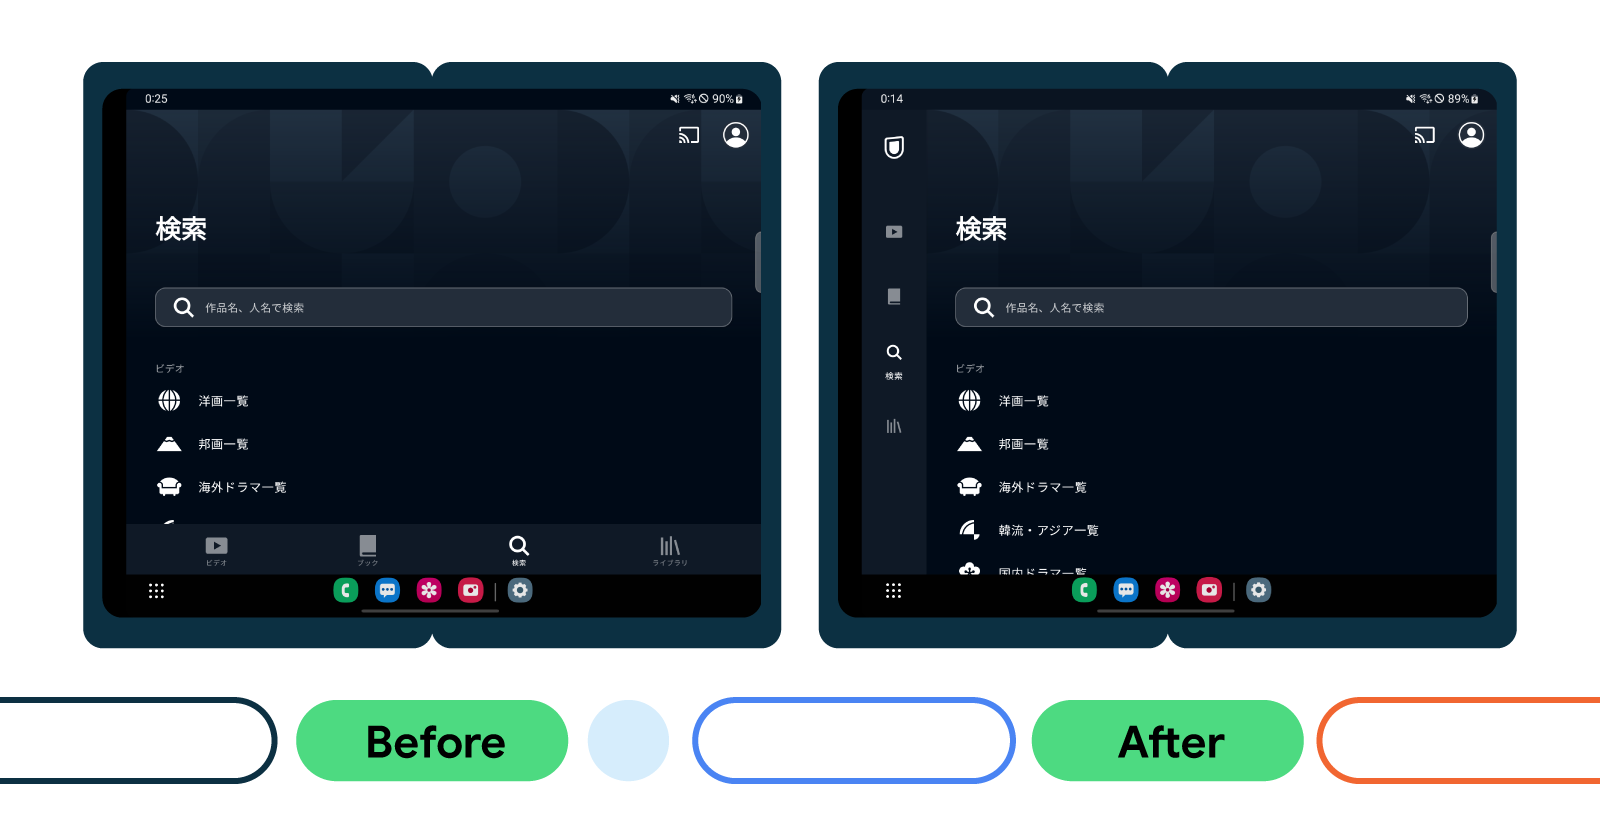
As part of its feature overhaul, U-NEXT replaced the traditional navigation bar with a navigation rail, which U-NEXT engineers anticipated would significantly improve the user experience. U-NEXT made this change in line with Android’s Do’s and Don't for Large Screens presentation from its recent Android Developer Summit, which provided best practices for developers optimizing for large screens.
“Reachability is an important factor when it comes to curating comfortable user experiences,” said Tomoya. “With a traditional, horizontal navigation bar, it makes it difficult to reach the buttons in the middle. With a navigation rail, it becomes much easier to reach these buttons.”
 |
Next, the team enhanced support for two-page spreads when users viewed any e-books content on large screens. Apps typically display a single page when devices are oriented vertically on large screens and foldables. But because most large screens and foldables offer plenty of room for a double-page view, U-NEXT developers wanted to ensure users would always see a double-page spread whether in portrait or landscape orientation—even when the device was slightly folded.
The U-NEXT team also included some smaller, quality-of-life updates to make the user experience for large screens and foldables even better. These included enhancing the app’s compatibility with Compose by ensuring the Navigation component was consistent on every screen size, adding better support for Google Play in-app billing on large screens, and optimizing picture-in-picture viewing.
 |
Android support makes optimization easy
The U-NEXT team was surprised by how easy it was to optimize its app for large screens and foldable devices. Thanks to Android’s developer resources, U-NEXT was able to improve content viewing on its app, across devices, while also minimizing time and effort.
“It’s not that difficult,” said Tomoya. “Introducing the navigation was relatively easy, and foldable support in general is not hard as long as your app is compatible with basic screen rotation.”
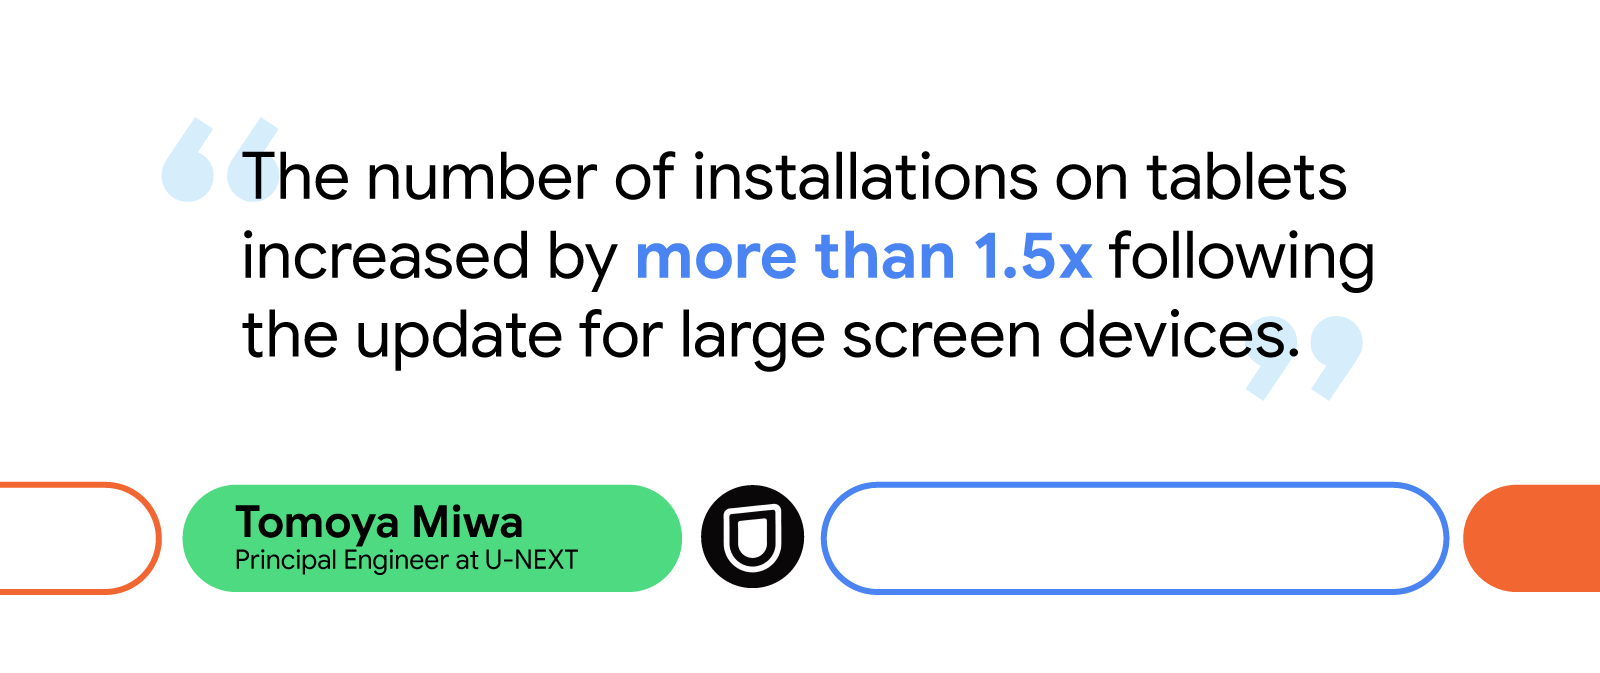
Since updating the U-NEXT app to better support large screens, tablet installations have increased by 1.5X. Additionally, the watch time from users on large screen devices jumped by more than 10%.
Looking forward, the U-NEXT team plans to keep expanding its app’s large screen capabilities by enhancing mouse and keyboard compatibility, introducing list detail view to improve search functionality, adding greater support for tabletop mode, and implementing drag-and-drop features to make content sharing easier.
U-NEXT is excited to see Android add more resources to its large and expanding list of documentation, including the recently updated Material 3 library, which will further help support the growing number of users with large screen and foldable devices.
Start optimizing for large screens today
More people are using large screens, foldables, and other up-and-coming form factors. Learn how you can better support your users on these devices with examples from Android’s Large Screen Gallery.
 Posted by the Android team


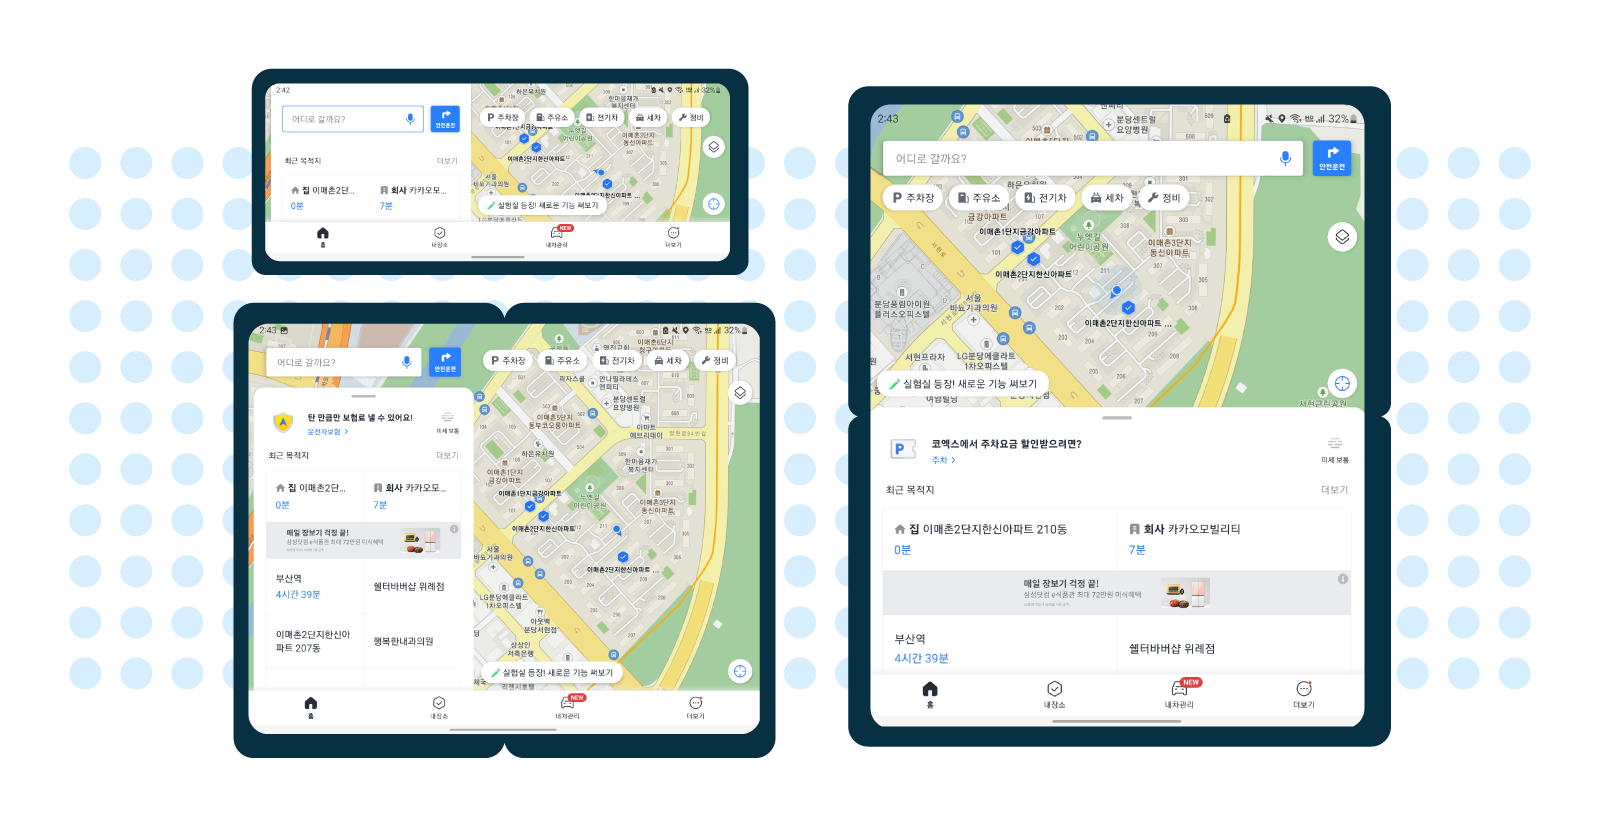
 Additionally, some drivers, including professionals like truck drivers and taxi drivers, use Kakaonavi with three to four other apps simultaneously through Android OS’s split-screen mode. At the time, the Kakaonavi team had only established this type of
 Posted by the Android team