Category Archives: Google Analytics Blog

The latest news, tips and resources straight from the Google Analytics team

Measure Matters: A New Video Series to Keep You Up to Date on Your Data


Whether you’re a data analyst, marketer, or e-commerce specialist, keeping on top of your data and making informed choices can make significant impact on your business. With that in mind, the Google Analytics team has introduced a new video series on YouTube: Measure Matters. Hosted by Analytics Advocates Krista Seiden and Louis Gray, the series covers best practices on leveraging our suite of products, rounds up highlights from the larger measurement community, and reviews recent product updates - so you never miss a thing, even with your busy schedule.

Subscribe to our YouTube channel or find our Measure Matters playlist: https://tinyurl.com/measurematters.

Measure Matters kicked off in May with a deep dive into Machine Learning, where we talked about automatic insights within Google Analytics, and whether the machines were coming for our jobs. (Spoiler alert: they’re not)

Our second episode covered finding your North Star, being sure to try new approaches and take risks, but to make choices based on data, rather than hacking your way through without a clear plan.

The third episode focused on how app developers can literally change the game through mobile app analytics, leveraging Google Analytics for Firebase.

Measure Matters Episode 3: Google Analytics for Firebase


What’s Coming Next

Measure Matters is scheduled to stream live every two weeks, with most events taking place at 10 a.m. Pacific time on Wednesday. Our next event will take place on Wednesday, June 27th, with the topic of Hearts, Charts and Shopping Carts -- how you can evolve your marketing measurement with data. See our playlist for upcoming and past episodes.

How You Can Participate

Measure Matters is not a one-way broadcast. Krista and Louis regularly stream live on YouTube and answer questions taken via YouTube or on Twitter, using the hashtag #measurematters. So send us your questions, ideas, or content you think belongs on our show, and it just may make our next episode.

Happy analyzing!
Posted by Krista Seiden and Louis Gray, Analytics Advocates

Deliver more relevant experiences with Optimize and AdWords

Search is one of the most important acquisition channels in a marketer’s toolkit. But it’s not enough to just optimize search ads. It’s essential to consider the entire customer journey and keep people engaged once they reach your site. That’s why we introduced an integration between Optimize and AdWords to make it easy for marketers to test and create personalized landing pages.

How Spotify boosted conversions with Optimize and AdWords


Spotify, one of the world’s leading audio streaming services, is just one example of a company that has successfully used the Optimize and AdWords integration to drive more conversions from their search campaigns. Spotify discovered that the most streamed content in Germany was actually audiobooks, not music. So they wanted to show German users that they have a wide selection of audiobooks, and also that the experience of listening to them is even better with a premium subscription. 

Using the AdWords integration with Optimize 360 (the enterprise version of Optimize), Spotify ran an experiment that focused on users in Germany who had searched for "audiobooks" on Google and clicked through on their search ad. Half of these users were shown a custom landing page dedicated to audiobooks, while the other half were shown the standard page. The custom landing page increased Spotify’s premium subscriptions by 24%. 

"Before, it was a fairly slow process to get all these tests done. Now, with Optimize 360, we can have 20 or more tests running at the same time. It’s important that we test a lot, so it doesn’t matter if we fail as long as we keep on testing,” said Joost de Schepper, Spotify’s Head of Conversion Optimization."

Watch Spotify’s video case study to learn more


Driving your own results

Today, we’re announcing three new updates to make it easier for all marketers to realize the benefits that Spotify saw from easily testing and creating more relevant landing pages:

1. Connect Optimize with the new AdWords experience

You can connect Optimize to AdWords in just a few steps. Follow these instructions to get started.

Not using the new AdWords experience yet? Make the switch to gain access to more actionable insights and faster access to new features.

2. Link multiple AdWords accounts at once

For advertisers that have many AdWords accounts under a manager account, individually linking each of those sub-accounts to Optimize can be time consuming.

Now, you can link your manager account directly to Optimize. This will pull in all your AdWords accounts at once, allowing you to immediately connect data from separate campaigns, ad groups, and more. To get started, switch to the new AdWords experience, and then you’ll see an option to link your manager account in your Linked accounts, learn more.

3. Gain more flexibility with your keywords

You can now run a single experiment for multiple keywords, even if they’re across different campaigns and ad groups. For example, test the same landing page for users that search for “chocolate chip cookies” in your “desserts” ad group and for users that search for “iced coffee” in your “beverages” ad group.

With the Optimize and AdWords integration, driving results through A/B testing is fast and simple. Sign-up for an Optimize account at no charge and get started today.

Happy Optimizing!


Introducing Advanced Analysis in Google Analytics 360

In our conversations with marketers, we consistently hear that they are looking to gain deeper insights into the customer journey and then turn those insights into better customer experiences. 

Today we’re excited to announce Advanced Analysis, a new tool in beta for Google Analytics 360 customers. Advanced Analysis offers more detailed analysis techniques and deeper exploration capabilities, so you can improve your understanding of how people interact with your site and use those insights to deliver better experiences and reach your business goals.

Our top priority is to help you discover business insights while respecting user privacy. So, as with all Analytics capabilities, data utilized in Advanced Analysis is treated confidentially and securely.

Three ways to support sophisticated analysis


Advanced Analysis offers three new powerful techniques to help surface actionable insights about how people use your site: Exploration, Funnel Analysis, and Segment Overlap. And you can build audiences using any of the techniques, making it seamless to take action on the learnings that come out of your analysis.

With the Exploration technique, deeper analysis can be done in just a few clicks. Easily drag and drop multiple variables (segments, dimensions, and metrics) into the analysis canvas and see instant visualizations of your data. Exploration allows you to view and compare multiple analysis tabs in a single view — helping you test and refine your insights as you go.

Create multiple tabs and compare your analyses.
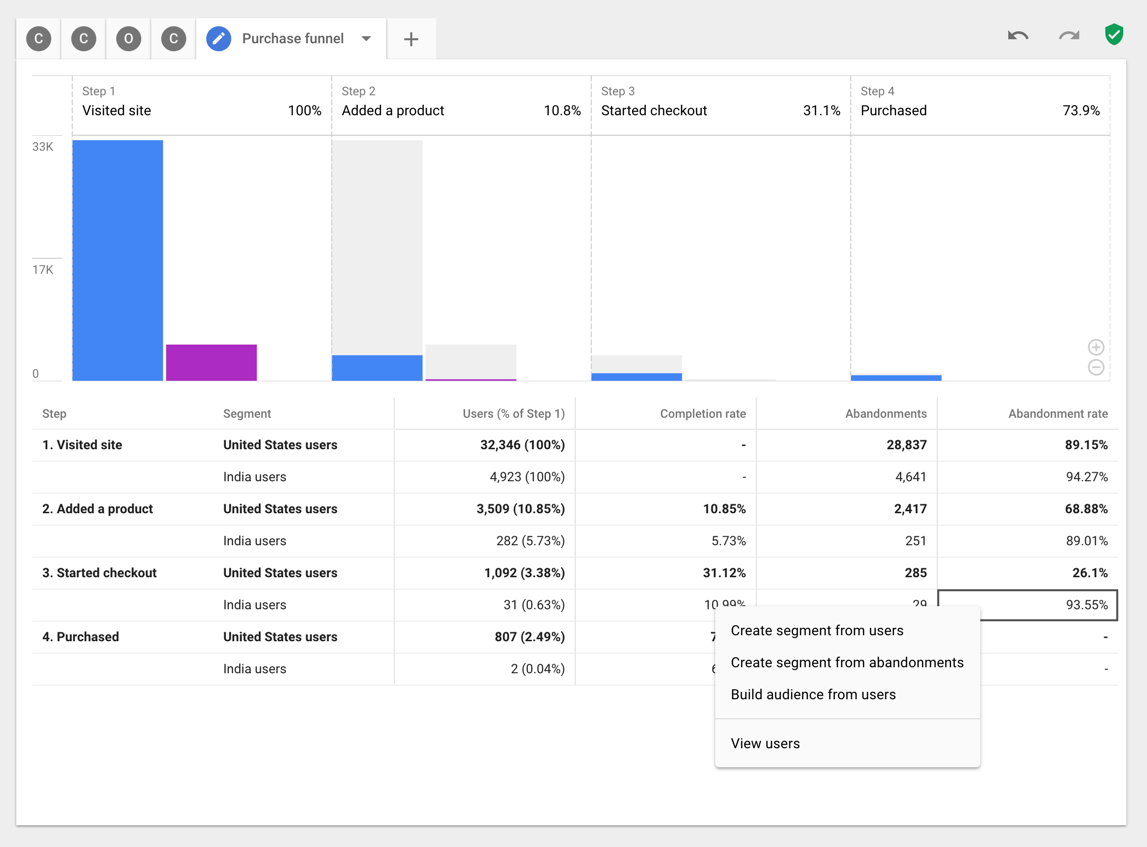
Use the Funnel Analysis technique to understand the steps users take to complete actions on your site. For example, you can quickly see how users progress through your purchase process and identify steps where it can be improved. With the current Custom Funnels in Analytics 360, you can add up to 5 steps (e.g. Visited Site, Added Product to Cart, Started Checkout, Started Payment, Purchased), but Advanced Analysis lets you add up to 10 steps. These extra steps - along with the ability to add multiple segments and dimension breakdowns - give you a deeper look at how different groups of people interact with your site.

The Segment Overlap technique allows you to see how segments you’ve created in Analytics 360 intersect with one another. For example, suppose you ran a major display campaign last month that led to a lot of new first-time purchasers, and now you want to know if they’re sticking around to become repeat customers. Segment Overlap allows you to compare how much this group of first-time buyers overlaps with users who have made a purchase in the past month and with users who are now returning to your site.

See overlap between different audience segments.

Advanced Analysis in action


Let’s review an example of how you can use these techniques together to uncover helpful new insights and put them into action. Imagine you manage an ecommerce store that sells to people around the world. You want to know if there are opportunities to improve your site experience for international customers and drive more sales.

With Advanced Analysis, you can get those answers easily. Starting with Exploration, you organize your Analytics 360 data to show number of users and revenue by country. You realize that you have a lot of new users in India but no revenue -- so there may be an opportunity to improve the checkout process and boost conversions.


Organize data by country to determine your top countries by traffic.

From there, you investigate further with the Funnels technique to compare conversion rates at each step of your purchase funnel for US and India users. In doing so, you see there is a steep drop in completion rate on the checkout step for the India group. This confirms what you suspected, that the checkout flow can be improved for these users.

With just two clicks, you build an audience of India users who have added a product to their cart but didn’t purchase. Once the audience is created, you can use Optimize 360 to test a new checkout experience for that group. And then, with just a few more clicks in Analytics 360, you can push that audience to AdWords or DoubleClick Bid Manager to run a remarketing campaign, taking advantage of the now optimized checkout flow.


Identify conversion rate drop off, and build a custom audience based on that segment.

For enterprises looking to better understand customer journeys, Advanced Analysis helps surface hard-to-find insights and makes it easy to put those insights into action. Advanced Analysis will be rolling out over the coming weeks as a beta to all Analytics 360 users.

Happy analyzing!

Posted by Dan Stone, Product Manager, Google Analytics 360


Tune in on July 10, 2018 as we announce our latest product innovations

Sign up to join the live streamed keynote at Google Marketing Live

When: Tuesday, July 10, 2018 at 9 a.m. PT / 12:00 p.m. ET

Duration: 1 hour

Where: Here on the Analytics blog


It’s that time of year again! Join us as we unveil the latest Analytics, Ads and Platforms innovations at Google Marketing Live. Get a first look at new features and tools that will help you transform your business. Also gain access to the latest insights and trends that are shaping the future of the industry.

Register for the keynote live stream here. We’ll also make a recording available after the live stream for advertisers in other time zones.

Until then, subscribe to Think With Google, and follow us on Twitter, Google+, Facebook and LinkedIn for a sneak peek of what’s coming soon.


Introducing the Data Studio Community Connector Codelab

Posted by Minhaz Kazi, Developer Advocate, Google Data Studio

Data Studio is Google's free next gen business intelligence and data visualization platform. Community Connectors for Data Studio let you build connectors to any internet-accessible data source using Google Apps Script. You can build Community Connectors for commercial, enterprise, and personal use. Learn how to build Community Connectors using the Data Studio Community Connector Codelab.

Use the Community Connector Codelab

The Community Connector Codelab explains how Community Connectors work and provides a step by step tutorial for creating your first Community Connector. You can get started if you have a basic understanding of Javascript and web APIs. You should be able to build your first connector in 30 mins using the Codelab.

If you have previously imported data into Google Sheets using Apps Script, you can use this Codelab to get familiar with the Community Connectors and quickly port your code to fetch your data directly into Data Studio.

Why create your own Community Connector

Community Connectors can help you to quickly deliver an end-to-end visualization solution that is user-friendly and delivers high user value with low development efforts. Community Connectors can help you build a reporting solution for personal, public, enterprise, or commercial data, and also do explanatory visualizations.

  • If you provide a web based service to customers, you can create template dashboards or even let your users create their own visualization based on the users' data from your service.
  • Within an enterprise, you can create serverless and highly scalable reporting solutions where you have complete control over your data and sharing features.
  • You can create an aggregate view of all your metrics across different commercial platforms and service providers while providing drill down capabilities.
  • You can create connectors to public and open datasets. Sharing these connectors will enable other users to quickly gain access to these datasets and dive into analysis directly without writing any code.

By building a Community Connector, you can go from scratch to a push button customized dashboard solution for your service in a matter of hours.

The following dashboard uses Community Connectors to fetch data from Stack Overflow, GitHub, and Twitter. Try using the date filter to view changes across all sources:

This dashboard uses the following Community Connectors:

You can build your own connector to any preferred service and publish it in the Community Connector gallery. The Community Connector gallery now has over 70 Partner Connectors connecting to more than 400 data sources.

Once you have completed the Codelab, view the Community Connector documentation and sample code on the Data Studio open source repository to build your own connector.

Introducing the Google Analytics Sample Dataset for BigQuery

The Google Analytics integration with Google BigQuery gives analysts the opportunity to glean new business insights by accessing session and hit level data and combining it with separate data sets. Organizations and developers can analyze unsampled analytics data in seconds through BigQuery, a web service that lets developers and businesses conduct interactive analysis of big data sets and tap into powerful data analytics.

To help you learn or teach practical experience with analyzing analytics data in BigQuery, we are pleased to announce the availability of a Google Analytics sample dataset. This is accessible directly through the BigQuery interface. The dataset includes data from the Google Merchandise Store, an Ecommerce site that sells Google branded merchandise. The typical Google Analytics data you would expect to see such as AdWords, Goals and Enhanced Ecommerce data can be queried. You can see the fields part of the export schema that you can query here.

Google Analytics Sample Dataset for BigQuery
When it comes to helping businesses ask advanced questions on unsampled Google Analytics data, we like to use BigQuery. Its fast and scalable for big data analytics. When providing trainings on the benefits of the Google Analytics and BigQuery integration, there is nothing like having a high quality dataset with sufficient volume to be meaningful. That's why we are so pleased to see the public availability of a robust Google Analytics sample dataset with marketing and ecommerce data. Everyone can experience big data analytics!
- Doug Hall, Director of Analytics, Conversion Works
Self-Learning 
You can use the sample dataset to learn how granular information can be extracted from analytics data in BigQuery. We’ve created this guide to help you create queries to find answers to the following for the Google Merchandise Store:
  • What is the average number of transactions per purchaser?
  • What is the percentage of stock sold per product?
  • What is the average bounce rate per marketing channel segmented by purchasers?
  • What are the products purchased by customers who previously purchased a particular product?
  • What is the average number of user interactions before a purchase?

Education Programs
If you’re an educator trying to teach others to use BigQuery, then we encourage you to use the sample dataset as a tool. You can use it to create task based assessments and other learning materials for your students. We’ve started to do just that by integrating it into our education courses.

The Analytics Academy provides an introduction to BigQuery in their Getting Started with Google Analytics 360 course. The Data Insights course by the Google Cloud team provides an in-depth look at BigQuery with practical exercises.

Access the Dataset
You can learn more about the dataset including how to get access in this help article. If you need some help, please let us know through the Advertiser Community. Share any feature requests or ideas to make the dataset more useful. We hope the dataset gives you a practical way to learn about the benefits of analysing Google Analytics data in BigQuery.

Happy analyzing!
Posted by Deepak Aujla, Program Manager, Google Analytics Solutions

Is Optimize set up correctly on your site? Let us double-check for you.

Google Optimize helps businesses determine which website experiences work best for their customers. With easy-to-use A/B testing capabilities, marketers can use Optimize to create and launch a test in minutes — and manage the entire process on their own.

A/B testing with tools like Optimize drives results. In a recent survey, 72% of marketers found A/B testing to be a highly valuable method for improving conversion rates.

But we’ve heard from businesses that while testing in Optimize is easy, setting it up could be easier. 

Good news: We’re introducing a new feature that helps make sure Optimize is set up and working the way it’s supposed to.

Let Optimize double-check your code 


With Installation Diagnostics, Optimize will automatically alert and advise you on potential issues with your Optimize code each time you create a test. At a glance, you’ll see if your Optimize setup is correct and if you’re ready to run a test.

Let’s say you create a new page on your site but forget to add the Optimize code. Later, when you are creating a test for that page, Optimize will tell you that the necessary code isn’t installed. You’ll have the opportunity to fix the issue and then launch your test. Moving forward, you can be confident that your test results won’t be disrupted by an incorrect setup.

Optimize will alert you about other issues too - including if Google Analytics code isn’t installed on a page, or if an old version of Analytics code is installed. Then you can make changes to ensure you’ll be able to measure the performance of your experiment. Learn more.

Try it yourself 


Today’s top businesses are testing their way to success. They’re valuing data over opinions. They’re constantly learning — even from failures and mistakes. And they’re using their findings to improve the customer experience.

Whether your business is big, small, or somewhere in between, you can follow their lead. Try Optimize now and get ready to gain deep insights about your customers so you can enhance their web experiences like never before.

Google Surveys goes global


We're excited to announce that you can now survey over 50 countries around the globe with Google Surveys.

When we first launched Google Surveys in 2012 (we called ourselves Google Consumer Surveys back then), our goal was to put quality market research in the hands of businesses of all sizes. Market research was costly and time-consuming in those days, and that made it hard for many companies to make decisions based on what their customers were actually thinking.

Google Surveys made it easy to keep your finger on the pulse of your customers with fast, reliable insights from real people. Since then, we've continued making improvements to the product. We also launched Surveys 360, our enterprise version, with advanced targeting, reporting and sharing features.

And now users of both versions can reach people in more than 50 countries. Wondering if your new product line should launch in Portugal? Stop guessing and find out. Lacking competitive intel in India? Not anymore. Trying to convince your boss that your idea is better? We can help with that.

"As a global company, we're especially excited about the targeting expansion to over 50 new countries. We'll be using Google Surveys to run consumer research and brand awareness studies in markets that have historically been difficult for researchers to access." Frank Kelly, SVP Global Marketing & Strategy, Lightspeed GMI


These new targeting choices are available starting today. Hear more from our product team in this video:


To learn more about the new country options, see our help center article.

Happy surveying!

Tag Manager 360: From Approvals to Zones

Whether you’re a small business with a single site or a large enterprise with many complex sites and apps, Google Tag Manager makes it easier to implement and maintain the tags for all your marketing and measurement tools.

Over the past few years, we've continued to improve the core functionality of Tag Manager for all users while also introducing enterprise features for customers with more advanced needs.

For Tag Manager 360 customers, we recently added Approvals functionality, enabling enterprise users to involve more stakeholders in the tagging process without needing to give them full Publish access.

Submit Changes screen in Tag Manager 360 showing how users with Edit access can request approval.
Using Approvals, you can limit select users to requesting approval for tagging changes. Then you can use the built-in commenting capability to work back and forth with them to get things just right.

Today we’re excited to announce another new feature that gives you even more control over your tagging: Zones for Tag Manager 360!

With Zones, you can give users access to publish certain types of tags on certain parts of your site. Zones work by letting you link additional containers within specified page boundaries.

Zone configuration screen in Tag Manager 360 highlighting the steps of linking containers, defining zone boundaries, and optionally turning on type restrictions.
When a page loads within the zone boundaries, any containers linked within the zone will load alongside your main container. For example, you could give your marketing team and agencies Publish access to their own containers, but limit them to only your marketing pages. This gives them the flexibility to manage their tagging independently and reduces work for admins and developers.

For even more control, you can turn on Type Restrictions to choose what types of tags, triggers, and variables will work from containers within a zone.

Type Restrictions for a Zone in Tag Manager 360 highlighting how individual tag types can be allowed or restricted.
So, whether you’re making a few quick updates to who can publish which tags or building a comprehensive tagging plan for a network of global, regional, and local websites, Zones gives you more power and flexibility to set up the right tagging workflows for your organization.

If you’re already a Tag Manager 360 customer, you’ll see a new Zones section in the left sidebar of your containers starting today. Visit our help center to learn more about Zones.

Want to become a Tag Manager 360 customer? If you’re already a customer of another Google Analytics 360 Suite product, you can reach out to your Account Manager. If you’re brand new to the Analytics 360 Suite, visit our website to learn more.

Posted by Scott Herman, Product Manager, Google Tag Manager

New Analytics Academy course: Getting Started With Google Analytics 360

Today, we are introducing a new course in Analytics Academy: Getting Started With Google Analytics 360.


Krista Seiden and Ashish Vij Introduce Getting Started With Google Analytics 360 (Video)


In this course, you will join instructors Ashish Vij and Krista Seiden as you learn key Google Analytics 360 features such as Roll-Up Reporting, Custom Funnels, Unsampled Reports, and Custom Tables. You'll gain insight into how you can benefit from reporting with BigQuery and native integrations with DoubleClick products, and we will provide you with real-world examples to illustrate how you can leverage Analytics 360’s features and integrations to drive performance and achieve your business goals.

By participating in the course, you’ll learn how to:
  • Set up Roll-Up Reporting
  • Analyze customer journeys with Custom Funnels
  • Leverage Unsampled Reports and Custom Tables
  • Analyze big data with BigQuery Export
  • Evaluate marketing performance with DoubleClick reporting integrations
Sign up for Getting Started With Google Analytics 360 now and start learning today.

Happy analyzing!

Helen Huang & The Google Analytics Education Team