Category Archives: Google Analytics Blog

The latest news, tips and resources straight from the Google Analytics team

More reasons to get started with Google Optimize

With Google Optimize, we want to empower any sized business – big or small – to take steps to make their sites better. Since releasing Optimize last year, we’ve been able to help many businesses identify and provide better site experiences experiences to their users – for free. Today, we’re pleased to announce two new initiatives that will help businesses take even bigger steps when improving their sites.

Higher experiment limit 

Many of our users have given us the feedback that the current limit of 3 simultaneous running experiments is too low. This limit forces them to make difficult tradeoffs about which tests and customer segments should be prioritized. To help address this, we will soon be increasing this limit to 5 experiments. We believe this will give you more opportunity to use Optimize across your entire site.

New “Getting started with Google Optimize” video series 

For many, running website tests may appear to be a daunting task. To make things easier, for anyone completely new to testing or recently started using Optimize, we’ve created a “Getting started with Google Optimize” video series. This will help you start testing in no time. Plus, you can watch the entire series in less than 15 minutes!

Optimize Overview: Quick primer on what Optimize is and how it can help you


Set up your account: Shows you how to link to Google Analytics and get your site ready to run tests 


Create your first experiment: Use the Optimize editor to change your site without writing any code 


Understanding your results: See how Optimize clearly tells you which changes worked best


Once you’re done watching the video series, be sure to create an Optimize account, if you don’t already have one.

We hope you like these changes. Stay tuned, because there are more improvements coming!

Richer Google Analytics User Management

Today we are introducing more powerful ways to manage access to your Analytics accounts: user groups inside Google Analytics, and enforceable user policies. These new features increase your ability to tightly manage who has access to your data, and amplify the impact of the user management features we launched last year.

User Groups

User groups can now be created from and used within Google Analytics, simplifying user management across teams of people. This is a big time saver if you find yourself repeatedly giving out similar permissions to many people, and simplifies granting permissions as individuals rotate into or out of a team.

To start with user groups, visit either Suite Home or Google Analytics, navigate to the user management section, and click the “+” button. You will then see an option to add new groups, which will walk you through creating a user group, adding people to it, and assigning permissions to the group. Here is a full list of steps to make a user group.

Google Analytics User Management page highlighting the new option to create a user group

Enforced User Policies


Google Analytics 360 Suite user policies let you define which users will have access to your Analytics accounts, and which do not. When a user violates a policy, you will be warned of this through the user management section in Google Analytics or Suite Home and have the option to remove that user from your organization.

We have enhanced these policies so you can choose to block policy-violating users from being added to your Analytics accounts. While policies aren’t enforced by default, you have the option to block violator additions.  When you create or edit your organization’s user policy, you will see a toggle switch like the one below:

User policy setup showcasing the new enforced policy option
User groups and enforced user policies are supported in Google Analytics today, and support for more products is coming, as we continue to plan features that help customers better manage access to their critical business data.

Posted by Matt Matyas, Product Manager Google Analytics 360 Suite

Lessons from leaders: A data-driven approach helps deliver engaging, relevant messages


As marketers, we know how important it is to understand our customers and reach them at just the right moment. We also know that consumers have more control of their digital environments than ever — and that they expect us to consistently make recommendations in line with their interests, personalities, and behaviors.1 So how can we regularly communicate in a relevant way with all of our customers?

According to our new report on MIT Sloan Management Review, success starts with a strategy that’s backed by data. In the report, The Data-Driven Transformation, we speak with marketing leaders from Bayer, Tapestry Inc. (the parent brand for Coach, kate spade new york, and Stuart Weitzman), and Sprint. They open up with first-hand insights about transforming their teams to be more efficient, accurate, and agile. Here’s a few key insights from the research — and some words of wisdom from these top analytics pros.

Move toward a unified technology stack — and educate as you go

A recent study by the Association of National Advertisers showed that top marketing performers are the same companies that spend the most money on marketing technology.2 In many ways, their investments are paying off, but for those still using separate solutions for separate channels, there’s greater potential. Unifying their tech under a single, shared system could bring fuller, more tailored consumer insights — not to mention an easier way to evaluate what’s working and what’s not.

Jeff Rasp, director of digital strategy for Bayer’s Consumer Health division, did just that, helping reimagine his team’s approach to data. He oversaw the creation of a new marketing insights platform to consolidate data under a single customer ID, and also helped build the company’s first attribution model to evaluate their success.

Assemble teams with the analytics skills to uncover actionable insights

To deliver the right messages at the right times, marketing organizations need data scientists, mobile developers, and other data professionals. For Rob Roy, chief digital officer at Sprint, that meant building a new in-house analytics team to take operations over from external partners.

“We needed to get the right people who know how to build the architecture to house all the data,” Roy explains.

Once he found them, Sprint worked to integrate data across channels — from web and social media to retail and display — allowing the team more advanced customer segmentation capabilities.

Encourage collaboration across teams

A recent McKinsey study showed that 51% of top-performing marketers were part of a networked organization — one where cross-functional teams come together as needed. Parinaz Vahabzadeh, VP of global data labs at Tapestry, is one leader who’s made sure her team collaborates as a single unit.

“Our mandate is to democratize the data,” explains Vahabzadeh. “As a small, centralized team, we need to find ways to focus on the most impactful projects and also enable the broader teams to run analytics independently.”

Find out more

Want the full stories behind how these three brands are reimagining what they can do with data to reach their customers in relevant ways? Download the full report to learn more.

1-2 MIT SMR Custom Studio/Google, “The Data Driven Transformation,” January 2018

Test and Build for Mobile with Google Optimize

From buying new shoes to booking weekend getaways, mobile can make life more convenient for consumers — and create big wins for marketers. While 40% of consumers will leave a web page that takes longer than three seconds to load, 89% of people are likely to recommend a brand after a positive brand experience on mobile.1 That's why getting your mobile site in shape is more important than ever.

To create the seamless and responsive mobile site that consumers expect, you need the right tools, like Google Optimize. Optimize makes it easy to test different elements of your site to find the winning combination for the best mobile site possible. Now it’s even easier with our new responsive visual editor – and be sure to read on and learn how two of our clients found mobile success with Optimize 360, our enterprise version.

New! Preview your mobile site on any screen size 


While almost everyone has a mobile device, there are so many variations and screen sizes that it’s hard to take a one-size-fits-all approach to optimizing your mobile site. Now, once you’ve created your test page, you can use the new responsive editor to immediately preview what it looks like on any screen size. Or, if you want to see how it appears on a specific device, like a Nexus 7 or iPad, we’ve added more devices that you can select to preview. Learn more about the visual editor here.


Turn ideas to tests quickly 


The responsive visual editor in Optimize is just one solution to help marketers succeed on mobile. Our enterprise version, Optimize 360, makes it easy to make improvements to mobile sites efficiently and rapidly.

Dutch airline carrier Transavia Airlines turned to Optimize 360 to try out different ideas on its mobile site. In fact, the team runs about 10 A/B tests each month on the site, all without having to spend significant time or effort. And the best part? Time spent on analyzing the success of site tests has fallen by 50%. This allows Transavia to focus more on testing to improve its mobile site. Learn more in the full case study.

The path to mobile excellence starts with the customer journey 


Need some help determining what should test on your mobile site? Google Analytics 360 is a great place to start. You’ll be able to analyze any customer interaction, from search to checkout, to figure out which points of your purchase process need help. Then, once you’ve determined where your site needs work, using Optimize 360 to take action is simple, since it’s natively integrated with Analytics 360.

This is exactly how fashion retailer Mango used Analytics 360 and Optimize 360 to tackle its mobile site: After discovering that mobile visits to its online store had skyrocketed 50% year over year, Mango decided to dig a little deeper. In Analytics 360 Mango discovered that while many consumers browsed product listing pages, few were taking the next step to add products to their shopping cart. To reduce steps to checkout, Mango used Optimize 360 to include an “Add” button to product listing pages. This increased the number of users adding products to their carts by 49%. Find out more in the full case study.

Ready to optimize your own mobile site? 


Start testing new mobile experiences with the responsive visual editor in Optimize. This update is one that can help marketers do more on mobile — because whether it’s changing a button or fine-tuning a homepage with quick A/B tests, we’ve learned that small tweaks can make a big impact.

And, if you haven’t already, sign up for a free Optimize account and give it a try.

1 Google / Purchased: "How Brand Experiences Inspire Consumer Action" April 2017. US Smartphone Owners 18+ = 2010, Brand Experiences = 17,726.

Integration of Salesforce Sales Cloud to Google Analytics 360 is now available

In November we announced a partnership with Salesforce, including a plan to build new integrations between Google Analytics 360, Salesforce Sales Cloud and Salesforce Marketing Cloud, seamlessly connecting sales, marketing and advertising data for the first time.

Today we're introducing the first of these integrations: sales pipeline data from Sales Cloud (e.g. leads, opportunities) can now be imported directly into Analytics 360, so any marketer in a business that manages leads can see a more complete view of the customer’s path to conversion and quickly take action to engage them at the right moment. Enterprises such as Rackspace and Carbonite are already benefiting from this integration, saving hours piecing together data and reaching new, more valuable audiences.

A complete view of the customer journey

We often hear from marketers how difficult it is to connect online and offline customer interactions in order to see a complete view of a customer’s journey — and they also tell us how helpful it would be if they could do it successfully. Good news: with the turnkey integration between Sales Cloud and Analytics 360, marketers can now easily combine offline sales data with their digital analytics data so they can see a complete view of the conversion funnel.

This opens up new ways to understand how customers engage with brands and how marketing programs perform. For example, marketers can explore the relationship between the traffic source for online leads (e.g. organic search vs. paid search vs. email) and the quality of those leads, as measured by how they progress through the sales pipeline.
Example of a report in Google Analytics 360 showing the relationship between the traffic source for online leads and the progression of those leads through the sales pipeline, as tracked in Salesforce

With the built-in connection between Analytics 360 and BigQuery, Google Cloud's enterprise data warehouse, marketers can also easily move Sales Cloud data from Analytics 360 into Google Cloud to join it with other datasets and unlock BigQuery's powerful set of tools for identifying insights.

Better marketing outcomes

More visibility into the customer journey is great — but the real value comes from being able to take action. For example, if one source of site traffic consistently delivers leads that are higher quality than another source, budget can be shifted to drive more of the better traffic.

The built-in connections between Analytics 360 and Google’s media buying platforms offer additional ways to find new customers and drive incremental revenue. Marketers can use the tools in AdWords and DoubleClick Search to optimize their bidding on search ads based on the goal of actual sales (offline conversions tracked in Salesforce) rather than just basic website leads. Or they can create an audience list in Analytics 360 of qualified leads from Sales Cloud and use AdWords or DoubleClick Bid Manager so their display ads reach people with similar characteristics.

“People are doing backflips over this”

Rackspace® is a provider of managed cloud services that relies heavily on digital marketing channels to capture interest from potential customers and drive new business. Rackspace has been beta testing the Sales Cloud to Analytics 360 integration and the team has already seen significant benefits from connecting their sales pipeline reporting to their digital marketing analytics.

“Being able to easily see our sales pipeline data in Google Analytics and get complete funnel reports with no manual work has been a game changer. We’re now able to quickly diagnose changes in lead volume and quality, and trace them back to our marketing investments in a way that was not possible before.

We’re getting better insights into our marketing performance and getting those insights much more quickly than when we were trying to stitch this together manually — saving 8-10 hours each week and reducing the lag from importing offline conversion data from 4-6 weeks to virtually real-time. People are doing backflips over this!” - Lara Indrikovs, Senior Manager, Digital Insights & Analytics

Carbonite offers cloud data back-up services that help protect personal and business data from data loss. Carbonite has also been beta testing the Sales Cloud integration and is gearing up to change their media activation strategy to take advantage of the new insights that are now available to them.

“We’re really excited about the opportunity to leverage Salesforce data in Google Analytics and our AdWords media campaigns. This will allow us to activate pipeline acceleration and lookalike prospecting campaigns based on the profiles of companies that achieved key milestones in our customer lifecycle after becoming a lead. We expect this new approach will improve our ROI by shifting our targeting capabilities towards more valuable leads and opportunities.” - Norman Guadagno, SVP of Marketing

What's next?

Over the next few months we’ll be making additional Sales Cloud data available in Analytics 360, giving marketers even more intelligence. For example:
  • Product-specific data will make it possible to run remarketing campaigns that present cross-sell or up-sell offers to customers based on products previously ordered
  • Data predicting the likelihood of lead conversion will let marketers create audience lists of prospects who have a high likelihood of purchasing, which can be used for remarketing (to move people along the sales funnel) or prospecting
  • Lifetime value data can be used as a diagnostic tool to provide insight into which marketing channel brings in the highest value customers


As 2018 moves on, we'll continue to roll out more of the Salesforce-Analytics 360 integrations announced back in November. Soon marketers will be able to include conversion data from Sales Cloud in Google Attribution 360 for more accurate data-driven attribution modeling, surface data from Analytics 360 in Marketing Cloud for a more complete understanding of campaign performance, and make audiences created in Analytics 360 available in Marketing Cloud for activation via direct marketing channels like email.

Contact us here if you are not yet using Analytics 360 and would like to learn more. Current customers can talk to your account team or Certified Analytics Partner about developing a plan for implementing these integrations.

Stay tuned, it's going to be a big year!

How to Turn Your Team’s Data Curiosity into Results


As a data expert, you know that most great ideas don’t strike like a bolt of lightning. They start with something slower: simple curiosity. They grow from “what if” to the seeds of an idea and, if you’re lucky, into some big next steps.

Many people on your team might also have these “what if” ideas too. For example, maybe they’ve got an insight about how to optimize your marketing plans and drive better results. But they might need a little nudge to turn those ideas into something bigger. For your organization to consistently get from insight to action, it’s important to give people at all levels the skills and training they need to explore their hunches using data. After all, you never know where your company’s next great idea might come from.

Here are three ways you can spread your data expertise to others, helping people beyond just a small team of go-to analytics experts.

1. Make training a priority

By analyzing the data that drives your business, anyone on your team can uncover how, when, and where consumers interact with your brand. That helps spread a deeper understanding of the customer journey throughout your organization. But to get there, you’ll need support to make data and analytics a priority — from the top down. In a recent study conducted by Google and Econsultancy, nearly two-thirds of leading organizations said that their executives treat data-driven insights as more valuable than gut instinct.1

One way to have an impact? Help executives create a training plan by determining what your team needs to know in order to analyze the data they’ve collected. By identifying the gaps between what they already know and what they still need to learn, you’ll have the insights you need to provide your team with the right level of training. Once you run a training session, record it and keep it online for later use, and share it with anyone who couldn’t make the meeting.

2. Share your success

If you’re a go-to data expert on your team, sharing your success is one of the most powerful tools you have to spread data literacy. Look for time to recap the results of a recent A/B test and show your team members how you achieved results. That will get them excited about what they can do with data. Also, don’t be shy — at every opportunity, recognize and reward others you see using data effectively. This helps build enthusiasm. Finally, use your knowledge and demonstrate proven business results to communicate what data can do.

As an analyst, you may even want to start thinking of your role in a new light. Analysts don’t just pull reports — they weave data narratives and interpret how data influences business results. That brings data to life and shows its value to the whole team. By sharing openly, you’ll give colleagues the tools they need to answer burning questions or dig deeper into their own hypotheses.

Looking for more ways to turn everyone one your team into a data-savvy marketer? We put together an infographic with 5 key steps to help get you there.

3. Work together across teams

While it might be tempting to use your data powers to make your own team shine, data is actually better when it’s used across teams. In fact, marketing leaders are 1.6X as likely as their mainstream counterparts to strongly agree that open access to data leads to higher business performance.2

You can take it one step further. Use your expertise to create and share easy-to-understand data reports outside your team. It’s a great way to help beginners make sense of recommendations and insights, and to get an idea for productive ways to use them.

When sharing your data, make sure it’s organized and easy for all teams to access and understand. Include clear definitions and common metrics so that everyone is on the same page. To go above and beyond, tailor insights specifically for different teams. That way they can get a deeper understanding of the report’s value. And don’t forget to consider the ways in which you deliver the data — every team has its own preferred channels for communicating.

Finally, don’t stop reaching out once you’ve worked to break down data silos in your company. It takes continued, active steps to keep data flowing across an organization.

With training in data analytics, every member of your team can support big ideas with real data. That helps ensure those ideas are taken seriously. And, in turn, it encourages your team to continue bringing new, diverse points of view to the table.

For more tips on sharing data expertise across your company, check out our Data-Driven Marketer's Strategic Playbook.

1-2 Econsultancy/Google, "The Customer Experience is Written in Data", May 2017, U.S. (n=677 marketing and measurement executives at companies with over $250M in revenues, primarily in North America; n=199 leading marketers who reported marketing significantly exceeded top business goal in 2016, n=478 mainstream marketers (remainder of the sample), May 2017

New ways to measure your users in Google Analytics

Almost 90% of marketing executives say that understanding user journeys across channels and devices is critical to marketing success.1

Today's customers have incredibly high expectations for personalized and relevant experiences from brands. That's why Google Analytics keeps working to better measure the full customer journey in all its complexity.

Let's look at four new Analytics features that are all about helping businesses understand users so they can deliver more personalized site experiences.

Focus on your users in reporting 


Analytics standard reports have been updated to focus on your users. User metrics are an essential way to understand engagement with your customers, especially those who may have multiple sessions across multiple days.

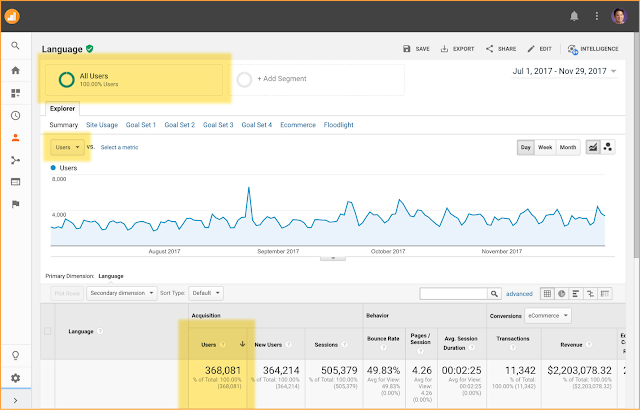
With our updated standard reporting, you can see immediately, for instance, how many users are coming to your site from paid search ― in addition to seeing the number of sessions.


Users are now included in Analytics standard reports.


To enable this update, sign in to your account and go to Admin > Property Settings and then choose the toggle switch labeled Enable Users In Reporting.

For other ways to analyze by user, try existing reports like Active Users, Cohort Analysis, and Lifetime Value. In case you're wondering, session metrics will continue to be available in standard reporting ― that's not changing. Learn more about audience reports.

Measure lifetime metrics and dimensions for every user 


Another tool that marketers can use to analyze visitors on an individual level is User Explorer. And now we've added something new: lifetime metrics and dimensions for individual users (based on the lifetime of their cookie). These new metrics and dimensions will give Analytics users a much more detailed way to measure visitors and customers.


New lifetime metrics and dimensions for individual users in User Explorer.

For example, you can look back and see the total amount of time an individual user has spent or the total number of transactions an individual user has made on your website. You'll also see new dimensions that show data such as when a user made their first visit to your site and which channel acquired them.

The new lifetime metrics and dimensions are already available in your Analytics account. Learn more about User Explorer.

Audiences in reporting 


For marketers who live and breathe audiences ― which is most of us ― the breathing just got easier. We've added the option to publish any audience to a new report in Analytics that should help make every audience easier to understand.


Publish your audiences into Analytics and then view reporting in the Audiences report.


You can now go to the new Audiences report and see a cross-channel view of the audiences you’ve created in Analytics. This is a change from the past, where you could create audiences in Analytics and export those audiences to other products like AdWords, but you weren’t able to publish audiences to Analytics for reporting.

For instance, you might decide to publish an audience to Analytics so that you can see all users who have purchased within the last 12 months but not during the last 2.

You can find the new Audience report in your Analytics account. Learn more about Audiences in reporting.

Reach users most likely to convert 


Meet our newest metric: Conversion Probability. It takes user-based metrics one step further to show you just what the name suggests: the probability that a given user will convert in the future. The calculation is based on a machine learning model that learns from users who have made transactions in the past.

The advantages are clear: Marketers can create remarketing lists that target users who have a high likelihood to purchase and then reach those users through either advertising campaigns in AdWords and DoubleClick or site experiments in Optimize.

We are also adding a new Conversion Probability report. This report will show you the Conversion Probability for all your users, including across important dimensions such as channel.


The new conversion probability report.

This new feature from Analytics Intelligence is the first forward-looking estimate of how likely a conversion is for individual users. It's rolling out in beta to all Analytics accounts over the next few months. Learn more about Conversion Probability. 

These four new enhancements will help you better understand your users and what they are doing on your site, so that you can create better experiences for them. If you — like those 90% of marketing executives — are working hard to understand your users' journeys, we hope you'll find these features useful.

Happy analyzing!


1"The Customer Experience is Written in Data." Econsultancy and Google, May 2017. 

Your Marketing Data Has a Story to Tell — Are You Listening?

The old cliché says every picture tells a story. The question is — do you have a complete picture of your customer? And do you really hear all the stories they’re telling? Today’s consumers use many different devices, and there’s new channels to listen to every year. It can seem like a lot, but it gives marketers an opportunity to use data analytics to gain a deeper understanding into their audiences if they learn to keep their ears out.

In Why a Data and Analytics Strategy Today Gives Marketers an Advantage Tomorrow, Matt Lawson, Google marketing director, and Shuba Srinivasan, a Boston University business professor, look at the ways in which it’s more important than ever for businesses to embrace data analytics. For companies of all sizes, the time is now: With the right tools, strategy, and outlook, your organization can turn noisy data into a symphony of insights.

“We live in an always-on world. That’s an enormous challenge for marketing organizations, but one with a huge upside if they can turn data into insight,” explains Srinivasan, Adele and Norman Barron Professor of Management at the Boston University Questrom School of Business.

The article explores ways that companies can build stronger data strategies to navigate today’s digital landscape. Some key topics include:


All of these points are worth a deeper dive, but they boil down to one message: You need to listen to what your data’s telling you. Analytics isn’t a spectator sport, where you can watch from the sidelines as your team plays ball. To be successful, you need to be in the mix, applying data-driven principles to what you do every day.

It’s not as hard as it sounds. Get back to basics and use the scientific method: Make an educated guess, run a test, and hear what the data says. Starting with the team leader, if the entire team can become comfortable with data-backed trial and error, you’ll see real results.

Want to see the many ways shared data can provide insights and boost the performance of your business? Download The Data-Driven Marketer's Strategic Playbook.

Marketer questions answered: Econsultancy and Google on how to better use data


Q&A with Econsultancy’s Stefan Tornquist and Google’s Casey Carey


“How can I put data at the center of my organization’s marketing strategy? Which teams need access to that data? And how should I train them to use it successfully?”

On Nov. 15, we hosted a webinar with Econsultancy to answer questions like these and discuss our recent joint survey of over 700 marketing leaders about how they’re using data to stay ahead in their fields. Casey Carey, Director of Platforms Marketing at Google, and Stefan Tornquist, Vice President of Research at Econsultancy, walked through the results, revealing some fascinating takeaways.

Topics included everything from key skills and training to best practices in data-driven decision-making. One standout lesson? Teams across companies are focused on tying their data and analytics to business outcomes.

After the talk, listeners shared a number of follow-up questions for Casey and Stefan. Below, we’ve rounded up some of the most intriguing answers. Interested in the bigger picture? Check out the full webinar here: 7 ways marketing leaders use data to deliver better customer experiences.

1. What are the first steps marketing teams should take when they begin using multi-touch or data-driven attribution?

Casey: First and foremost, attribution is a big data problem. Going into an attribution project, job one is to get your data house in order. Connect all your campaigns, prospective customer touchpoints, and conversion events; start establishing a taxonomy for naming channels, placements, sites, and so on.

Second, you have to reckon with the real organizational and cultural impacts of moving to an attribution model. Companies tend to be organized in channel silos. So when you begin looking at performance across channels to find the optimal mix, you have to break down those barriers. Your executive leadership has to sponsor that, and your teams have to be willing to make the necessary changes.

2. What types of training typically help people in marketing get over the “I’m not an analyst, that’s not my job” attitude and use more data?

Stefan: Many companies see training as either a technical discipline or an employee benefit, and one that comes at a cost. But with marketing becoming more sophisticated and technical, you need an ongoing training program for marketers that includes a foundation in statistics and in analytical practices and thinking, as well as core finance and business knowledge. You also need to provide training on the technologies themselves.

In our own research, we’ve seen that when they’re given the right training, marketers become more effective, stay in the organization longer, and are more likely to be promoted.

(For more on training to use data, check out How to make everyone on your team a data-savvy marketer.)

3. What are some of the critical skill sets needed to lead this type of transformation and generate buy-in?

Stefan: There’s a close association between marketing and analytics on the one hand and the business outcomes on the other. Leaders of a targeted transformation to data-driven marketing need to understand – and show that they understand – the business’s larger goals and issues. They need to connect abstract principles of analytics to practical outcomes and business KPIs – to close the gap between data and insights. They need to show how practical insights have actually been data-driven, how data gets you real answers that contribute to the business.

4. How can vendors and consultants help companies get the right resources and institute the organizational changes that are needed for success?

Casey: Sometimes a vendor’s goal when they make a sale is to minimize the impact that their technology will have on resources and organizational structures. Companies buying a technology solution have to see that solution as part of an entire process and strategy, and ask vendors to help with that.

I always love when I’m talking to prospective clients and they ask questions such as: “OK, so, how does this impact my org structure? How many people and what skills do I need to actually be successful doing this? What other services should I be considering?” It really instills confidence that they’re actually going to realize the business value from the investment.

5. How do you cast a wider net from a data and analytics standpoint and ensure KPIs don’t miss critical trends and changes?

Stefan: There’s got to be a balance. The insights we provide need to go beyond things like tweaks to make emails perform better. Instead, we need to think both analytically and creatively and ask higher-level questions. Things like, “What are our customers going to be doing in five years that’s going to make our current business model obsolete?”

Casey: You have to build into your organization the discipline to open your field of view so you’re not getting caught by surprise. Sometimes we get so focused on executing and optimizing towards KPIs and we lose that bigger view.

6. Do businesses get hung up on language when it comes to change? Is the word “marketing” sufficient to describe the scope of modern marketing?

Stefan: Perhaps “marketing” isn’t sufficient to describe what modern marketing is becoming. Similarly, we say “digital marketing” even though digital is almost a vestigial word in this context – is there any aspect of marketing today that doesn’t have a digital component?

But the reality is we’re not going to change what we call things. What organizations can do internally is to change the “language-first” perception. To a certain degree, putting new terminology around it – “marketing-led transformation,” for example – does change how other stakeholders perceive it. But the bottom line is that marketing owns that customer relationship and owns that evolving customer knowledge. As such, it’s still going to be the core of whatever change is happening.

To see the slides and hear Stefan and Casey’s presentation, including the full set of Q&As, download the webinar.

Get the most out of Data Studio Community Connectors

Data Studio Community Connectors enable direct connections from Data Studio to any internet accessible data source. Anyone can build their own Community Connector or use any available ones.

Try out the new Community Connectors in the gallery

We have recently added additional Community Connectors to the Data Studio Community Connector gallery from developers including: DataWorx, Digital Inspiration, G4interactive, Kevpedia, Marketing Miner, MarketLytics, Mito, Power My Analytics, ReportGarden, and Supermetrics. These connectors will let you access data from additional external sources, leveraging Data Studio as a free and powerful reporting and analysis solution. You can now use more than 50 Community Connectors from within the Gallery to access all your data.

Try out these free Community Connectors: Salesforce, Twitter, Facebook Marketing.

Find the connector you need

In the Data Studio Community Connector gallery, it is possible for multiple connectors to connect to the same data source. There are also instances where a single connector can connect to multiple data sources. To help users find the connector they need, we have added the Data Sources page where you can search for Data Sources and see what connectors are available to use. The connector list includes native connectors in Data Studio as well as verified and Open Source Community Connectors. You can directly use the connectors by clicking the direct links on the Data Sources page.

Vote for your data source

If your data source is not available to use through any existing connector, you can Vote for your data source. This will let developers know which Data Sources are most in demand. Developers should also let us know which Community Connector you are building. We will use this information to update the Data Sources page.

Tell us your story

If you have any interesting connector stories, ideas, or if you’d like to share some amazing reports you’ve created using Community Connectors please let us know by giving us a shout or send us your story at [email protected].