Tag Archives: Health

Enhanced Sleep Sensing in Nest Hub

Earlier this year, we launched Contactless Sleep Sensing in Nest Hub, an opt-in feature that can help users better understand their sleep patterns and nighttime wellness. While some of the most critical sleep insights can be derived from a person’s overall schedule and duration of sleep, that alone does not tell the complete story. The human brain has special neurocircuitry to coordinate sleep cycles — transitions between deep, light, and rapid eye movement (REM) stages of sleep — vital not only for physical and emotional wellbeing, but also for optimal physical and cognitive performance. Combining such sleep staging information with disturbance events can help you better understand what’s happening while you’re sleeping.

Today we announced enhancements to Sleep Sensing that provide deeper sleep insights. While not intended for medical purposes1, these enhancements allow better understanding of sleep through sleep stages and the separation of the user’s coughs and snores from other sounds in the room. Here we describe how we developed these novel technologies, through transfer learning techniques to estimate sleep stages and sensor fusion of radar and microphone signals to disambiguate the source of sleep disturbances.

To help people understand their sleep patterns, Nest Hub displays a hypnogram, plotting the user’s sleep stages over the course of a sleep session. Potential sound disturbances during sleep will now include “Other sounds” in the timeline to separate the user’s coughs and snores from other sound disturbances detected from sources in the room outside of the calibrated sleeping area.

Training and Evaluating the Sleep Staging Classification Model
Most people cycle through sleep stages 4-6 times a night, about every 80-120 minutes, sometimes with a brief awakening between cycles. Recognizing the value for users to understand their sleep stages, we have extended Nest Hub’s sleep-wake algorithms using Soli to distinguish between light, deep, and REM sleep. We employed a design that is generally similar to Nest Hub’s original sleep detection algorithm: sliding windows of raw radar samples are processed to produce spectrogram features, and these are continuously fed into a Tensorflow Lite model. The key difference is that this new model was trained to predict sleep stages rather than simple sleep-wake status, and thus required new data and a more sophisticated training process.

In order to assemble a rich and diverse dataset suitable for training high-performing ML models, we leveraged existing non-radar datasets and applied transfer learning techniques to train the model. The gold standard for identifying sleep stages is polysomnography (PSG), which employs an array of wearable sensors to monitor a number of body functions during sleep, such as brain activity, heartbeat, respiration, eye movement, and motion. These signals can then be interpreted by trained sleep technologists to determine sleep stages.

To develop our model, we used publicly available data from the Sleep Heart Health Study (SHHS) and Multi-ethnic Study of Atherosclerosis (MESA) studies with over 10,000 sessions of raw PSG sensor data with corresponding sleep staging ground-truth labels, from the National Sleep Research Resource. The thoracic respiratory inductance plethysmography (RIP) sensor data within these PSG datasets is collected through a strap worn around the patient’s chest to measure motion due to breathing. While this is a very different sensing modality from radar, both RIP and radar provide signals that can be used to characterize a participant’s breathing and movement. This similarity between the two domains makes it possible to leverage a plethysmography-based model and adapt it to work with radar.

To do so, we first computed spectrograms from the RIP time series signals and used these as features to train a convolutional neural network (CNN) to predict the groundtruth sleep stages. This model successfully learned to identify breathing and motion patterns in the RIP signal that could be used to distinguish between different sleep stages. This indicated to us that the same should also be possible when using radar-based signals.

To test the generality of this model, we substituted similar spectrogram features computed from Nest Hub’s Soli sensor and evaluated how well the model was able to generalize to a different sensing modality. As expected, the model trained to predict sleep stages from a plethysmograph sensor was much less accurate when given radar sensor data instead. However, the model still performed much better than chance, which demonstrated that it had learned features that were relevant across both domains.

To improve on this, we collected a smaller secondary dataset of radar sensor data with corresponding PSG-based groundtruth labels, and then used a portion of this dataset to fine-tune the weights of the initial model. This smaller amount of additional training data allowed the model to adapt the original features it had learned from plethysmography-based sleep staging and successfully generalize them to our domain. When evaluated on an unseen test set of new radar data, we found the fine-tuned model produced sleep staging results comparable to that of other consumer sleep trackers.

The custom ML model efficiently processes a continuous stream of 3D radar tensors (as shown in the spectrogram at the top of the figure) to automatically compute probabilities of each sleep stage — REM, light, and deep — or detect if the user is awake or restless.

More Intelligent Audio Sensing Through Audio Source Separation
Soli-based sleep tracking gives users a convenient and reliable way to see how much sleep they are getting and when sleep disruptions occur. However, to understand and improve their sleep, users also need to understand why their sleep may be disrupted. We’ve previously discussed how Nest Hub can help monitor coughing and snoring, frequent sources of sleep disturbances of which people are often unaware. To provide deeper insight into these disturbances, it is important to understand if the snores and coughs detected are your own.

The original algorithms on Nest Hub used an on-device, CNN-based detector to process Nest Hub’s microphone signal and detect coughing or snoring events, but this audio-only approach did not attempt to distinguish from where a sound originated. Combining audio sensing with Soli-based motion and breathing cues, we updated our algorithms to separate sleep disturbances from the user-specified sleeping area versus other sources in the room. For example, when the primary user is snoring, the snoring in the audio signal will correspond closely with the inhalations and exhalations detected by Nest Hub’s radar sensor. Conversely, when snoring is detected outside the calibrated sleeping area, the two signals will vary independently. When Nest Hub detects coughing or snoring but determines that there is insufficient correlation between the audio and motion features, it will exclude these events from the user’s coughing or snoring timeline and instead note them as “Other sounds” on Nest Hub’s display. The updated model continues to use entirely on-device audio processing with privacy-preserving analysis, with no raw audio data sent to Google’s servers. A user can then opt to save the outputs of the processing (sound occurrences, such as the number of coughs and snore minutes) in Google Fit, in order to view their night time wellness over time.

Snoring sounds that are synchronized with the user’s breathing pattern (left) will be displayed in the user’s Nest Hub’s Snoring timeline. Snoring sounds that do not align with the user’s breathing pattern (right) will be displayed in Nest Hub’s “Other sounds” timeline.

Since Nest Hub with Sleep Sensing launched, researchers have expressed interest in investigational studies using Nest Hub’s digital quantification of nighttime cough. For example, a small feasibility study supported by the Cystic Fibrosis Foundation2 is currently underway to evaluate the feasibility of measuring night time cough using Nest Hub in families of children with cystic fibrosis (CF), a rare inherited disease, which can result in a chronic cough due to mucus in the lungs. Researchers are exploring if quantifying cough at night could be a proxy for monitoring response to treatment.

Conclusion
Based on privacy-preserving radar and audio signals, these improved sleep staging and audio sensing features on Nest Hub provide deeper insights that we hope will help users translate their night time wellness into actionable improvements for their overall wellbeing.

Acknowledgements
This work involved collaborative efforts from a multidisciplinary team of software engineers, researchers, clinicians, and cross-functional contributors. Special thanks to Dr. Logan Schneider, a sleep neurologist whose clinical expertise and contributions were invaluable to continuously guide this research. In addition to the authors, key contributors to this research include Anupam Pathak, Jeffrey Yu, Arno Charton, Jian Cui, Sinan Hersek, Jonathan Hsu, Andi Janti, Linda Lei, Shao-Po Ma, ‎Jo Schaeffer, Neil Smith, Siddhant Swaroop, Bhavana Koka, Dr. Jim Taylor, and the extended team. Thanks to Mark Malhotra and Shwetak Patel for their ongoing leadership, as well as the Nest, Fit, and Assistant teams we collaborated with to build and validate these enhancements to Sleep Sensing on Nest Hub.


1Not intended to diagnose, cure, mitigate, prevent or treat any disease or condition. 
2Google did not have any role in study design, execution, or funding. 

Source: Google AI Blog


Daylight Saving Time tips from Google’s sleep scientist

As the days get shorter and colder, it’s getting much harder for us to step out from under our bed covers and into the dark morning. When Daylight Saving Time ends this weekend in Europe and the weekend after in North America, we’ll need to adjust ourselves even more. So, what’s the best way to deal with the new sleeping schedule?

The Nest team spoke to Dr. Logan Schneider who gave us five tips to get your winter sleep schedule ready. Originally a sleep scientist at Stanford Medicine, Logan is now the sleep expert at Google Health. He’s also the brain behind Sleep Sensing on the new Google Nest Hub, the smart screen that helps you get a better night's sleep.

Start adjusting on time… or don’t adjust at all

That extra hour of sleep this weekend can feel like jet lag for some. Soon, your sleep rhythm might make you want to go to bed earlier than usual. Logan's advice is to start preparing a few days in advance to make the transition easier for your body. Dr. Logan says: “Rather than shifting your bedtime and wake time by an hour at once, you could try shifting them over four days, so that’s by 15 minutes a day. Start two days before the clocks change, and wrap up two days after.”

The time change can be even more dreadful for kids and their parents. Dr. Logan applies the same principles to kids as above, but makes the night of the time change extra fun: “I allow my kids to wake up 15 minutes later on the Friday before the time change, and again on Saturday morning. On Saturday night, the kids get to stay up an hour later than usual. I make sure we're watching a movie in a bright light environment, because that helps push the clock a bit later. They wake up at the usual time on Sunday.”

For adults, there might be an even better way: why adjust to the new schedule at all? “You could simply take advantage of being an early bird and just stay on the earlier schedule”, Logan says. Nest Hub with Sleep Sensing can help you monitor your sleep schedule and suggest a new bedtime and wake time recommendation after the transition.

Find your perfect room temperature

People often think that a cool room (16-19˚C or 61-66˚F) is better for sleeping, but according to Dr. Logan, there is no one-size-fits-all temperature in the bedroom. He recommends finding a temperature that is comfortable for you throughout the night. An uncomfortably cold or warm bedroom can affect the quality of your REM sleep, which is an important phase of your night's rest.

Nest Hub keeps track of the average temperature at night. Did you sleep well? Great! Take note of the temperature that Nest Hub measured for you on the Sleep Quality page and make sure that your bedroom is set to that temperature from now on.

Embrace the winter cold once you wake up

We’ve all been there: the alarm goes off, your eyes won't open and the thought of walking in the cold to the bathroom makes you want to stay in bed even more. However, embracing a cold winter’s day is actually a good idea.

Dr. Logan says: “The cold can serve as a cue to your body that it’s time to wake up. So, while you may not want to leave your cozy bed, walking around on a cool floor or washing your face with cold water can be just the invigorating experience your body needs to get going in the morning.”

Never snooze again

As the saying goes: You snooze, you lose. Dr. Logan says: “When using the snooze function, not only are you delaying the inevitable, you’re also not using the extra time well. Falling back to sleep after an alarm takes time. Between each ring of the alarm you’re not getting as much sleep as you think. Your brain can spend up to half of the time falling back to sleep!”

In short, your snoozy nap isn’t really that helpful. It’s better to get up immediately when your alarm goes off.

Imitate a sunrise

Humans are naturally accustomed to waking up to sunlight. Yet, in the winter months, waking up during a dark morning might feel like waking up in the middle of the night. Light plays a key role in your sleep rhythm, says Dr. Logan: “It’s important to use light to help wake up, because your body relies on exposure to light when you’re waking up to set its internal clock for the next sleep period.”

A picture of the Nest Hub with an orange morning glow, sitting on a night stand next to a bed.

Fortunately, Nest Hub’s Sunrise Alarm can help you wake up from your deepest sleep peacefully. It gradually brightens up the screen, just like a sunrise, and then slowly increases the alarm volume. Good morning sunshine!

How Underspecification Presents Challenges for Machine Learning

Machine learning (ML) models are being used more widely today than ever before and are becoming increasingly impactful. However, they often exhibit unexpected behavior when they are used in real-world domains. For example, computer vision models can exhibit surprising sensitivity to irrelevant features, while natural language processing models can depend unpredictably on demographic correlations not directly indicated by the text. Some reasons for these failures are well-known: for example, training ML models on poorly curated data, or training models to solve prediction problems that are structurally mismatched with the application domain. Yet, even when these known problems are handled, model behavior can still be inconsistent in deployment, varying even between training runs.

In “Underspecification Presents Challenges for Credibility in Modern Machine Learning”, to be published in the Journal of Machine Learning Research, we show that a key failure mode especially prevalent in modern ML systems is underspecification. The idea behind underspecification is that while ML models are validated on held-out data, this validation is often insufficient to guarantee that the models will have well-defined behavior when they are used in a new setting. We show that underspecification appears in a wide variety of practical ML systems and suggest some strategies for mitigation.

Underspecification
ML systems have been successful largely because they incorporate validation of the model on held-out data to ensure high performance. However, for a fixed dataset and model architecture, there are often many distinct ways that a trained model can achieve high validation performance. But under standard practice, models that encode distinct solutions are often treated as equivalent because their held-out predictive performance is approximately equivalent.

Importantly, the distinctions between these models do become clear when they are measured on criteria beyond standard predictive performance, such as fairness or robustness to irrelevant input perturbations. For example, among models that perform equally well on standard validations, some may exhibit greater performance disparities between social groups than others, or rely more heavily on irrelevant information. These differences, in turn, can translate to real differences in behavior when the model is used in real-world scenarios.

Underspecification refers to this gap between the requirements that practitioners often have in mind when they build an ML model, and the requirements that are actually enforced by the ML pipeline (i.e., the design and implementation of a model). An important consequence of underspecification is that even if the pipeline could in principle return a model that meets all of these requirements, there is no guarantee that in practice the model will satisfy any requirement beyond accurate prediction on held-out data. In fact, the model that is returned may have properties that instead depend on arbitrary or opaque choices made in the implementation of the ML pipeline, such as those arising from random initialization seeds, data ordering, hardware, etc. Thus, ML pipelines that do not include explicit defects may still return models that behave unexpectedly in real-world settings.

Identifying Underspecification in Real Applications
In this work, we investigated concrete implications of underspecification in the kinds of ML models that are used in real-world applications. Our empirical strategy was to construct sets of models using nearly identical ML pipelines, to which we only applied small changes that had no practical effect on standard validation performance. Here, we focused on the random seed used to initialize training and determine data ordering. If important properties of the model can be substantially influenced by these changes, it indicates that the pipeline does not fully specify this real-world behavior. In every domain where we conducted this experiment, we found that these small changes induced substantial variation on axes that matter in real-world use.

Underspecification in Computer Vision
As an example, consider underspecification and its relationship to robustness in computer vision. A central challenge in computer vision is that deep models often suffer from brittleness under distribution shifts that humans do not find challenging. For instance, image classification models that perform well on the ImageNet benchmark are known to perform poorly on benchmarks like ImageNet-C, which apply common image corruptions, such as pixelization or motion blur, to the standard ImageNet test set.

In our experiment, we showed that model sensitivity to these corruptions is underspecified by standard pipelines. Following the strategy discussed above, we generated fifty ResNet-50 image classification models using the same pipeline and the same data. The only difference between these models was the random seed used in training. When evaluated on the standard ImageNet validation set, these models achieved practically equivalent performance. However, when the models were evaluated on different test sets in the ImageNet-C benchmark (i.e., on corrupted data), performance on some tests varied by orders of magnitude more than on standard validations. This pattern persisted for larger-scale models that were pre-trained on much larger datasets (e.g., a BiT-L model pre-trained on the 300 million image JFT-300M dataset). For these models, varying the random seed at the fine-tuning stage of training produced a similar pattern of variations.

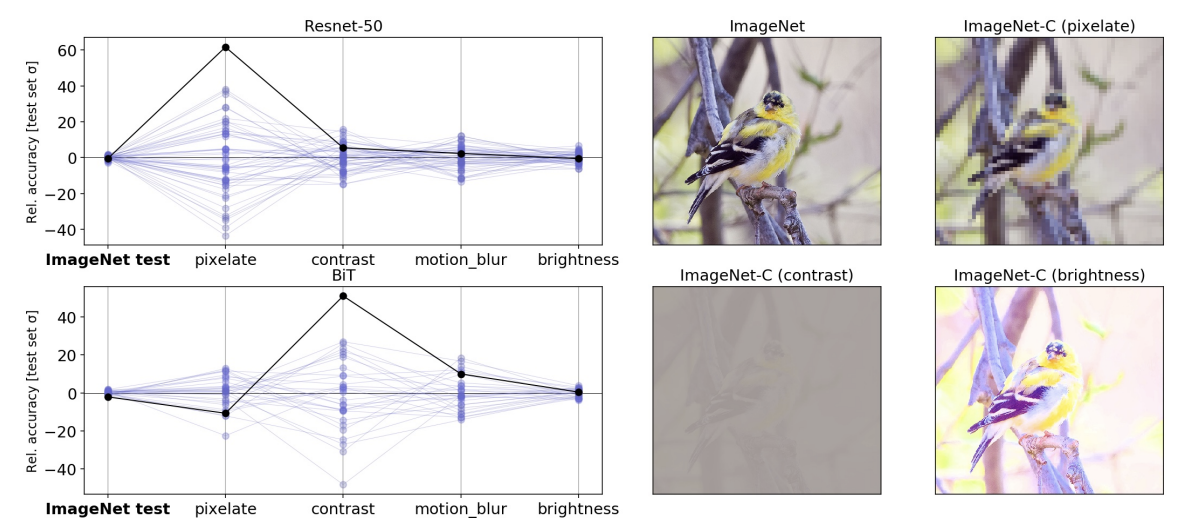
Left: Parallel axis plots showing the variation in accuracy between identical, randomly initialized ResNet-50 models on strongly corrupted ImageNet-C data. Lines represent the performance of each model in the ensemble on classification tasks using uncorrupted test data, as well as corrupted data (pixelation, contrast, motion blur, and brightness). Given values are the deviation in accuracy from the ensemble mean, scaled by the standard deviation of accuracies on the “clean” ImageNet test set. The solid black line highlights the performance of an arbitrarily selected model to show how performance on one test may not be a good indication of performance on others. Right: Example images from the standard ImageNet test set, with corrupted versions from the ImageNet-C benchmark.

We also showed that underspecification can have practical implications in special-purpose computer vision models built for medical imaging, where deep learning models have shown great promise. We considered two research pipelines intended as precursors for medical applications: one ophthalmology pipeline for building models that detect diabetic retinopathy and referable diabetic macular edema from retinal fundus images, and one dermatology pipeline for building models to recognize common dermatological conditions from photographs of skin. In our experiments, we considered pipelines that were validated only on randomly held-out data.

We then stress-tested models produced by these pipelines on practically important dimensions. For the ophthalmology pipeline, we tested how models trained with different random seeds performed when applied to images taken from a new camera type not encountered during training. For the dermatology pipeline, the stress test was similar, but for patients with different estimated skin types (i.e., non-dermatologist evaluation of tone and response to sunlight). In both cases, we found that standard validations were not enough to fully specify the trained model’s performance on these axes. In the ophthalmology application, the random seed used in training induced wider variability in performance on a new camera type than would have been expected from standard validations, and in the dermatology application, the random seed induced similar variation in performance in skin-type subgroups, even though the overall performance of the models was stable across seeds.

These results reiterate that standard hold-out testing alone is not sufficient to ensure acceptable model behavior in medical applications, underscoring the need for expanded testing protocols for ML systems intended for application in the medical domain. In the medical literature, such validations are termed "external validation" and have historically been part of reporting guidelines such as STARD and TRIPOD. These are being emphasized in updates such as STARD-AI and TRIPOD-AI. Finally, as part of regulated medical device development processes (see, e.g., US and EU regulations), there are other forms of safety and performance related considerations, such as mandatory compliance to standards for risk management, human factors engineering, clinical validations and accredited body reviews, that aim to ensure acceptable medical application performance.

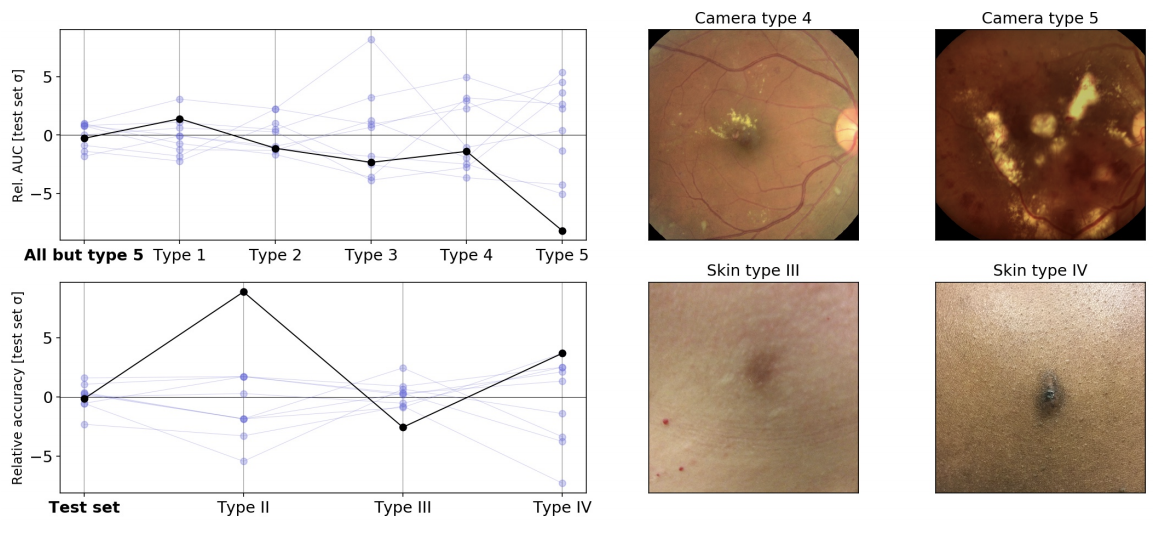
Relative variability of medical imaging models on stress tests, using the same conventions as the figure above. Top left: Variation in AUC between diabetic retinopathy classification models trained using different random seeds when evaluated on images from different camera types. In this experiment, camera type 5 was not encountered during training. Bottom left: Variation in accuracy between skin condition classification models trained using different random seeds when evaluated on different estimated skin types (approximated by dermatologist-trained laypersons from retrospective photographs and potentially subject to labeling errors). Right: example images from the original test set (left) and the stress test set (right).

Underspecification in Other Applications

The cases discussed above are a small subset of models that we probed for underspecification. Other cases we examined include:

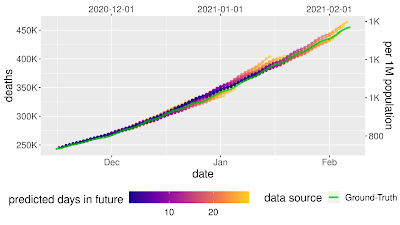
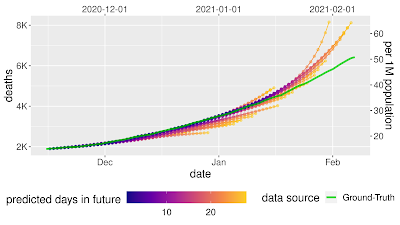
  • Natural Language Processing: We showed that on a variety of NLP tasks, underspecification affected how models derived from BERT-processed sentences. For example, depending on the random seed, a pipeline could produce a model that depends more or less on correlations involving gender (e.g., between gender and occupation) when making predictions.
  • Acute Kidney Injury (AKI) prediction: We showed that underspecification affects reliance on operational versus physiological signals in AKI prediction models based on electronic health records.
  • Polygenic Risk Scores (PRS): We showed that underspecification influences the ability for (PRS) models, which predict clinical outcomes based on patient genomic data, to generalize across different patient populations.

In each case, we showed that these important properties are left ill-defined by standard training pipelines, making them sensitive to seemingly innocuous choices.

Conclusion
Addressing underspecification is a challenging problem. It requires full specification and testing of requirements for a model beyond standard predictive performance. Doing this well needs full engagement with the context in which the model will be used, an understanding of how the training data were collected, and often, incorporation of domain expertise when the available data fall short. These aspects of ML system design are often underemphasized in ML research today. A key goal of this work is to show how underinvestment in this area can manifest concretely, and to encourage the development of processes for fuller specification and testing of ML pipelines.

Some important first steps in this area are to specify stress testing protocols for any applied ML pipeline that is meant to see real-world use. Once these criteria are codified in measurable metrics, a number of different algorithmic strategies may be useful for improving them, including data augmentation, pretraining, and incorporation of causal structure. It should be noted, however, that ideal stress testing and improvement processes will usually require iteration: both the requirements for ML systems, and the world in which they are used, are constantly changing.

Acknowledgements
We would like to thank all of our co-authors, Dr. Nenad Tomasev (DeepMind), Prof. Finale Doshi-Velez (Harvard SEAS), UK Biobank, and our partners, EyePACS, Aravind Eye Hospital and Sankara Nethralaya.

Source: Google AI Blog


HLTH: Building on our commitments in health

Tonight kicked off the HLTH event in Boston that brings together leaders across health to discuss healthcare's most pressing problems and how we can tackle them to improve care delivery and outcomes.

Over the past two years, the pandemic shined a light on the importance of our collective health — and the role the private sector, payers, healthcare delivery organizations, governments and public health play in keeping communities healthy. For us at Google, we saw Search, Maps and YouTube become critical ways for people to learn about COVID-19. So we partnered with public health organizations to provide information that helped people stay safe, find testing and get vaccinated. In addition, we provided healthcare organizations, researchers and non-profits with tools, data and resources to support pandemic response and research efforts.

As I mentioned on the opening night of HLTH, Google Health is our company-wide effort to help billions of people be healthier by leaning on our strengths: organizing information and developing innovative technology. Beyond the pandemic, we have an opportunity to continue helping people to address health more holistically through the Google products they use every day and equipping healthcare teams with tools and solutions that help them improve care.

Throughout the conference, leaders from Google Health will share more about the work we’re doing and the partnerships needed across the health industry to improve health outcomes.

Meeting people in their everyday moments and empowering them to be healthier

People are increasingly turning to technology to manage their daily health and wellbeing — from using wearables and apps to track fitness goals, to researching conditions and building community around those with similar health experiences. At Google, we’re working to connect people with accurate, timely and actionable information and tools that can help them manage their health and achieve their goals.

On Monday, Dr. Garth Graham, who leads healthcare and public health partnerships for YouTube, will join the panel “Impactful Health Information Sharing” to discuss video as a powerful medium to connect people with engaging and high-quality health information. YouTube has been working closely with organizations, like the American College of Physicians, the National Alliance on Mental Illness and Mass General Brigham, to increase authoritative video content.

On Tuesday, Fitbit’s Dr. John Moore will join a panel on “The Next Generation of Health Consumers” focusing on how tools and technologies can help people take charge of their health and wellness between doctors’ visits — especially for younger generations. Regardless of age, there’s a huge opportunity for products like Fitbit to deliver daily, actionable insights into issues that can have a huge impact on overall health, like fitness, stress and sleep.

Helping health systems unlock the potential of healthcare data

Across Google Health, we’re building solutions and tools to help unlock the potential of healthcare data and transform care delivery. Care Studio, for example, helps clinicians at the point of care by bringing together patient information from different EHR systems into an integrated view. We’ve been piloting this tool at select hospital sites in the U.S. and soon clinicians in the pilot will have access to the Care Studio Mobile app so they can quickly access the critical patient information they need, wherever they are — whether that’s bedside, at clinic or in a hospital corridor.

In addition to Care Studio, we’re developing solutions that will bring greater interoperability to healthcare data, helping organizations deliver better care. Hear more from Aashima Gupta, Google Cloud’s global head of healthcare solutions, at HLTH in two sessions. On Monday, October 18, Aashima will discuss how digital strategies can reboot healthcare operations, and on Tuesday, October 19 she will join the panel “Turning of the Data Tides” to discuss different approaches to data interoperability and patient access to health records.

Building for everyone

Where people live, work and learn can greatly impact their experience with health. Behind many of our products and initiatives are industry experts and leaders who are making sure we build for everyone, and create an inclusive environment for that work to take place. During the Women at HLTH Luncheon on Tuesday, Dr. Ivor Horn, our Director of Health Equity, will share her career journey rooted in advocacy, entrepreneurship and activism.

From our early days as a company, Google has sought to improve the lives of as many people as possible. Helping people live healthier lives is one of the most impactful ways we can do that. It will take more than a single feature, product or initiative to improve health outcomes for everyone. If we work together across the healthcare industry and embed health into all our work, we can make the greatest impact.

For more information about speakers at HLTH, check out the full agenda.

An ML-Based Framework for COVID-19 Epidemiology

Over the past 20 months, the COVID-19 pandemic has had a profound impact on daily life, presented logistical challenges for businesses planning for supply and demand, and created difficulties for governments and organizations working to support communities with timely public health responses. While there have been well-studied epidemiology models that can help predict COVID-19 cases and deaths to help with these challenges, this pandemic has generated an unprecedented amount of real-time publicly-available data, which makes it possible to use more advanced machine learning techniques in order to improve results.

In "A prospective evaluation of AI-augmented epidemiology to forecast COVID-19 in the USA and Japan", accepted to npj Digital Medicine, we continued our previous work [1, 2, 3, 4] and proposed a framework designed to simulate the effect of certain policy changes on COVID-19 deaths and cases, such as school closings or a state-of-emergency at a US-state, US-county, and Japan-prefecture level, using only publicly-available data. We conducted a 2-month prospective assessment of our public forecasts, during which our US model tied or outperformed all other 33 models on COVID19 Forecast Hub. We also released a fairness analysis of the performance on protected sub-groups in the US and Japan. Like other Google initiatives to help with COVID-19 [1, 2, 3], we are releasing daily forecasts based on this work to the public for free, on the web [us, ja] and through BigQuery.

Prospective forecasts for the USA and Japan models. Ground truth cumulative deaths counts (green lines) are shown alongside the forecasts for each day. Each daily forecast contains a predicted increase in deaths for each day during the prediction window of 4 weeks (shown as colored dots, where shading shifting to yellow indicates days further from the date of prediction in the forecasting horizon, up to 4 weeks). Predictions of deaths are shown for the USA (above) and Japan (below).

The Model
Models for infectious diseases have been studied by epidemiologists for decades. Compartmental models are the most common, as they are simple, interpretable, and can fit different disease phases effectively. In compartmental models, individuals are separated into mutually exclusive groups, or compartments, based on their disease status (such as susceptible, exposed, or recovered), and the rates of change between these compartments are modeled to fit the past data. A population is assigned to compartments representing disease states, with people flowing between states as their disease status changes.

In this work, we propose a few extensions to the Susceptible-Exposed-Infectious-Removed (SEIR) type compartmental model. For example, susceptible people becoming exposed causes the susceptible compartment to decrease and the exposed compartment to increase, with a rate that depends on disease spreading characteristics. Observed data for COVID-19 associated outcomes, such as confirmed cases, hospitalizations and deaths, are used for training of compartmental models.

Visual explanation of "compartmental” models in epidemiology. People "flow" between compartments. Real-world events, like policy changes and more ICU beds, change the rate of flow between compartments.

Our framework proposes a number of novel technical innovations:

  1. Learned transition rates: Instead of using static rates for transitions between compartments across all locations and times, we use machine-learned rates to map them. This allows us to take advantage of the vast amount of available data with informative signals, such as Google's COVID-19 Community Mobility Reports, healthcare supply, demographics, and econometrics features.
  2. Explainability: Our framework provides explainability for decision makers, offering insights on disease propagation trends via its compartmental structure, and suggesting which factors may be most important for driving compartmental transitions.
  3. Expanded compartments: We add hospitalization, ICU, ventilator, and vaccine compartments and demonstrate efficient training despite data sparsity.
  4. Information sharing across locations: As opposed to fitting to an individual location, we have a single model for all locations in a country (e.g., >3000 US counties) with distinct dynamics and characteristics, and we show the benefit of transferring information across locations.
  5. Seq2seq modeling: We use a sequence-to-sequence model with a novel partial teacher forcing approach that minimizes amplified growth of errors into the future.

Forecast Accuracy
Each day, we train models to predict COVID-19 associated outcomes (primarily deaths and cases) 28 days into the future. We report the mean absolute percentage error (MAPE) for both a country-wide score and a location-level score, with both cumulative values and weekly incremental values for COVID-19 associated outcomes.

We compare our framework with alternatives for the US from the COVID19 Forecast Hub. In MAPE, our models outperform all other 33 models except one — the ensemble forecast that also includes our model’s predictions, where the difference is not statistically significant.

We also used prediction uncertainty to estimate whether a forecast is likely to be accurate. If we reject forecasts that the model considers uncertain, we can improve the accuracy of the forecasts that we do release. This is possible because our model has well-calibrated uncertainty.

Mean average percentage error (MAPE, the lower the better) decreases as we remove uncertain forecasts, increasing accuracy.

What-If Tool to Simulate Pandemic Management Policies and Strategies
In addition to understanding the most probable scenario given past data, decision makers are interested in how different decisions could affect future outcomes, for example, understanding the impact of school closures, mobility restrictions and different vaccination strategies. Our framework allows counterfactual analysis by replacing the forecasted values for selected variables with their counterfactual counterparts. The results of our simulations reinforce the risk of prematurely relaxing non-pharmaceutical interventions (NPIs) until the rapid disease spreading is reduced. Similarly, the Japan simulations show that maintaining the State of Emergency while having a high vaccination rate greatly reduces infection rates.

What-if simulations on the percent change of predicted exposed individuals assuming different non-pharmaceutical interventions (NPIs) for the prediction date of March 1, 2021 in Texas, Washington and South Carolina. Increased NPI restrictions are associated with a larger % reduction in the number of exposed people.
What-if simulations on the percent change of predicted exposed individuals assuming different vaccination rates for the prediction date of March 1, 2021 in Texas, Washington and South Carolina. Increased vaccination rate also plays a key role to reduce exposed count in these cases.

Fairness Analysis
To ensure that our models do not create or reinforce unfairly biased decision making, in alignment with our AI Principles, we performed a fairness analysis separately for forecasts in the US and Japan by quantifying whether the model's accuracy was worse on protected sub-groups. These categories include age, gender, income, and ethnicity in the US, and age, gender, income, and country of origin in Japan. In all cases, we demonstrated no consistent pattern of errors among these groups once we controlled for the number of COVID-19 deaths and cases that occur in each subgroup.

Normalized errors by median income. The comparison between the two shows that patterns of errors don't persist once errors are normalized by cases. Left: Normalized errors by median income for the US. Right: Normalized errors by median income for Japan.

Real-World Use Cases
In addition to quantitative analyses to measure the performance of our models, we conducted a structured survey in the US and Japan to understand how organisations were using our model forecasts. In total, seven organisations responded with the following results on the applicability of the model.

  • Organization type: Academia (3), Government (2), Private industry (2)
  • Main user job role: Analyst/Scientist (3), Healthcare professional (1), Statistician (2), Managerial (1)
  • Location: USA (4), Japan (3)
  • Predictions used: Confirmed cases (7), Death (4), Hospitalizations (4), ICU (3), Ventilator (2), Infected (2)
  • Model use case: Resource allocation (2), Business planning (2), scenario planning (1), General understanding of COVID spread (1), Confirm existing forecasts (1)
  • Frequency of use: Daily (1), Weekly (1), Monthly (1)
  • Was the model helpful?: Yes (7)

To share a few examples, in the US, the Harvard Global Health Institute and Brown School of Public Health used the forecasts to help create COVID-19 testing targets that were used by the media to help inform the public. The US Department of Defense used the forecasts to help determine where to allocate resources, and to help take specific events into account. In Japan, the model was used to make business decisions. One large, multi-prefecture company with stores in more than 20 prefectures used the forecasts to better plan their sales forecasting, and to adjust store hours.

Limitations and next steps
Our approach has a few limitations. First, it is limited by available data, and we are only able to release daily forecasts as long as there is reliable, high-quality public data. For instance, public transportation usage could be very useful but that information is not publicly available. Second, there are limitations due to the model capacity of compartmental models as they cannot model very complex dynamics of Covid-19 disease propagation. Third, the distribution of case counts and deaths are very different between the US and Japan. For example, most of Japan's COVID-19 cases and deaths have been concentrated in a few of its 47 prefectures, with the others experiencing low values. This means that our per-prefecture models, which are trained to perform well across all Japanese prefectures, often have to strike a delicate balance between avoiding overfitting to noise while getting supervision from these relatively COVID-19-free prefectures.

We have updated our models to take into account large changes in disease dynamics, such as the increasing number of vaccinations. We are also expanding to new engagements with city governments, hospitals, and private organizations. We hope that our public releases continue to help public and policy-makers address the challenges of the ongoing pandemic, and we hope that our method will be useful to epidemiologists and public health officials in this and future health crises.

Acknowledgements
This paper was the result of hard work from a variety of teams within Google and collaborators around the globe. We'd especially like to thank our paper co-authors from the School of Medicine at Keio University, Graduate School of Public Health at St Luke’s International University, and Graduate School of Medicine at The University of Tokyo.

Source: Google AI Blog


Self-Supervised Learning Advances Medical Image Classification

In recent years, there has been increasing interest in applying deep learning to medical imaging tasks, with exciting progress in various applications like radiology, pathology and dermatology. Despite the interest, it remains challenging to develop medical imaging models, because high-quality labeled data is often scarce due to the time-consuming effort needed to annotate medical images. Given this, transfer learning is a popular paradigm for building medical imaging models. With this approach, a model is first pre-trained using supervised learning on a large labeled dataset (like ImageNet) and then the learned generic representation is fine-tuned on in-domain medical data.

Other more recent approaches that have proven successful in natural image recognition tasks, especially when labeled examples are scarce, use self-supervised contrastive pre-training, followed by supervised fine-tuning (e.g., SimCLR and MoCo). In pre-training with contrastive learning, generic representations are learned by simultaneously maximizing agreement between differently transformed views of the same image and minimizing agreement between transformed views of different images. Despite their successes, these contrastive learning methods have received limited attention in medical image analysis and their efficacy is yet to be explored.

In “Big Self-Supervised Models Advance Medical Image Classification”, to appear at the International Conference on Computer Vision (ICCV 2021), we study the effectiveness of self-supervised contrastive learning as a pre-training strategy within the domain of medical image classification. We also propose Multi-Instance Contrastive Learning (MICLe), a novel approach that generalizes contrastive learning to leverage special characteristics of medical image datasets. We conduct experiments on two distinct medical image classification tasks: dermatology condition classification from digital camera images (27 categories) and multilabel chest X-ray classification (5 categories). We observe that self-supervised learning on ImageNet, followed by additional self-supervised learning on unlabeled domain-specific medical images, significantly improves the accuracy of medical image classifiers. Specifically, we demonstrate that self-supervised pre-training outperforms supervised pre-training, even when the full ImageNet dataset (14M images and 21.8K classes) is used for supervised pre-training.

SimCLR and Multi Instance Contrastive Learning (MICLe)
Our approach consists of three steps: (1) self-supervised pre-training on unlabeled natural images (using SimCLR); (2) further self-supervised pre-training using unlabeled medical data (using either SimCLR or MICLe); followed by (3) task-specific supervised fine-tuning using labeled medical data.

Our approach comprises three steps: (1) Self-supervised pre-training on unlabeled ImageNet using SimCLR (2) Additional self-supervised pre-training using unlabeled medical images. If multiple images of each medical condition are available, a novel Multi-Instance Contrastive Learning (MICLe) strategy is used to construct more informative positive pairs based on different images. (3) Supervised fine-tuning on labeled medical images. Note that unlike step (1), steps (2) and (3) are task and dataset specific.

After the initial pre-training with SimCLR on unlabeled natural images is complete, we train the model to capture the special characteristics of medical image datasets. This, too, can be done with SimCLR, but this method constructs positive pairs only through augmentation and does not readily leverage patients' meta data for positive pair construction. Alternatively, we use MICLe, which uses multiple images of the underlying pathology for each patient case, when available, to construct more informative positive pairs for self-supervised learning. Such multi-instance data is often available in medical imaging datasets — e.g., frontal and lateral views of mammograms, retinal fundus images from each eye, etc.

Given multiple images of a given patient case, MICLe constructs a positive pair for self-supervised contrastive learning by drawing two crops from two distinct images from the same patient case. Such images may be taken from different viewing angles and show different body parts with the same underlying pathology. This presents a great opportunity for self-supervised learning algorithms to learn representations that are robust to changes of viewpoint, imaging conditions, and other confounding factors in a direct way. MICLe does not require class label information and only relies on different images of an underlying pathology, the type of which may be unknown.

MICLe generalizes contrastive learning to leverage special characteristics of medical image datasets (patient metadata) to create realistic augmentations, yielding further performance boost of image classifiers.

Combining these self-supervised learning strategies, we show that even in a highly competitive production setting we can achieve a sizable gain of 6.7% in top-1 accuracy on dermatology skin condition classification and an improvement of 1.1% in mean AUC on chest X-ray classification, outperforming strong supervised baselines pre-trained on ImageNet (the prevailing protocol for training medical image analysis models). In addition, we show that self-supervised models are robust to distribution shift and can learn efficiently with only a small number of labeled medical images.

Comparison of Supervised and Self-Supervised Pre-training
Despite its simplicity, we observe that pre-training with MICLe consistently improves the performance of dermatology classification over the original method of pre-training with SimCLR under different pre-training dataset and base network architecture choices. Using MICLe for pre-training, translates to (1.18 ± 0.09)% increase in top-1 accuracy for dermatology classification over using SimCLR. The results demonstrate the benefit accrued from utilizing additional metadata or domain knowledge to construct more semantically meaningful augmentations for contrastive pre-training. In addition, our results suggest that wider and deeper models yield greater performance gains, with ResNet-152 (2x width) models often outperforming ResNet-50 (1x width) models or smaller counterparts.

Comparison of supervised and self-supervised pre-training, followed by supervised fine-tuning using two architectures on dermatology and chest X-ray classification. Self-supervised learning utilizes unlabeled domain-specific medical images and significantly outperforms supervised ImageNet pre-training.

Improved Generalization with Self-Supervised Models
For each task we perform pretraining and fine-tuning using the in-domain unlabeled and labeled data respectively. We also use another dataset obtained in a different clinical setting as a shifted dataset to further evaluate the robustness of our method to out-of-domain data. For the chest X-ray task, we note that self-supervised pre-training with either ImageNet or CheXpert data improves generalization, but stacking them both yields further gains. As expected, we also note that when only using ImageNet for self-supervised pre-training, the model performs worse compared to using only in-domain data for pre-training.

To test the performance under distribution shift, for each task, we held out additional labeled datasets for testing that were collected under different clinical settings. We find that the performance improvement in the distribution-shifted dataset (ChestX-ray14) by using self-supervised pre-training (both using ImageNet and CheXpert data) is more pronounced than the original improvement on the CheXpert dataset. This is a valuable finding, as generalization under distribution shift is of paramount importance to clinical applications. On the dermatology task, we observe similar trends for a separate shifted dataset that was collected in skin cancer clinics and had a higher prevalence of malignant conditions. This demonstrates that the robustness of the self-supervised representations to distribution shifts is consistent across tasks.

Evaluation of models on distribution-shifted datasets for the chest-xray interpretation task. We use the model trained on in-domain data to make predictions on an additional shifted dataset without any further fine-tuning (zero-shot transfer learning). We observe that self-supervised pre-training leads to better representations that are more robust to distribution shifts.
Evaluation of models on distribution-shifted datasets for the dermatology task. Our results generally suggest that self-supervised pre-trained models can generalize better to distribution shifts with MICLe pre-training leading to the most gains.

Improved Label Efficiency
We further investigate the label-efficiency of the self-supervised models for medical image classification by fine-tuning the models on different fractions of labeled training data. We use label fractions ranging from 10% to 90% for both Derm and CheXpert training datasets and examine how the performance varies using the different available label fractions for the dermatology task. First, we observe that pre-training using self-supervised models can compensate for low label efficiency for medical image classification, and across the sampled label fractions, self-supervised models consistently outperform the supervised baseline. These results also suggest that MICLe yields proportionally higher gains when fine-tuning with fewer labeled examples. In fact, MICLe is able to match baselines using only 20% of the training data for ResNet-50 (4x) and 30% of the training data for ResNet152 (2x).

Top-1 accuracy for dermatology condition classification for MICLe, SimCLR, and supervised models under different unlabeled pre-training datasets and varied sizes of label fractions. MICLe is able to match baselines using only 20% of the training data for ResNet-50 (4x).

Conclusion
Supervised pre-training on natural image datasets is commonly used to improve medical image classification. We investigate an alternative strategy based on self-supervised pre-training on unlabeled natural and medical images and find that it can significantly improve upon supervised pre-training, the standard paradigm for training medical image analysis models. This approach can lead to models that are more accurate and label efficient and are robust to distribution shifts. In addition, our proposed Multi-Instance Contrastive Learning method (MICLe) enables the use of additional metadata to create realistic augmentations, yielding further performance boost of image classifiers.

Self-supervised pre-training is much more scalable than supervised pre-training because class label annotation is not required. We hope this paper will help popularize the use of self-supervised approaches in medical image analysis yielding label efficient and robust models suited for clinical deployment at scale in the real world.

Acknowledgements
This work involved collaborative efforts from a multidisciplinary team of researchers, software engineers, clinicians, and cross-functional contributors across Google Health and Google Brain. We thank our co-authors: Basil Mustafa, Fiona Ryan, Zach Beaver, Jan Freyberg, Jon Deaton, Aaron Loh, Alan Karthikesalingam, Simon Kornblith, Ting Chen, Vivek Natarajan, and Mohammad Norouzi. We also thank Yuan Liu from Google Health for valuable feedback and our partners for access to the datasets used in the research.

Source: Google AI Blog


These researchers are driving health equity with Fitbit

Under-resourced communities across the country have long faced disparities in health due to structural and long-standing inequities. Unfortunately, the pandemic has further widened many of these gaps.

Still, health equity research in digital health remains limited. To help address these issues, we announced the Fitbit Health Equity Research Initiative earlier this year to help support underrepresented researchers who are early in their careers and working to address health disparities in communities.

Over the past decade, researchers have used Fitbit devicesin over 900 health studies, in areas like diabetes, heart disease, oncology, mental health, infectious disease and more. Today, we’re awarding six researchers more than a total of $300,000 in Fitbit devices and services to support their research projects. Additionally, Fitbit’s long-time partner, Fitabase, will provide all projects with access to their data management platform to help researchers maximize study participation and analysis.

Learn more about the awardees and their research:

A photo of Sherilyn Francis of Georgia Tech

Improving postpartum care for rural black women

Black women in the U.S. are two to three times more likely to die from pregnancy or childbirth when compared to their white counterparts. And in Georgia, the disparities are more pronounced among rural populations. “As Black women who reside in Georgia, we’re more likely to die simply by becoming pregnant,” shares Sherilyn Francis, a PhD student in Georgia Tech’s Human-Centered Computing program. Her research aims to improve postpartum care for rural Black mothers through a culturally informed mobile health intervention. As part of the study, participants will receive a Fitbit Sense smartwatch and Fitbit Aria Air scale. By combining insight into physical activity, heart rate, sleep, weight and nutritional data with health outcomes, Sherilyn and her colleagues hope to shed light on ways to reduce the risk of severe maternal morbidity for Black mothers.

A photo of Jessee Dietch of Oregon State University

A look at sleep health in transgender youth

Transgender youth (ages 14-19) are at elevated risk for poor sleep health and associated physical and mental health outcomes. However, there’s no research to date that examines how medical transition and the use of gender-affirming hormone therapy impact sleep health. Jessee Dietch, PhD, who is an assistant professor of psychology at Oregon State University, will analyze participants’ sleep using a Fitbit Charge 5. The hope is that the findings will highlight potential points for sleep health intervention that could lead to improved wellbeing for a community that is already at an elevated risk for poor health outcomes.

A photo of  Rony F. Santiago of Sansum Diabetes Research Institute

Preventing the progression of type 2 diabetes in Latino adults

The causes and complications of type 2 diabetes (T2D) disproportionately impact Latinos. Motivated by personal experiences, Rony F. Santiago, MA, is an early-career researcher at Sansum Diabetes Research Institute and manages T2D programs that support the Santa Barbara community. Rony and his team, in collaboration with researchers at Texas A&M University, aim to recruit healthy Latino participants and those with pre-diabetes or T2D who will each receive a continuous glucose monitor and a Fitbit Sense smartwatch. They hope to analyze physical activity, nutrition tracking and sleep patterns to better understand the impact these behaviors can have on blood sugar and the potential to improve health outcomes, including the progression from pre-diabetes to T2D.

A photo of Toluwalase Ajayi of Scripps Research

Investigating how systemic racism impacts maternal and fetal health

Black and Hispanic pregnant people experience higher rates of pregnancy-related mortality in comparison to their non-Hispanic white counterparts. And Black infants are twice as likely to die within their first year of life in comparison to white infants. Toluwalase Ajayi, MD, pediatrician, palliative care physician and clinical researcher at Scripps Research is the principal researcher for this study, PowerMom FIRST, which is part of her larger research study PowerMom. PowerMom FIRST aims to answer questions about how systemic racism and discrimination may have a negative impact on maternal and fetal health in these vulnerable populations. In this study, 500 Black and Hispanic mothers will receive a Fitbit Luxe tracker and Aria Air scale. Researchers will assess participant survey data for health inequities, disproportionate health outcomes, disparities in quality of care, and other factors that may influence maternal health alongside biometric data from Fitbit devices. Data, like sleep and heart rate, will help researchers better understand the impact that systemic racism experienced by Black and Hispanic pregnant people may have on their health.

A photo of Susan Ramsundarsingh of SKY Schools

Building healthy habits in adolescents facing health disparities

Experiences of trauma, such as the COVID-19 pandemic and social inequity, are linked to poor health habits among marginalized student populations. Although there is a known relationship between unhealthy habits such as physical inactivity, poor nutrition, and socioeconomic status, there is little clarity on effective interventions. Susan Ramsundarsingh, PhD is the National Director of Research at SKY Schools, which develops evidence-based programs aimed at increasing the wellbeing and academic performance of under-resourced students. In this study, researchers will pair Fitbit Inspire 2 devices with the SKY School program, which teaches children social-emotional skills and resilience to improve health and wellbeing through tools like breathing techniques. Six hundred adolescent students will be assigned to three groups to measure the impact of the interventions on heart rate, sleep and physical activity during the 2021-22 school year.

A photo of Victoria Bandera of UCHealth

Reducing cardiovascular disease risk factors in Hispanic families in Colorado

Hispanics have a disproportionately higher prevalence of cardiovascular disease risk factors relative to non-Hispanic whites, as well as higher rates of modifiable risk factors such as diabetes and hypertension. Victoria Bandera, M.S. is an exercise physiologist and early career researcher at UCHealth Healthy Hearts in Loveland, Colo., whose research aims to combat health inequities that impact the Hispanic community. Participants enrolled in the Healthy Hearts Family Program will receive a Fitbit Charge 5 and take part in a 6-month program that includes an educational series on cardiovascular disease risks, healthy behaviors and health screenings. Researchers will encourage participants, ages 13 and older, to use their new Fitbit device to monitor and modify their health behaviors, such as eating habits and physical activity. They will then analyze changes in physical activity levels, body composition and biometric variables to assess the impact of the Healthy Hearts Family Program.

For the past 14 years at Fitbit, our mission has been to help everyone around the world live active, healthier lives, and along with Google, we’re committed to using tech to improve health equity. We hope the Fitbit Health Equity Research Initiative will continue to encourage wearable research and generate new evidence and methods for addressing health disparities.

The promise of using AI to help prostate cancer care

In 2021, nearly 250,000 Americans will be diagnosed with prostate cancer, which remains the second most common cancer among men in the U.S. Even as we make advancements in cancer research and treatment, diagnosing and treating prostate cancer remains difficult. This National Prostate Cancer Awareness Month, we’re sharing how Google researchers are looking at ways artificial intelligence (AI) can improve prostate cancer care and the lessons learned along the way.  

Our AI research to date 

Currently, pathologists rely on a process called the ‘Gleason grading system’ to grade prostate cancer and inform the selection of an effective treatment option. This process involves examining tumor samples under a microscope for tissue growth patterns that indicate the aggressiveness of the cancer. Over the past few years, research teams at Google have developed AI systems that can help pathologists grade prostate cancer with more objectivity and ease. 

These AI systems can help identify the aggressiveness of prostate cancer for tumors at different steps of the clinical timeline — from smaller biopsy samples during initial diagnosis to larger samples from prostate removal surgery. In prior studies published in JAMA Oncology and Nature Partner Journal Digital Medicine, we found our AI system for Gleason grading prostate cancer samples performed at a higher rate of agreement with subspecialists (pathologists who have specialized training in prostate cancer) as compared to general pathologists. These results suggest that AI systems have the potential to support high-quality prostate cancer diagnosis for more patients. 

To understand this system's potential impact within a clinical workflow, we also studied how general pathologists could use our AI system during their assessments. In arandomized study involving 20 pathologists reviewing 240 retrospective prostate biopsies, we found that the use of an AI system as an assistive tool was associated with an increase in grading agreement between general pathologists and subspecialists. This indicated that AI tools may help general pathologists grade prostate biopsies with greater accuracy. The AI system also improved both pathologists’ efficiency and their self-reported diagnostic confidence. 

In our latest study in Nature Communications Medicine, we directly examined whether the AI’s grading was able to identify high-risk patients by comparing the system’s grading against mortality outcomes. This is important because mortality outcomes are one of the most clinically relevant results for evaluating the value of Gleason grading, ensuring greater confidence in the AI’s grading. We found that the AI’s grades were more strongly associated with patient outcomes than the grades from general pathologists, suggesting that the AI could potentially help inform decision-making on treatment plans. 


Contributing to reducing variability in AI research 

We first began training our AI system using Gleason grades from both general pathologists and subspecialists. As we continued to develop AI systems for assisting prostate cancer grading, we learned that both training the AI and evaluating the model’s performance can be challenging because often the “ground truth” or reference standard is based on expert opinion. Because of this subjectivity, for some cases, two pathologists examining the same sample may arrive at a different Gleason grade.

To improve the quality of the “ground truth”, we developed a set of best practices that we have shared this week in Lancet Digital Health. These recommendations include involving experienced prostate pathology experts, making sure that multiple experts look at each sample, and designing an unbiased disagreement resolution process. By sharing these learnings, we hope to encourage and accelerate further work in this area, particularly in earlier-phase research when it’s impractical to train or validate a model using patient outcomes data.

Our research has shown that AI can be most helpful when it's built to support clinicians with the right problem, in the right way, at the right time. With that in mind, we plan to further validate the role of AI and other novel technologies in helping improve prostate cancer diagnosis, treatment planning and patient outcomes. 

Detecting Abnormal Chest X-rays using Deep Learning

The adoption of machine learning (ML) for medical imaging applications presents an exciting opportunity to improve the availability, latency, accuracy, and consistency of chest X-ray (CXR) image interpretation. Indeed, a plethora of algorithms have already been developed to detect specific conditions, such as lung cancer, tuberculosis and pneumothorax. By virtue of being trained to detect a specific disease, however, the utility of these algorithms may be limited in a general clinical setting, where a wide variety of abnormalities could surface. For example, a pneumothorax detector is not expected to highlight nodules suggestive of cancer, and a tuberculosis detector may not identify findings specific to pneumonia. Since an initial triaging step is to determine whether a CXR contains concerning abnormalities, a general-purpose algorithm that identifies X-rays containing any sort of abnormality could significantly facilitate the workflow. However, developing a classifier to do this is challenging due to the ​​wide variety of abnormal findings that present on CXRs.

In “Deep Learning for Distinguishing Normal versus Abnormal Chest Radiographs and Generalization to Two Unseen Diseases Tuberculosis and COVID-19”, published in Scientific Reports, we present a model that can distinguish between normal and abnormal CXRs across multiple de-identified datasets and settings. We find that the model performs well on general abnormalities, as well as unseen examples of tuberculosis and COVID-19. We are also releasing our set of radiologists’ labels1 for the test set used in this study for the publicly available ChestX-ray14 dataset.

A Deep Learning System for Detecting Abnormal Chest X-rays
The deep learning system we used is based on the EfficientNet-B7 architecture, pre-trained on ImageNet. We trained the model using over 200,000 de-identified CXRs from the Apollo Hospitals in India. Each CXR was assigned a label of either “normal” or “abnormal” using a regular expression–based natural language processing approach on the associated radiology reports.

To evaluate how well the system generalizes to new patient populations, we compared its performance on two datasets consisting of a wide spectrum of abnormalities: the test split from the Apollo Hospitals dataset (DS-1), and the publicly available ChestX-ray14 (CXR-14). The labels for these two test sets were annotated for the purposes of this project by a group of US board-certified radiologists. The system achieved areas under the receiver operating characteristic curve (AUROC) of 0.87 on DS-1 and 0.94 on CXR-14 (higher is better).

Though the evaluations on DS-1 and CXR-14 contained a wide range of abnormalities, a possible use-case would be to utilize such an abnormality detector in novel or unforeseen settings with diseases that it had not encountered before. To evaluate the generalizability of the system to new patient populations and in the presence of diseases not seen in the training set, we used four de-identified datasets from three countries, including two publicly available tuberculosis datasets and two COVID-19 datasets from Northwestern Medicine. The system achieved AUCs of 0.95-0.97 in detecting tuberculosis, and 0.65-0.68 in detecting COVID-19. Because CXRs that are negative for these diseases could still contain other concerning abnormalities, we further evaluated the system for its ability to detect abnormalities more broadly (instead of disease positive vs. negative), finding AUCs of 0.91-0.93 for the tuberculosis dataset, and AUCs of 0.86 for the COVID-19 dataset.

The purpose of multiple evaluations (abnormality detection and disease detection) is the distinction between the two: a given disease can present with a certain abnormality or not; and a certain abnormality can arise from multiple diseases. Our study evaluates for both.

The large drop in performance for COVID-19 is because many cases flagged by the system as “positive” for abnormalities were negative for COVID-19, but nevertheless contained abnormal CXR findings that needed attention. This further highlights the usefulness of abnormality detectors even if disease-specific models are available.

In addition, it’s important to note that there is a difference between generalization to unseen diseases (i.e., tuberculosis and COVID-19) versus generalization to unseen CXR findings (e.g., pleural effusion, consolidation/infiltrate). In this study, we demonstrated the generalizability of the system to unseen diseases but not necessarily unseen CXR findings.

Sample chest X-rays of true and false positives, and true and false negatives for (A) general abnormalities, (B) tuberculosis, and (C) COVID-19. On each CXR, we outline in red the areas on which the model focused to identify abnormalities (i.e., the class activation map), and outline the regions of interest indicated by a radiologist in yellow.

Potential Benefits in the Clinic
To understand the potential utility of the deep learning model in improving clinical workflow, we simulated its use for case prioritization, where abnormal cases are “expedited” ahead of normal cases. In these simulations, the system reduced the turnaround time for abnormal cases by up to 28%. This reprioritization setup could be used to divert complex abnormal cases to cardiothoracic specialist radiologists, enable rapid triage of cases that may need urgent decisions, and provide the opportunity to batch negative CXRs for streamlined review.

Impact of a simulated deep learning model–based prioritization in comparison with random review order for (A) general abnormalities, (B) tuberculosis, and (C) COVID-19. The red bars indicate sequences of abnormal CXRs in red and normal CXRs in pink; a greater density of red towards the left indicates abnormal CXRs are reviewed sooner than normal ones. The histograms indicate the average improvement in turnaround time.

Additionally, we found that the system can be used as a pre-trained model to improve other ML algorithms for chest X-rays, especially when data is limited. For example, we used the normal/abnormal classifier in our recent study to detect pulmonary tuberculosis from chest X-rays. Abnormality and tuberculosis detectors can play a critical role in supporting early diagnosis in regions that lack access to resources like trained radiologists or molecular testing.

Sharing Improved Reference Standard Labels
Much work remains to be done to realize the potential of ML to aid chest X-ray interpretation around the world. In particular, obtaining high-quality labels on de-identified data can be a significant barrier to developing and evaluating ML algorithms in healthcare. To accelerate these efforts, we are expanding upon our previous label release by releasing the labels used in this study for the publicly available ChestX-ray14 dataset. We look forward to future machine learning projects by the community in this space.

AcknowledgementsKey contributors to this project at Google include Zaid Nabulsi, Andrew Sellergren‎, Shahar Jamshy, Charles Lau, Eddie Santos, Atilla P. Kiraly, Wenxing Ye, Jie Yang, Rory Pilgrim, Sahar Kazemzadeh, Jin Yu, Greg S. Corrado, Lily Peng, Krish Eswaran, Daniel Tse, Neeral Beladia, Yun Liu, Po-Hsuan Cameron Chen, Shravya Shetty. Significant contributions and input were also made by radiologist collaborators Sreenivasa Raju Kalidindi, Mozziyar Etemadi, Florencia Garcia Vicente, David Melnick. For the CXR-14 dataset, we thank the NIH Clinical Center for making it publicly available. For tuberculosis data collection, thanks go to Sameer Antani, Stefan Jaeger, Sema Candemir, Zhiyun Xue, Alex Karargyris, George R. Thomas, Pu-Xuan Lu, Yi-Xiang Wang, Michael Bonifant, Ellan Kim, Sonia Qasba, and Jonathan Musco. The authors would also like to acknowledge many members of the Google Health Radiology and labeling software teams, in particular Shruthi Prabhakara, Scott McKinney, and Akib Uddin. Sincere appreciation also goes to the radiologists who enabled this work with their image interpretation and annotation efforts throughout the study; Jonny Wong for coordinating the imaging annotation work; Gavin Bee, Mikhail Fomitchev, Shabir Adeel, Jeff Bertram, and Benedict Noero for data releasing; David F. Steiner, Kunal Nagpal, and Michael D. Howell for providing feedback on the manuscript; Craig Mermel, Lauren Winer, Johnny Luu, Adrienne Welch, Annisah Um'rani, and Ashley Zlatinov for feedback on the blogpost.


1Labels include atelectasis, cardiomegaly, effusion, infiltration, mass, nodule, pneumonia, pneumothorax, consolidation, edema, emphysema, fibrosis, pleural thickening, hernia, other abnormality, and normal vs abnormal. 

Source: Google AI Blog


Recreating Natural Voices for People with Speech Impairments

On June 2nd, 2021, Major League Baseball in the United States celebrated Lou Gehrig Day, commemorating both the day in 1925 that Lou Gehrig became the Yankees’ starting first baseman, and the day in 1941 that he passed away from amyotrophic lateral sclerosis (ALS, also known as Lou Gehrig’s disease) at the age of 37. ALS is a progressive neurodegenerative disease that affects motor neurons, which connect the brain with the muscles throughout the body, and govern muscle control and voluntary movements. When voluntary muscle control is affected, people may lose their ability to speak, eat, move and breathe.

In honor of Lou Gehrig, former NFL player and ALS advocate Steve Gleason, who lost his ability to speak due to ALS, recited Gehrig’s famous “Luckiest Man” speech at the June 2nd event using a recreation of his voice generated by a machine learning (ML) model. Gleason’s voice recreation was developed in collaboration with Google’s Project Euphonia, which aims to empower people who have impaired speaking ability due to ALS to better communicate using their own voices.

Steve Gleason, who lost his voice to ALS, worked with Google’s Project Euphonia to generate a speech in his own voice in honor of Lou Gehrig. A portion of Gleason’s speech was broadcast in ballparks across the country during the 4th inning on June 2nd, 2021.

Today we describe PnG NAT, the model adopted by Project Euphonia to recreate Steve Gleason’s voice. PnG NAT is a new text-to-speech synthesis (TTS) model that merges two state-of-the-art technologies, PnG BERT and Non-Attentive Tacotron (NAT), into a single model. It demonstrates significantly better quality and fluency than previous technologies, and represents a promising approach that can be extended to a wider array of users.

Recreating a Voice
Non-Attentive Tacotron (NAT) is the successor to Tacotron 2, a sequence-to-sequence neural TTS model proposed in 2017. Tacotron 2 used an attention module to connect the input text sequence and the output speech spectrogram frame sequence, so that the model knows which part of the text to pay attention to when generating each time step of the synthesized speech spectrogram. Tacotron 2 was the first TTS model that was able to synthesize speech that sounds as natural as a person speaking. However, with extensive experimentation we discovered that there is a small probability that the model can suffer from robustness issues — such as babbling, repeating, or skipping part of the text — due to the inherent flexibility of the attention mechanism.

NAT improves upon Tacotron 2 by replacing the attention module with a duration-based upsampler, which predicts a duration for each input phoneme and upsamples the encoded phoneme representation so that the output length corresponds to the length of the predicted speech spectrogram. Such a change both resolves the robustness issue, and improves the naturalness of the synthesized speech. This approach also enables precise control of the speech duration for each phoneme of the input text while still maintaining highly natural synthesis quality. Because recordings of people with ALS often exhibit disfluent speech, this ability to exert per-phoneme control is key for achieving the fluency of the recreated voice.

Non-Attentive Tacotron (NAT) model.

While NAT addresses the robustness issue and enables precise duration control in neural TTS, we build upon it to further improve the natural language understanding of the TTS input. For this, we apply PnG BERT, which uses an approach similar to BERT, but is specifically designed for TTS. It is pre-trained with self-supervision on both the phoneme representation and the grapheme representation of the same content from a large text corpus, and then is used as the encoder of the TTS model. This results in a significant improvement of the prosody and pronunciation of the synthesized speech, especially in difficult cases.

Take, for example, the following audio, which was synthesized from a regular NAT model that takes only phonemes as input:

In comparison, the audio synthesized from PnG NAT on the same input text includes an additional pause that makes the meaning more clear.

The input text to both models is, “To cancel the payment, press one; or to continue, two.” Notice the different pause lengths before the ending “two” in the two versions. The word “two” in the version output by the regular NAT model could be confused for “too”. Because “too” and “two” have identical pronunciation (and thus the same phoneme representation), the regular NAT model does not understand which of the two is appropriate, and assumes it to be the word that more frequently follows a comma, “too”. In contrast, the PnG NAT model can more easily tell the difference, because it takes graphemes in addition to phonemes as input, and thus makes more appropriate pause.

The PnG NAT model integrates the pre-trained PnG BERT model as the encoder to the NAT model. The hidden representations output from the encoder are used by NAT to predict the duration of each phoneme, and are then upsampled to match the length of the audio spectrogram, as outlined above. In the final step, a non-attentive decoder converts the upsampled hidden representations into audio speech spectrograms, which are finally converted into audio waveforms by a neural vocoder.

PnG BERT and the pre-training objectives. Yellow boxes represent phonemes, and pink boxes represent graphemes.
PnG NAT: PnG BERT replaces the original encoder in the NAT model. The random masking for the Masked Language Model (MLM) pre-training is removed.

To recreate Steve Gleason’s voice, we first trained a PnG NAT model with recordings from 31 professional speakers, and then fine-tuned it with 30 minutes of Gleason’s recordings. Because these latter recordings were made after he was diagnosed with ALS, they exhibit signs of slurring. The fine tuned model was able to synthesize speech that sounds very similar to these recordings. However, because the symptoms of ALS were already present in Gleason’s speech, they exhibited some similar disfluencies.

To mitigate this, we leveraged the phoneme duration control of NAT as well as the model trained with professional speakers. We first predicted the durations of each phoneme for both a professional speaker and for Gleason, and then used the geometric mean of the two durations for each phoneme to guide the NAT output. As a result, the model is able to speak in Gleason’s voice, but more fluently than in the original recordings.

Here is the full version of the synthesized Lou Gehrig speech in Gleason’s voice:

Besides recreating voices for people with ALS, PnG NAT is also powering voices for a variety of customers through Google Cloud Custom Voice.

Project Euphonia
Of the millions of people around the world who have neurologic conditions that may impact their speech, such as ALS, cerebral palsy or Down syndrome, many may find it difficult to be understood, which can make face-to-face communication challenging. Using voice-activated technologies can be frustrating too, as they don’t always work reliably. Project Euphonia is a Google Research initiative focused on helping people with impaired speech be better understood. The team is researching ways to improve speech recognition for individuals with speech impairments (see recent blog post and segment in TODAY show), as well as customized text-to-speech technology (see Age of AI documentary featuring former NFL player Tim Shaw).

Acknowledgements
Many people across Google Research, Google Cloud and Consumer Apps, and Google Accessibility teams contributed to this project and the event, including Michael Brenner, Bob MacDonald, Heiga Zen, Yu Zhang, Jonathan Shen, Isaac Elias‎, Yonghui Wu, Anne Keck, Danielle Notaro, Kevin Hogan, Zack Kaplan, KR Liu, Kyndra Price, Zoe Ortiz.

Source: Google AI Blog