Tag Archives: Developer

AMP Cache Updates

Posted by John Coiner, Software Engineer

Today we are announcing a change to the domain scheme of the Google AMP Cache. Beginning soon, the Google AMP Cache will serve each site from its own subdomain of https://cdn.ampproject.org. This change will allow content served from the Google AMP Cache to be protected by the fundamental security model of the web: the HTML5 origin.

No immediate changes are required for most publishers of AMP documents. However, to benefit from the additional security, it is recommended that all AMP publishers update their CORS implementation in preparation for the new Google AMP Cache URL scheme. The Google AMP Cache will continue to support existing URLs, but those URLs will eventually redirect to the new URL scheme.

How subdomain names will be created on the Google AMP Cache

The subdomains created by the Google AMP Cache will be human-readable when character limits and technical specs allow, and will closely resemble the publisher's own domain.

When possible, the Google AMP Cache will create each subdomain by first converting the AMP document domain from IDN (punycode) to UTF-8. Every "-" (dash) will be replaced with "--"(2 dashes) and every "." (dot) will be replaced with a "-" (dash). For example, pub.com will map to pub-com.cdn.ampproject.org. Where technical limitations prevent a human readable subdomain, a one-way hash will be used instead.

Updates needed for hosts and service providers with remote endpoints

Due to the changes described above, CORS endpoints will begin seeing requests with new origins. The following updates will be required:

  • Expand request acceptance to the new subdomain: Sites that currently only accept CORS requests from https://cdn.ampproject.organd the publisher's own origins must update their systems to accept requests from https://[pub-com].cdn.ampproject.org, https://cdn.ampproject.org, and the AMP publisher's own origins.
  • Tighten request acceptance for security: Sites that currently accept CORS requests from https://*.ampproject.org as described in the AMP spec, can improve security by restricting acceptance to requests from https://[pub-com].cdn.ampproject.org, https://cdn.ampproject.org, and the AMP publisher's own origins. Support for https://*.ampproject.org is no longer necessary.
  • Support for new subdomain pattern by ads, analytics, and other technology providers: Service providers such as analytics and ads vendors that have a CORS endpoint will also need to ensure that their systems accept requests from the Google AMP Cache's subdomains (e.g.https://ampbyexample-com.cdn.ampproject.org), in addition to their own hosts.

Retrieving the Google AMP Cache URL

For platforms that display AMP documents and serve from the Google AMP Cache, the best way to retrieve Google AMP Cache URLs is to continue using the Google AMP Cache URL API. The Google AMP Cache URL API will be updated in Q1 2017 to return the new cache URL scheme that includes the subdomain.

You can use an interactive tool to find the Google AMP Cache subdomain generated for each site over at ampbyexample.com.


Timing

Google Search is planning to begin using the new URL scheme as soon as possible and is monitoring sites' compatibility. In addition, we will be reaching out to impacted parties, and we will make available a developer testing sandbox prior to launching to ensure a smooth transition.

Generating slides from spreadsheet data

Originally posted on G Suite Developers Blog

Posted by Wesley Chun (@wescpy), Developer Advocate, G Suite

The G Suite team recently launched the very first Google Slides API, opening up a whole new set of possibilities, including leveraging data already sitting in a spreadsheet or database, and programmatically generating slide decks or slide content based on that data. Why is this a big deal? One of the key advantages of slide decks is that they can take database or spreadsheet data and make it more presentable for human consumption. This is useful when the need arises to communicate the information reflected by that data to management or potential customers.

Walking developers through a short application demonstrating both the Sheets and Slides APIs to make this happen is the topic of today's DevByte video. The sample app starts by reading all the necessary data from the spreadsheet using the Sheets API. The Slides API takes over from there, creating new slides for the data, then populating those slides with the Sheets data.

Developers interact with Slides by sending API requests. Similar to the Google Sheets API, these requests come in the form of JSON payloads. You create an array like in the JavaScript pseudocode below featuring requests to create a cell table on a slide and import a chart from a Sheet:


var requests = [
   {"createTable": {
       "elementProperties":
           {"pageObjectId": slideID},
       "rows": 8,
       "columns": 4
   }},
   {"createSheetsChart": {
       "spreadsheetId": sheetID,
       "chartId": chartID,
       "linkingMode": "LINKED",
       "elementProperties": {
           "pageObjectId": slideID,
           "size": {
               "height": { ... },
               "width": { ... }
           },
           "transform": { ... }
       }
   }}
];
If you've got at least one request, say in a variable named requests (as above), including the Sheet's sheetID and chartID plus the presentation page's slideID. You'd then pass it to the API with just one call to the presentations().batchUpdate() command, which in Python looks like the below if SLIDES is your API service endpoint:
SLIDES.presentations().batchUpdate(presentationId=slideID,
       body=requests).execute()

Creating tables is fairly straightforward. Creating charts has some magical features, one of those being the linkingMode. A value of "LINKED" means that if the Sheet data changes (altering the chart in the Sheet), the same chart in a slide presentation can be refreshed to match the latest image, either by the API or in the Slides user interface! You can also request a plain old static image that doesn't change with the data by selecting a value of "NOT_LINKED_IMAGE" for linkingMode. More on this can be found in the documentationon creating charts, and check out the video where you'll see both those API requests in action.

For a detailed look at the complete code sample featured in the video, check out the deep dive post. We look forward to seeing the interesting integrations you build with the power of both APIs!

Calling European game developers, enter the Indie Games Contest by December 31

Posted by Matteo Vallone, Google Play Partner Development Manager

To build awareness of the awesome innovation and art that indie game developers are bringing to users on Google Play, we have invested heavily over the past year in programs like Indie Corner, as well as events like the Google Play Indie Games Festivals in North America and Korea.

As part of that sustained effort, we also want to celebrate the passion and innovation of indie game developers with the introduction of the first-ever Google Play Indie Games Contest in Europe. The contest will recognize the best indie talent in several countries and offer prizes that will help you get your game noticed by industry experts and gamers worldwide.

Prizes for the finalists and winners:

  • An open showcase held at the Saatchi Gallery in London
  • YouTube influencer campaigns worth up to 100,000 EUR
  • Premium placements on Google Play
  • Tickets to Google I/O 2017 and other top industry events
  • Promotions on our channels
  • Special prizes for the best Unity game
  • And more!

Entering the contest:

If you're based in Czech Republic, Denmark, Finland, France (coming soon), Germany, Iceland, Israel, Netherlands, Norway, Poland (coming soon), Romania, Spain, Sweden, Turkey, or UK (excl. Northern Ireland), have 15 or less full time employees, and published a new game on Google Play after 1 January 2016, you may now be eligible to enter the contest. If you're planning on publishing a new game soon, you can also enter by submitting a private beta. Check out all the details in the terms and conditions. Submissions close on 31 December 2016.

The process:

Up to 20 finalists will get to showcase their games at an open event at the Saatchi Gallery in London on the 16th February 2017. At the event, the top 10 will be selected by the event attendees and the Google Play team. The top 10 will then get the opportunity to pitch to a jury of industry experts, from which the final winner and runners up will be selected.

Even if someone is NOT entering the contest:

Even if you're not eligible to enter the contest, you can still register to attend the final showcase event in London on 16 February 2017, check out some great indie games, and have fun with various industry experts and indie developers. We will also be hosting a workshop for all indie games developers from across EMEA in the new Google office in Kings Cross the next day, so this will be a packed week.

Get started:

Enter the Indie Games Contest now and visit the contest site to find out more about the contest, the event, and the workshop.

Introducing the Firebase Demo Project

"All genuine learning comes from experience" - John Dewey
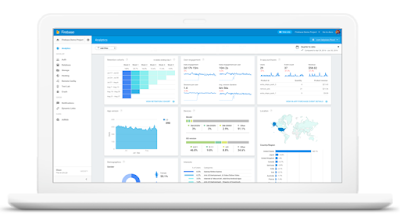
Earlier this year we introduced Firebase: a unified app platform for Android, iOS and mobile web development. It includes tools to help you develop faster, improve app quality, acquire and engage users, and monetize apps. There are many resources available to learn Firebase, from documentation, guides and free training courses (Android and iOS) we created, to advice from the Firebase community. However, there is nothing quite like learning through practical experience. To address this we’ve launched a fully functional Firebase Demo Project, available to everyone from today (get access here).

The Demo Project includes data from Flood It! (Android and iOS), a real puzzle game in which you have to flood the whole game board with one color in less than the allowed steps. Therefore, the data in the Firebase demo project is typical of what you might see for a gaming app with in-app purchases. It includes the following kinds of information:
  • Analytics: Attribution data, key events, cohorts and funnel reporting. This includes data about first opens (think of these like installs), in-app purchases, and more.
  • Remote Config: The parameters that control the app experience as well as the conditions which define which users receive which parameter values.
  • Test Lab: The automated test results from running the app on numerous device/OS combinations for quality assurance purposes.
  • Crash: Details on various crashes which have occurred in the app, including callstacks and device information.
  • Notifications: The notification campaigns that were sent to users to re-engage them. This includes data about the number of messages sent, opened and the number of conversions attributed to each campaign.

Firebase Demo Project: Analytics Dashboard
"Since the launch of Firebase we have been excited to continually build hands-on experience with its many features. Especially with the freely included and unlimited analytics solution for mobile apps, Firebase Analytics. The Firebase Demo Project has helped our team do just that and similar to what we've done with the Google Analytics Demo Account, we've incorporated the Firebase Demo Project within our training programs. This plays a critical part in helping our clients maximise their familiarity with Firebase." - Ben Gott, Analytics Director, Periscopix
Self-Learning

The Demo Project is useful for exploring Firebase features and reports. Here are a few things you can do with it:

  • View all standard Analytics reports populated with real data from the Flood It! app
  • Dissect Analytics reports by applying a variety of filters
  • See which ad campaigns are driving the most valuable users to the app
  • Track crashes and their impact on end users, and understand the steps that led to them
  • See the full notifications funnel for notifications sent from the Firebase Console
  • View Remote Config parameters to see how values are varied based on targeting parameters, especially feature flags and percent targeting for staging and Analytics audience targeting for customization
  • See test results from testing the app on real physical and virtual devices in the Firebase Test Lab

Education Programs
If you’re an educator trying to teach others to use Firebase then we encourage you to use the Demo Project within your course. For example, you can create practical exercises that students can complete using the Demo Project.

Access the Demo Project
You can get access to the Demo Project and learn more about it, from this help article. If you need some help, or have ideas to make the Demo Project more useful, please share it with the Google Analytics Community. We hope the Demo Project gives you a practical way to try new features and learn about Firebase.

Happy analyzing!
Posted by Deepak Aujla & Steve Ganem, Google Analytics team

Get Ready for the Chrome Dev Summit 2016

Posted by Paul Kinlan, Chrome Developer Relations

Chrome Dev Summit is almost here! We'll kick off live from San Francisco at the SFJAZZ Center, at 10:00 AM PT this coming Thursday, Nov 10th. This year's summit will focus on key themes that matter to you: Progressive, to build high quality web apps; Performance, to increase user engagement; and What's Next, a look at how the Chrome team is thinking about the future of the web.

While we're putting the finishing touches on the keynote, sessions, and code labs, we wanted to provide you with some tips to get ready to experience Chrome Dev Summit, either in-person or via the livestream.

Navigate the summit with notifications

To get the most out of Chrome Dev Summit, make sure to check out the schedule and set up notificationsfor the sessions you don't want to miss. These will help you plan your schedule whether you're in person or tuning in via the livestream.

Can't join us in person?

Don't worry, we've got you covered! Here are some ways you can connect with Chrome Dev Summit in real-time:

  • Tune in to the livestream at any time throughout the 2 day summit on developer.chrome.com/devsummit. We will stream the keynote and all sessions over the course of the event. If you want us to send you a reminder to tune into the livestream, sign up here.
  • Subscribeto the Chrome Developers YouTube Channel to stay up to date as we'll be publishing all of the talks from the event.
  • Join the conversation and send us your web questions on Twitter that include the #ChromeDevSummit hashtag or join our Slack by signing up here and a team of onsite Googlers will do their best to track down an answer in real time for you.

We're looking forward to having you with us you for 2 days of web fun, soon!

Don't forget to join the social conversation at #ChromeDevSummit.

How to set up Analytics on your AMP pages

Originally posted on Google Analytics blog

Posted by Arudea Mahartianto, Google AMP Specialist

In the digital world, whether you’re writing stories for your loyal readers, creating creative content that your fans love, helping the digital community, or providing items and services for your customer, understanding your audience is at the heart of it all. Key to unlocking that information is access to tools for measuring your audience and understanding their behavior. In addition to making your page load faster, Accelerated Mobile Pages (AMP) provides multiple analytics options without compromising on performance.

You can choose to use a solution like amp-pixel that behaves like a simple tracking pixel. It uses a single URL that allows variable substitutions, so it’s very customizable. See the amp-pixel documentation for more detail.

The amp-analytics component, on the other hand, is a powerful solution that recognizes many types of event triggers to help you collect specific metrics. Since amp-analytics is supported by multiple analytics providers, this means you can use amp-analytics to configure multiple endpoints and data sets. AMP then manages all of the instrumentation to come up with the data specified and shares it with these analytics solution providers.

To use amp-analytics, include the component library in your document's <head>:

<script async custom-element="amp-analytics"


src="https://cdn.ampproject.org/v0/amp-analytics-0.1.js"></script>

And then include the component as follows (for these examples, make sure to specify your own account number instead of the placeholder):

<amp-analytics type="googleanalytics">


<script type="application/json">
{
"vars": {
"account": "UA-YYYY-Y"
},
"triggers": {
"defaultPageview": {
"on": "visible",
"request": "pageview",
"vars": {
"title": "Name of the Article"
}
}
}
}
</script>
</amp-analytics>

The JSON format is super flexible for describing several different types of events and it does not include any JavaScript code which could potentially lead to mistakes.

Expanding the above example, we can add another trigger, clickOnHeader:

<amp-analytics type="googleanalytics">
<script type="application/json">
{
"vars": {
"account": "UA-YYYY-Y"
},
"triggers": {
"defaultPageview": {
"on": "visible",
"request": "pageview",
"vars": {
"title": "Name of the Article"
}
},
"clickOnHeader": {
"on": "click",
"selector": "#header",
"request": "event",
"vars": {
"eventCategory": "examples",
"eventAction": "clicked-header"
}
}
}
}
</script>
</amp-analytics>

For a detailed description of data sets you can request, as well as the complete list of analytics providers supporting amp-analytics, check out the amp-analytics documentation. You can also see more implementation examples in the Amp By Example site.

If you want to conduct a user experience experiment on your AMP pages, such as an A/B test, you can use the amp-experimentelement. Any configurations done in this element will also be exposed to amp-analytics and amp-pixel, so you can easily do a statistical analysis of your experiment.

There are still plenty of ongoing developments for AMP analytics to help you gain insights as you AMPlify the user experience on your site. Visit the AMP Project roadmap to see a summary of what the team is cooking up. If you see some features missing, please file a request on GitHub.

How to set up Analytics on your AMP page


In the digital world, whether you’re writing stories for your loyal readers, creating creative content that your fans love, helping the digital community, or providing items and services for your customer, understanding your audience is at the heart of it all. Key to unlocking that information is access to tools for measuring your audience and understanding their behavior. In addition to making your page load faster, Accelerated Mobile Pages (AMP) provides multiple analytics options without compromising on performance.

You can choose to use a solution like amp-pixel that behaves like a simple tracking pixel. It uses a single URL that allows variable substitutions, so it’s very customizable. See the amp-pixel documentation for more detail.

The amp-analytics component, on the other hand, is a powerful solution that recognizes many types of event triggers to help you collect specific metrics. Since amp-analytics is supported by multiple analytics providers, this means you can use amp-analytics to configure multiple endpoints and data sets. AMP then manages all of the instrumentation to come up with the data specified and shares it with these analytics solution providers.

To use amp-analytics, include the component library in your document's <head>:

<script async custom-element="amp-analytics" src="https://cdn.ampproject.org/v0/amp-analytics-0.1.js"></script>


And then include the component as follows (for these examples, make sure to specify your own account number instead of the placeholder):

<amp-analytics type="googleanalytics">
<script type="application/json">
{
 "vars": {
   "account": "UA-YYYY-Y"
 },
 "triggers": {
   "defaultPageview": {
     "on": "visible",
     "request": "pageview",
     "vars": {
       "title": "Name of the Article"
     }
   }
 }
}
</script>
</amp-analytics>


The JSON format is super flexible for describing several different types of events and it does not include any JavaScript code which could potentially lead to mistakes.

Expanding the above example, we can add another trigger, clickOnHeader:

<amp-analytics type="googleanalytics">
<script type="application/json">
{
 "vars": {
   "account": "UA-YYYY-Y"
 },
 "triggers": {
   "defaultPageview": {
     "on": "visible",
     "request": "pageview",
     "vars": {
       "title": "Name of the Article"
     }
   },
   "clickOnHeader": {
     "on": "click",
     "selector": "#header",
     "request": "event",
     "vars": {
       "eventCategory": "examples",
       "eventAction": "clicked-header"
     }
   }
 }
}
</script>
</amp-analytics>

For a detailed description of data sets you can request, as well as the complete list of analytics providers supporting amp-analytics, check out the amp-analytics documentation. You can also see more implementation examples in the Amp By Example site.

If you want to conduct a user experience experiment on your AMP pages,  such as an A/B test, you can use the amp-experiment element. Any configurations done in this element will also be exposed to amp-analytics and amp-pixel, so you can easily do a statistical analysis of your experiment.

There are still plenty of ongoing developments for AMP analytics to help you gain insights as you AMPlify the user experience on your site. Visit the AMP Project roadmap to see a summary of what the team is cooking up. If you see some features missing, please file a request on GitHub.

Posted by Arudea Mahartianto, Google AMP Specialist

Launchpad Build Event Series – Sub-Saharan Africa

Posted by Mercy Orangi, Developer Ecosystem Community Manager

Back in May at Google I/O, we announced the expansion Firebase, a mobile platform that enables you to quickly develop high-quality applications, grow your user base and earn more money. To help developers better understand the range of features in Firebase, our Developer Relations team in Sub-Saharan Africa will be hosting the Launchpad Build Event Series in Sub-Saharan Africa The first leg will be held in Lagos (22nd Sep), followed by Nairobi (26th Sep) and finally Cape Town (29th Sep).

Launchpad Build is an event series aimed at raising awareness, amongst intermediate and expert developers with an existing Web or Android application, around important tools available today.

At this event, engage in talks and hands-on codelabs focused on Firebase Analytics, Firebase Cloud Messaging, Firebase Crash Reporting, Firebase Test Lab, Pirate Metrics, Serverless with Firebase, Tensor Flow and much more. Through the Launchpad Build event, developers will get skills and resources necessary to start using Firebase in their applications.

This is a technical event, with multiple sessions on Firebase, facilitated by Googlers and Google Developer Experts from around the world.

For further information, visit the Launchpad Build Event Series Sub-Saharan Africa Website.

Register now: bit.ly/lpbuildssa2016

Applicants will be contacted with necessary details.

Your emails, optimized for every screen with responsive design

(Cross posted from the Apps Developer Blog)

Posted by Pierce Vollucci, Associate Product Manager, Gmail and Steve Bazyl, Developer Programs Engineer, Google Apps

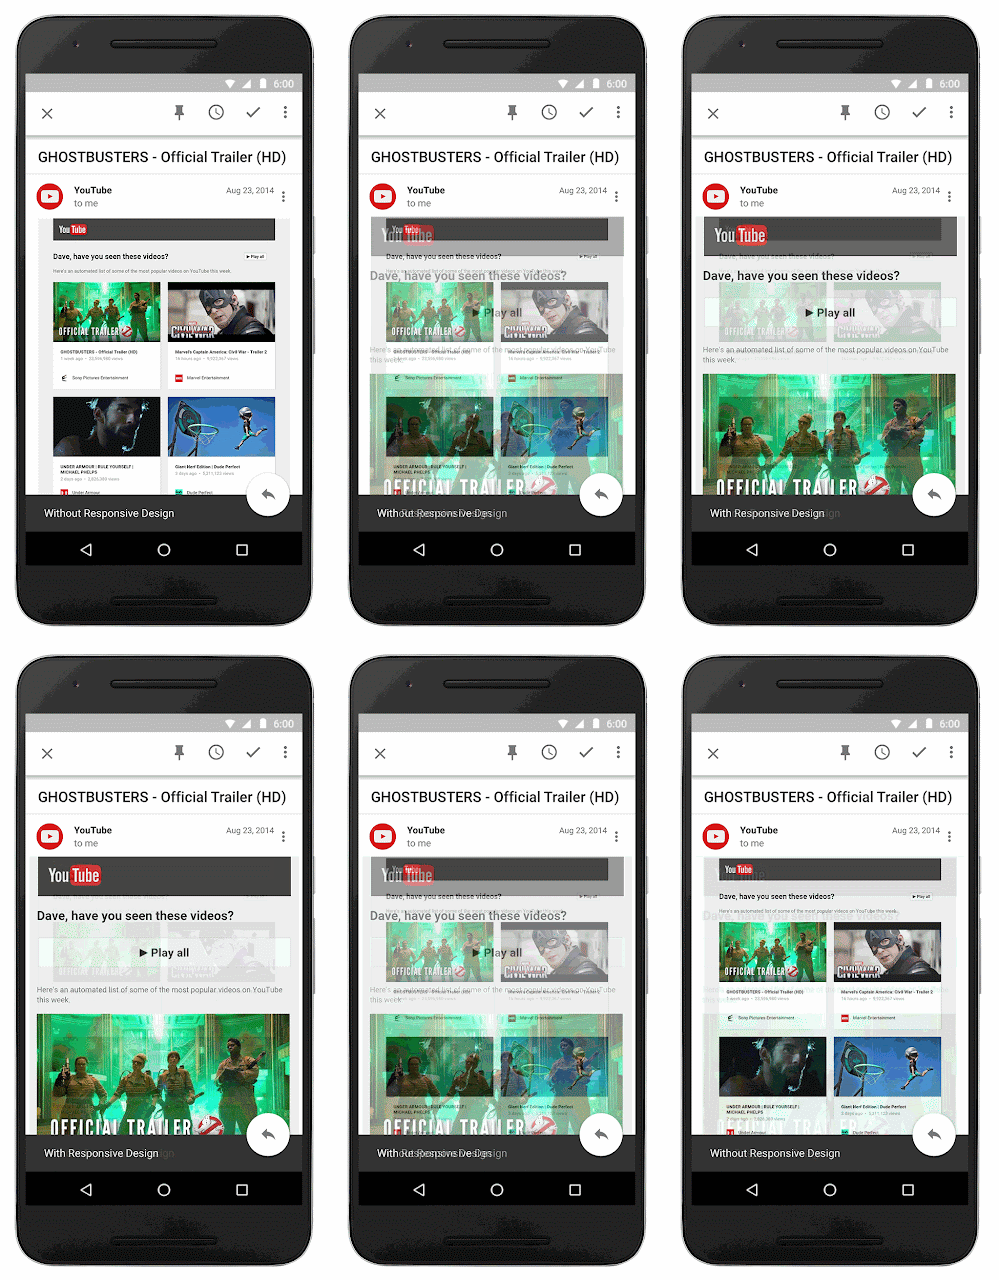
When you send emails, your recipients might read them on a computer, tablet, or phone—or more likely, all three. However your message might look different on all these devices. Later this month, you’ll be able to use CSS media queries with Gmail and Inbox by Gmail to ensure that your message is formatted the way you intended, whether it's viewed on a computer, a phone in portrait mode, or a tablet in landscape mode. You’ll be able to change styles based on width, rotation, and resolution, allowing for more responsive formatting to optimize your email for every device.

Example of an email before and after responsive design

In discussions with email designers, these supported CSS rules were identified as the most useful media queries to support responsive design. This is just one part of an overall effort to expand CSS support in Gmail and to give email designers more control over how their messages are rendered. For example, the CSS below applies the color red when the screen width exceeds 500px.
@media screen and (min-width: 500px) {
.colored {
color:red;
}
}
You can find the full list of supported CSS rules in the developer documentation. We hope this reference helps you create more feature-rich, responsive email for users. Happy formatting!


Launch Details
Release track:
Launching to both Rapid release and Scheduled release

Rollout pace:
Gradual rollout (more than 3 days for feature visibility)

Impact:
All end-users for domains with Google+ enabled

Action:
Change management suggested

More Information
Gmail Blog (for end-users)