Category Archives: Open Source Blog

News about Google’s open source projects and programs

Open sourcing our Rust crate audits

Many open-source projects at Google use Rust, a modern systems language designed for building reliable and efficient software. Google has been investing in the Rust community for a long time; we helped found the Rust Foundation, many Googlers work on upstream Rust as part of their job, and we financially support key Rust projects. Today, we're continuing our commitment to the open-source Rust community by aggregating and publishing audits for Rust crates that we use in open-source Google projects.

Rust makes it easy to encapsulate and share code in crates, which are reusable software components that are like packages in other languages. We embrace the broad ecosystem of open-source Rust crates, both by leveraging crates written outside of Google and by publishing several of our own.

All third-party code carries an element of risk. Before a project starts using a new crate, members usually perform a thorough audit to measure it against their standards for security, correctness, testing, and more. We end up using many of the same dependencies across our open-source projects, which can result in duplicated effort when several different projects audit the same crate. To de-duplicate that work, we've started sharing our audits across our projects. Now, we're excited to join other organizations in sharing them with the broader open-source community.

Our crate audits are continually aggregated and published on GitHub under our supply-chain repository. They work with cargo vet to mechanically verify that:

  • a human has audited all of our dependencies and recorded their relevant properties, and
  • those properties satisfy the requirements for the current project

You can easily import audits done by Googlers into your own projects that attest to the properties of many open-source Rust crates. Then, equipped with this data, you can decide whether crates meet the security, correctness, and testing requirements for your projects. Cargo vet has strong support for incrementally vetting your dependencies, so it's easy to introduce to existing projects.

Different use cases have different requirements, and cargo vet allows you to independently configure the requirements for each of your dependencies. It may be suitable to only check a local development tool for actively malicious code – making sure it doesn't violate privacy, exfiltrate data, or install malware. But code deployed to users usually needs to meet a much stricter set of requirements – making sure it won't introduce memory safety issues, uses up-to-date cryptography, and conforms to its standards and specifications. When consuming and sharing audits, it’s important to consider how your project’s requirements relate to the facts recorded during an audit.

We hope that by sharing our work with the open-source community, we can make the Rust ecosystem even safer and more secure for everyone. ChromeOS and Fuchsia have already begun performing and publishing their audits in the above-mentioned supply-chain repository, and other Google open-source projects are set to join them soon. As more projects participate and we work through our collective audit backlog, our audits will grow to provide even more value and coverage. We're still early on in performing and sharing our audits through cargo vet, and the tool is still under active development. The details are likely to change over time, and we're excited to evolve and improve our processes and tooling as they do. We hope you'll find value in the work Googlers have done, and join us in building a safer and more secure Rust ecosystem.

By David Koloski, Fuchsia and George Burgess, Chrome OS

Accelerate AI development for Digital Pathology using EZ WSI DICOMWeb Python library

Overview

Digital pathology is changing the way pathology is practiced by making it easier to share images, collaborate with colleagues, and develop new AI algorithms that can improve the quality and cost of medical care. One of the biggest challenges of digital pathology is storing and managing the large volume of data generated. The Google Cloud Healthcare API provides a solution for this with a managed DICOM store, which is a secure, scalable, and performant way to store digital pathology images in a manner that is both standardized and interoperable.

However, performing image retrieval of specific patches (i.e. regions of interest) of a whole slide image (WSI) from the managed DICOM store using DICOMweb can be complex and requires DICOM format expertise. To address this, we are open sourcing EZ WSI (Whole Slide Image) DICOMWeb, a Python library that makes fetching these patches both efficient and easy-to-use.

How EZ WSI DICOMWeb works

EZ WSI DICOMweb facilitates the retrieval of arbitrary and sequential patches of a DICOM WSI from a DICOMWeb compliant Google Cloud Healthcare API DICOM store. Unlike downloading the entire DICOM series WSI and extracting patches locally from that file, which can increase network traffic, latency and storage space usage, EZ WSI DICOMweb retrieves only the necessary tiles for the desired patch directly through the DICOMweb APIs. This is simpler to use and abstracts away the following:

  • The need to fetch many tiles, which requires an understanding of DICOM data structure (e.g. offset & data hierarchy).
  • The need for a detailed understanding of the DICOMWeb APIs, REST payloads, and authentication, as well as addressing the possibility of redundant requests if several patches are fetched and there are overlapping tiles.
  • The need to decode images on the server if client side decoding is not supported, which increases the time it takes to transfer data and the size of the data being transferred.

EZ WSI DICOMWeb allows researchers and developers to focus on their ML tasks rather than the intricacies of DICOM. Developers do not need to have an in-depth understanding of DICOM data structuring or the DICOM API. The library provides a simple and intuitive functionality that allows developers to efficiently fetch DICOM images using only the Google Cloud Platform (GCP) Resource Name and DICOM Series path without any pixel recompression.

Case Study: Generating Patches for AI Workflows

A typical pathology WSI could be on the order of 40,000 pixels in length or width. However, an AI model that is trained to assess that WSI may only analyze a patch that is 512 x 512 pixels at a time. The way the model can operate over the entire WSI is by using a sliding windows approach. We demonstrate how that can be done using EZ WSI DICOMWeb.

First, we create a DicomSlide object using the DICOMweb client and interface. This can be done with just a few lines of code.

dicom_web_client = dicom_web.DicomWebClientImpl() dwi = dicom_web_interface.DicomWebInterface(dicom_web_client) ds = dicom_slide.DicomSlide( dwi=dwi, path=gcp_resource_name+dicom_series_path, enable_client_slide_frame_decompression = True ) ds.get_image(desired_magnification) # e.g. '0.625X'

This DicomSlide represents the entire WSI, as illustrated below.

Image of a WSI at the magnitude of 0.625X rendered by matplotlib

The above image leverages EZ WSI’s DicomSlide module to fetch an entire WSI at the requested magnification of 0.625X and uses matplotlib to render it, see the sample code for more details.

By providing coordinates, DicomSlide’s get_patch() method allows us to manually extract just the two sections of tissue at supported magnification with coordinates as pictured below.

tissue_patch = ds.get_patch( desired_magnification, x=x_origin, y=y_origin, width=patch_width, height=patch_ height )
Left tissue sample and right tissue sample at 0.625X magnitude, rendered by matplotlib

We can effectively zoom in on patches programmatically by reducing the window size and increasing the magnification using the same get patch method from above.

image of three panels showing the same interesting patch at 0.625, 2.5X, and 40X magnitude, rendered by matplotlib

Our ultimate goal is to generate a set of patches that can be used in a downstream AI application from this WSI.

image showing patch generation at 10X with 0.625X mask, rendered by matplotlib

To do this, we call PatchGenerator. It works by sliding a window of a specified size with a specified stride size across the image, heuristically ignoring tissue-less regions at a specified magnification level.

patch_gen = patch_generator.PatchGenerator( slide=ds, stride_size=stride_size, # the number of pixels between patches patch_size=patch_size, # the length and width of the patch in pixels magnification=patch_magnification, # magnification to generate patches at max_luminance=0.8, # defaults to .8, heuristic to evaluate where tissue is. tissue_mask_magnification=mask_magnification, )

The result is a list of patches that can be used as input into a machine learning algorithm.

image showing patch generation at 40X with 0.625X mask, rendered by matplotlib

Conclusion

We have built this library to make it easy to directly interact with DICOM WSIs that are stored in Google's DICOMWeb compliant Healthcare API DICOM store and extract image patches for AI workflows. Our hope is that by making this available, we can help accelerate the development of cutting edge AI for digital pathology in Google Cloud and beyond.

Links: Github, GCP-DICOMWeb

By Google HealthAI and Google Cloud Healthcare teams

PJRT: Simplifying ML Hardware and Framework Integration

Infrastructure fragmentation in Machine Learning (ML) across frameworks, compilers, and runtimes makes developing new hardware and toolchains challenging. This inhibits the industry’s ability to quickly productionize ML-driven advancements. To simplify the growing complexity of ML workload execution across hardware and frameworks, we are excited to introduce PJRT and open source it as part of the recently available OpenXLA Project.

PJRT (used in conjunction with OpenXLA’s StableHLO) provides a hardware- and framework-independent interface for compilers and runtimes. It simplifies the integration of hardware with frameworks, accelerating framework coverage for the hardware, and thus hardware targetability for workload execution.

PJRT is the primary interface for TensorFlow and JAX and fully supported for PyTorch, and is well integrated with the OpenXLA ecosystem to execute workloads on TPU, GPU, and CPU. It is also the default runtime execution path for most of Google’s internal production workloads. The toolchain-independent architecture of PJRT allows it to be leveraged by any hardware, framework, or compiler, with extensibility for unique features. With this open-source release, we're excited to allow anyone to begin leveraging PJRT for their own devices.

If you’re developing an ML hardware accelerator or developing your own compiler and runtime, check out the PJRT source code on GitHub and sign up for the OpenXLA mailing list to quickly bootstrap your work.

Vision: Simplifying ML Hardware and Framework Integration

We are entering a world of ambient experiences where intelligent apps and devices surround us, from edge to the cloud, in a range of environments and scales. ML workload execution currently supports a combinatorial matrix of hardware, frameworks, and workflows, mostly through tight vertical integrations. Examples of such vertical integrations include specific kernels for TPU versus GPU, specific toolchains to train and serve in TensorFlow versus PyTorch. These bespoke 1:1 integrations are perfectly valid solutions but promote lock-in, inhibit innovation, and are expensive to maintain. This problem of a fragmented software stack is compounded over time as different computing hardware needs to be supported.

A variety of ML hardware exists today and hardware diversity is expected to increase in the future. ML users have options and they want to exercise them seamlessly: users want to train a large language model (LLM) on TPU in the Cloud, batch infer on GPU or even CPU, distill, quantize, and finally serve them on mobile processors. Our goal is to solve the challenge of making ML workloads portable across hardware by making it easy to integrate the hardware into the ML infrastructure (framework, compiler, runtime).

Portability: Seamless Execution

The workflow to enable this vision with PJRT is as follows (shown in Figure 1):

  1. The hardware-specific compiler and runtime provider implement the PJRT API, package it as a plugin containing the compiler and runtime hooks, and register it with the frameworks. The implementation can be opaque to the frameworks.
  2. The frameworks discover and load one or multiple PJRT plugins as dynamic libraries targeting the hardware on which to execute the workload.
  3. That’s it! Execute the workload from the framework onto the target hardware.

The PJRT API will be backward compatible. The plugin would not need to change often and would be able to do version-checking for features.

Diagram of PJRT architecture
Figure 1: To target specific hardware, provide an implementation of the PJRT API to package a compiler and runtime plugin that can be called by the framework.

Cohesive Ecosystem

As a foundational pillar of the OpenXLA Project, PJRT is well-integrated with projects within the OpenXLA Project including StableHLO and the OpenXLA compilers (XLA, IREE). It is the primary interface for TensorFlow and JAX and fully supported for PyTorch through PyTorch/XLA. It provides the hardware interface layer in solving the combinatorial framework x hardware ML infrastructure fragmentation (see Figure 2).

Diagram of PJRT hardware interface layer
Figure 2: PJRT provides the hardware interface layer in solving the combinatorial framework x hardware ML infrastructure fragmentation, well-integrated with OpenXLA.

Toolchain Independent

PJRT is hardware and framework independent. With framework integration through the self-contained IR StableHLO, PJRT is not coupled with a specific compiler, and can be used outside of the OpenXLA ecosystem, including with other proprietary compilers. The public availability and toolchain-independent architecture allows it to be used by any hardware, framework or compiler, with extensibility for unique features. If you are developing an ML hardware accelerator, compiler, or runtime targeting any hardware, or converging siloed toolchains to solve infrastructure fragmentation, PJRT can minimize bespoke hardware and framework integration, providing greater coverage and improving time-to-market at lower development cost.

Driving Impact with Collaboration

Industry partners such as Intel and others have already adopted PJRT.

Intel

Intel is leveraging PJRT in Intel® Extension for TensorFlow to provide the Intel GPU backend for TensorFlow and JAX. This implementation is based on the PJRT plugin mechanism (see RFC). Check out how this greatly simplifies the framework and hardware integration with this example of executing a JAX program on Intel GPU.

"At Intel, we share Google's vision of modular interfaces to make integration easier and enable faster, framework-independent development. Similar in design to the PluggableDevice mechanism, PJRT is a pluggable interface that allows us to easily compile and execute XLA's High Level Operations on Intel devices. Its simple design allowed us to quickly integrate it into our systems and start running JAX workloads on Intel® GPUs within just a few months. PJRT enables us to more efficiently deliver hardware acceleration and oneAPI-powered AI software optimizations to developers using a wide range of AI Frameworks." - Wei Li, VP and GM, Artificial Intelligence and Analytics, Intel.

Technology Leader

We’re also working with a technology leader to leverage PJRT to provide the backend targeting their proprietary processor for JAX. More details on this to follow soon.

Get Involved

PJRT is available on GitHub: source code for the API and a reference openxla-pjrt-plugin, and integration guides. If you develop ML frameworks, compilers, or runtimes, or are interested in improving portability of workloads across hardware, we want your feedback. We encourage you to contribute code, design ideas, and feature suggestions. We also invite you to join the OpenXLA mailing list to stay updated with the latest product and community announcements and to help shape the future of an interoperable ML infrastructure.

Acknowledgements

Allen Hutchison, Andrew Leaver, Chuanhao Zhuge, Jack Cao, Jacques Pienaar, Jieying Luo, Penporn Koanantakool, Peter Hawkins, Robert Hundt, Russell Power, Sagarika Chalasani, Skye Wanderman-Milne, Stella Laurenzo, Will Cromar, Xiao Yu.

By Aman Verma, Product Manager, Machine Learning Infrastructure

Google Summer of Code 2023 accepted contributors announced!

We are pleased to announce the Google Summer of Code (GSoC) Contributors for 2023. Over the last few weeks, our 171 mentoring organizations have read through applications, had discussions with applicants, and made the difficult decision of selecting the GSoC Contributors they will be mentoring this summer.

Some notable results from this year’s application period:
  • 43,765 applicants from 160 countries
  • 7,723 proposals submitted
  • 967 GSoC contributors accepted from 65 countries
  • Over 2,400 mentors and organization administrators

Over the next few weeks, our GSoC 2023 Contributors will be actively engaging with their new open source community and getting acclimated with their organization. Mentors will guide the GSoC Contributors through the documentation and processes used by the community, as well as help with planning their milestones and projects for the summer. This Community Bonding period helps familiarize the GSoC Contributors with the languages and tools they will need to successfully complete their projects. Coding begins May 29th and most folks will wrap up September 5th, however, for the second year in a row, GSoC Contributors can request a longer coding period and wrap up their projects by mid-November instead.

We’d like to express our appreciation to the thousands of applicants who took the time to reach out to our mentoring organizations and submit proposals. Through the experience of asking questions, researching, and writing your proposals we hope you all learned more about open source and maybe even found a community you want to contribute to outside of Google Summer of Code! We always say that communication is key, and staying connected with the community or reaching out to other organizations is a great way to set the stage for future opportunities. Open source communities are always looking for new and eager collaborators to bring fresh ideas to the table. We hope you connect with an open source community or even start your own open source project!

There are a handful of program changes to this 19th year of GSoC and we are excited to see how our GSoC Contributors and mentoring organizations take advantage of these adjustments. A big thank you to all of our mentors and organization administrators who make this program so special.

GSoC Contributors—have fun this summer and keep learning! Your mentors and community members have dozens, and in some cases hundreds, of years of combined experience. Let them share their knowledge with you and help you become awesome open source contributors!

By Perry Burnham, Associate Program Manager for the Google Open Source Programs Office

gVisor improves performance with root filesystem overlay

Overview

Container technology is an integral part of modern application ecosystems, making container security an increasingly important topic. Since containers are often used to run untrusted, potentially malicious code it is imperative to secure the host machine from the container.

A container's security depends on its security boundaries, such as user namespaces (which isolate security-related identifiers and attributes), seccomp rules (which restrict the syscalls available), and Linux Security Module configuration. Popular container management products like Docker and Kubernetes relax these and other security boundaries to increase usability, which means that users need additional container security tools to provide a much stronger isolation boundary between the container and the host.

The gVisor open source project, developed by Google, provides an OCI compatible container runtime called runsc. It is used in production at Google to run untrusted workloads securely. Runsc (run sandbox container) is compatible with Docker and Kubernetes and runs containers in a gVisor sandbox. gVisor sandbox has an application kernel, written in Golang, that implements a substantial portion of the Linux system call interface. All application syscalls are intercepted by the sandbox and handled in the user space kernel.

Although gVisor does not introduce large fixed overheads, sandboxing does add some performance overhead to certain workloads. gVisor has made several improvements recently that help containerized applications run faster inside the sandbox, including an improvement to the container root filesystem, which we will dive deeper into.

Costly Filesystem Access in gVisor

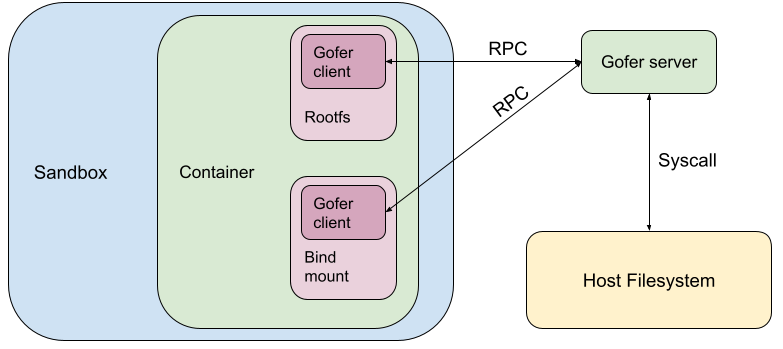
gVisor uses a trusted filesystem proxy process (“gofer”) to access the filesystem on behalf of the sandbox. The sandbox process is considered untrusted in gVisor’s security model. As a result, it is not given direct access to the container filesystem and its seccomp filters do not allow filesystem syscalls.

In gVisor, the container rootfs and bind mounts are configured to be served by a gofer.

Gofer mounts configuration in gVisor

When the container needs to perform a filesystem operation, it makes an RPC to the gofer which makes host system calls and services the RPC. This is quite expensive due to:

  1. RPC cost: This is the cost of communicating with the gofer process, including process scheduling, message serialization and IPC system calls.
    • To ameliorate this, gVisor recently developed a purpose-built protocol called LISAFS which is much more efficient than its predecessor.
    • gVisor is also experimenting with giving the sandbox direct access to the container filesystem in a secure manner. This would essentially nullify RPC costs as it avoids the gofer being in the critical path of filesystem operations.
  2. Syscall cost: This is the cost of making the host syscall which actually accesses/modifies the container filesystem. Syscalls are expensive, because they perform context switches into the kernel and back into userspace.
    • To help with this, gVisor heavily caches the filesystem tree in memory. So operations like stat(2) on cached files are serviced quickly. But other operations like mkdir(2) or rename(2) still need to make host syscalls.

Container Root Filesystem

In Docker and Kubernetes, the container’s root filesystem (rootfs) is based on the filesystem packaged with the image. The image’s filesystem is immutable. Any change a container makes to the rootfs is stored separately and is destroyed with the container. This way, the image’s filesystem can be shared efficiently with all containers running the same image. This is different from bind mounts, which allow containers to access the bound host filesystem tree. Changes to bind mounts are always propagated to the host and persist after the container exits.

Docker and Kubernetes both use the overlay filesystem by default to configure container rootfs. Overlayfs mounts are composed of one upper layer and multiple lower layers. The overlay filesystem presents a merged view of all these filesystem layers at its mount location and ensures that lower layers are read-only while all changes are held in the upper layer. The lower layer(s) constitute the “image layer” and the upper layer is the “container layer”. When the container is destroyed, the upper layer mount is destroyed as well, discarding the root filesystem changes the container may have made. Docker’s overlayfs driver documentation has a good explanation.

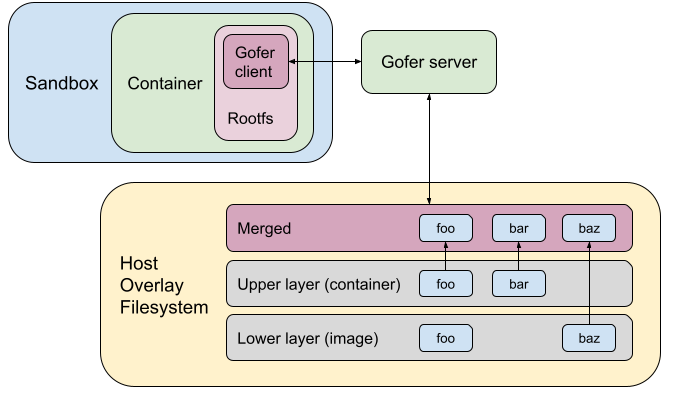
Rootfs Configuration Before

Let’s consider an example where the image has files foo and baz. The container overwrites foo and creates a new file bar. The diagram below shows how the root filesystem used to be configured in gVisor earlier. We used to go through the gofer and access/mutate the overlaid directory on the host. It also shows the state of the host overlay filesystem.

Rootfs configuration in gVisor earlier

Opportunity! Sandbox Internal Overlay

Given that the upper layer is destroyed with the container and that it is expensive to access/mutate a host filesystem from the sandbox, why keep the upper layer on the host at all? Instead we can move the upper layer into the sandbox.

The idea is to overlay the rootfs using a sandbox-internal overlay mount. We can use a tmpfs upper (container) layer and a read-only lower layer served by the gofer client. Any changes to rootfs would be held in tmpfs (in-memory). Accessing/mutating the upper layer would not require any gofer RPCs or syscalls to the host. This really speeds up filesystem operations on the upper layer, which contains newly created or copied-up files and directories.

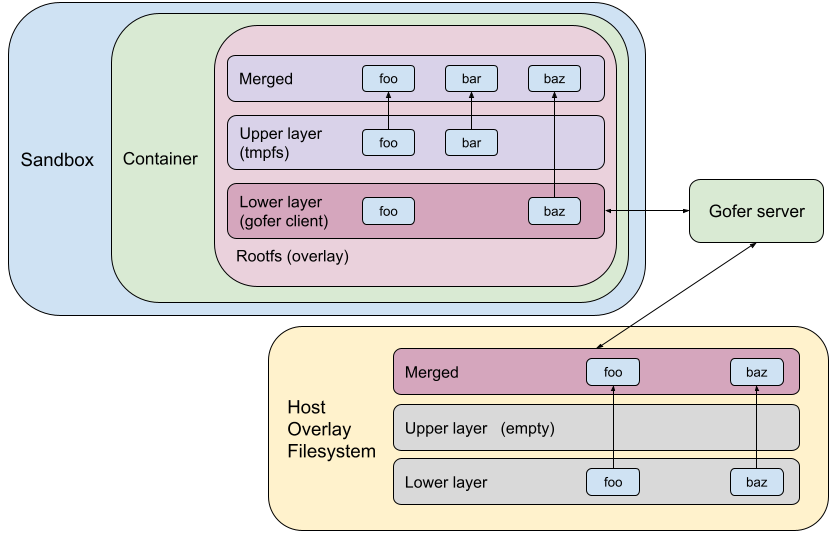
Using the same example as above, the following diagram shows what the rootfs configuration would look like using a sandbox-internal overlay.

Rootfs configuration in gVisor with internal overlay

Host-Backed Overlay

The tmpfs mount by default will use the sandbox process’s memory to back all the file data in the mount. This can cause sandbox memory usage to blow up and exhaust the container’s memory limits, so it’s important to store all file data from tmpfs upper layer on disk. We need to have a tmpfs-backing “filestore” on the host filesystem. Using the example from above, this filestore on the host will store file data for foo and bar.

This would essentially flatten all regular files in tmpfs into one host file. The sandbox can mmap(2) the filestore into its address space. This allows it to access and mutate the filestore very efficiently, without incurring gofer RPCs or syscalls overheads.

Self-Backed Overlay

In Kubernetes, you can set local ephemeral storage limits. The upper layer of the rootfs overlay (writeable container layer) on the host contributes towards this limit. The kubelet enforces this limit by traversing the entire upper layerstat(2)-ing all files and summing up their stat.st_blocks*block_size. If we move the upper layer into the sandbox, then the host upper layer is empty and the kubelet will not be able to enforce these limits.

To address this issue, we introduced “self-backed” overlays, which create the filestore in the host upper layer. This way, when the kubelet scans the host upper layer, the filestore will be detected and its stat.st_blocks should be representative of the total file usage in the sandbox-internal upper layer. It is also important to hide this filestore from the containerized application to avoid confusing it. We do so by creating a whiteout in the sandbox-internal upper layer, which blocks this file from appearing in the merged directory.

The following diagram shows what rootfs configuration would finally look like today in gVisor.

Rootfs configuration in gVisor with self-backed internal overlay

Performance Gains

Let’s look at some filesystem-intensive workloads to see how rootfs overlay impacts performance. These benchmarks were run on a gLinux desktop with KVM platform.

Micro Benchmark

Linux Test Project provides a fsstress binary. This program performs a large number of filesystem operations concurrently, creating and modifying a large filesystem tree of all sorts of files. We ran this program on the container's root filesystem. The exact usage was:

sh -c "mkdir /test && time fsstress -d /test -n 500 -p 20 -s 1680153482 -X -l 10"

You can use the -v flag (verbose mode) to see what filesystem operations are being performed.

The results were astounding! Rootfs overlay reduced the time to run this fsstress program from 262.79 seconds to 3.18 seconds! However, note that such microbenchmarks are not representative of real-world applications and we should not extrapolate these results to real-world performance.

Real-world Benchmark

Build jobs are very filesystem intensive workloads. They read a lot of source files, compile and write out binaries and object files. Let’s consider building the abseil-cpp project with bazel. Bazel performs a lot of filesystem operations in rootfs; in bazel’s cache located at ~/.cache/bazel/.

This is representative of the real-world because many other applications also use the container root filesystem as scratch space due to the handy property that it disappears on container exit. To make this more realistic, the abseil-cpp repo was attached to the container using a bind mount, which does not have an overlay.

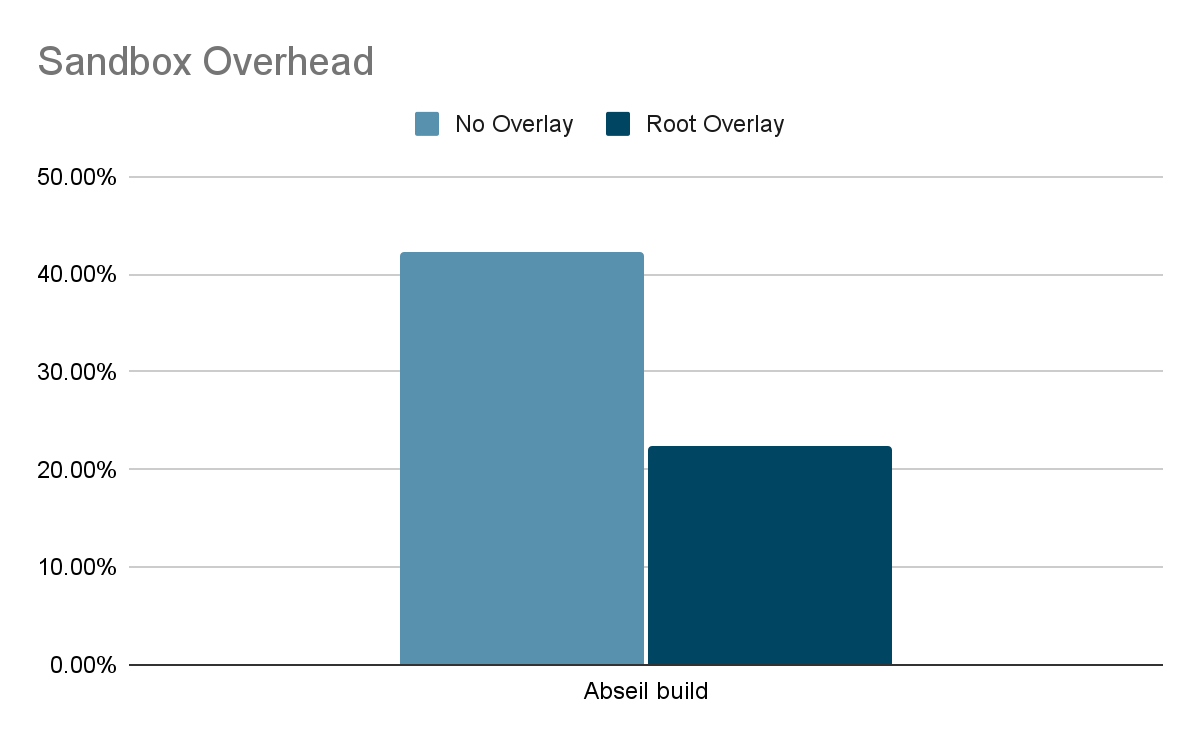
When measuring performance, we care about reducing the sandboxing overhead and bringing gVisor performance as close as possible to unsandboxed performance. Sandboxing overhead can be calculated using the formula overhead = (s-n)/n where ‘s’ is the amount of time taken to run a workload inside gVisor sandbox and ‘n’ is the time taken to run the same workload natively (unsandboxed). The following graph shows that rootfs overlay halved the sandboxing overhead for abseil build!

The impact of rootfs overlay on sandboxing overhead for abseil build

Conclusion

Rootfs overlay in gVisor substantially improves performance for many filesystem-intensive workloads, so that developers no longer have to make large tradeoffs between performance and security. We recently made this optimization the default in runsc. This is part of our ongoing efforts to improve gVisor performance. You can learn more about gVisor at gvisor.dev. You can also use gVisor in GKE with GKE Sandbox. Happy sandboxing!

Google’s Open Source Security Upstream Team: One Year Later

The Google Open Source Security Team (GOSST) was created in 2020 as a response to the increase of software supply chain attacks—those targeting software through vulnerabilities in other projects or infrastructure they depend on. In May 2022, GOSST announced the creation of the Google Open Source Maintenance Crew (now simply "GOSST Upstream Team"), a dedicated staff of GOSST engineers who spend 100% of their time working closely with upstream maintainers on improving the security of critical open source projects. This post takes a look back at the first year of the team’s activities, including goals, successes, and lessons learned along the way.

Why GOSST Upstream?

Every year, open source software becomes an even greater part of the software landscape—in fact, 2022 saw the most downloads of open source software ever. However, this popularity means open source software becomes an ever more appealing target for malicious actors.

Often, open source maintainers cite lack of time or resources to make security improvements to their projects or maintain them long-term. As a response, GOSST started working hands-on with some of the projects most critical to the open source ecosystem to help reduce the burden of implementing security enhancements, and assist with any additional maintenance incurred. Our goal with our contributions is to convey our respect, gratitude, and support for their valuable work.

What we do

We based our approach on examples from open source communities and recommendations from experienced maintainers and contributors:

  • A GOSST engineer manually analyzes each project to understand their context and security needs.
  • We follow the project's contribution guidelines to suggest the most impactful improvement selected specifically for the project's situation.
  • We file issues before creating any PRs to initiate a discussion and address any maintainer questions or concerns.
  • We focus on improvements that can be solved via pull request. Maintainers are busy, and we want to do as much of the work as possible for them to reduce their workload.
  • We treat our contributions as conversations. Maintainers know their project better than we do, and their input helps us ensure our security improvements satisfy their unique requirements.
  • We welcome all feedback on our work and related technologies, and if necessary, we work with the relevant teams to make improvements.
  • Depending on the need, we follow up with additional improvements and check in to address any ongoing maintenance needs for changes we’ve made.

This approach allows us to suggest and support improvements while still respecting maintainers’ time and effort.

Achievements since last year's announcement

Following this working model, we have proposed security improvements and made ourselves available to more than 181 critical open source projects since mid-2022 including widely-used projects such as numpy, etcd, xgboost, ruby, typescript, llvm, curl, docker, and more. We contacted them using whichever method was requested in the project’s guidelines: most interactions were via GitHub issues/PRs, but some were via email mailing lists, Jira boards, or internal forums.

To analyze each project we used OpenSSF Scorecard, which evaluates how well a project follows a set of security best practices. The result of the analysis is used to gather insight on possible future enhancements for the team to implement for the project, usually aiming to fix known vulnerabilities or any opportunities for security improvements. The contributions from this approach often include many common best practices, such as:

  • Adding a Security Policy (example)
  • Limiting unnecessary permissions on workflows (example)
  • Rewriting workflows that include dangerous patterns, such as allowing remote code execution in the repository context (example)
  • Adding the OpenSSF Scorecard action, to automatically check security status and report results (example)
  • Pinning dependencies (example)
  • Adopting a dependency-updating tool, and more

The team also looked for ways that projects could adopt the OpenSSF's Supply-chain Levels for Software Artifacts (SLSA) framework to harden their build and release processes. These contributions help secure projects against tampering and guarantee the integrity of their released packages.

A significant part of our contributions also helped projects adopt the OpenSSF Scorecard GitHub Action. When it's added to a project, each change to the code base triggers a review of security best practices and alerts projects to changes that could regress or harm their security posture. It also suggests actionable and specific changes that could enhance this posture. Additionally, the tool integrates with the OSV Scanner, which evaluates a project's transitive dependencies looking for known vulnerabilities.

As a result of these interactions with open source maintainers, the team received and conveyed valuable feedback for the tools we suggested. For example, we were able to address potential friction points for maintainers who adopt Scorecard, such as improving scoring criteria to better reflect their efforts to secure their projects. We’ve also gathered frequently asked questions we received from maintainers and created an FAQ to answer them. Additionally, the team added to documentation for the SLSA framework by clarifying the decoding process to access SLSA provenance created with the OpenSSF SLSA GitHub generator tool.

Still to come in 2023

In the year ahead, we’re going to expand our support to even more repositories, while still focusing on the projects most critical to the open source ecosystems. We'll also revisit projects we've already contributed to and see if there's more support we can offer. At the same time, we’re going to double down on our efforts to improve usability and documentation for security tools to make it even easier for maintainers to adopt security improvements with as little effort as possible.

Moving forward, we’ll also further encourage maintainers to take advantage of the OpenSSF's Secure Open Source Rewards program. This Linux Foundation program financially rewards developers for improving the security of important open source projects, and has already given $274,014 to open source maintainers to date. Maintainers can then choose to either have us raise PRs and implement the changes for them, or be financially rewarded for making the changes themselves – we'd still be available to answer questions that come up along the way.

Takeaways and how to get in touch

Based on the positive responses from open source maintainers this past year, we’re happy to count our efforts as time well spent. It’s clear that many open source maintainers welcome help from the companies that rely on their projects.

We’re constantly getting in touch with open source communities and love talking to folks about how we can help address security issues. The door is always open for community members to contact us too! Please reach out about anything related to our upstream work at [email protected].

We’re just getting started and look forward to giving back to even more projects. We hope other companies will join us and also invest in full-time developer teams dedicated to supporting the open source communities we all rely on.

By Diogo Sant'Anna and Joyce Brum, Google Open Source Security Team

Google Season of Docs announces participating organizations for 2023

Google Season of Docs provides support for open source projects to improve their documentation and gives professional technical writers an opportunity to gain experience in open source. Together we improve developer experience through better documentation and raise the profile of technical writers in open source.

For 2023, Season of Docs is pleased to announce that 13 organizations will be participating in the program! The list of participating organizations can be viewed on the website.

The project development phase now begins. Organizations and the technical writers they hire will work on their documentation projects from now until November 6th. For organizations still looking to hire a technical writer, the hiring deadline is May 10th.

How do I take part in Season of Docs as a technical writer?

Start by reading the technical writer guide and FAQs which give information about eligibility and choosing a project. Next, technical writers interested in working with accepted open source organizations can share their contact information via the Season of Docs GitHub repository; or they may submit a statement of interest directly to the organizations. We recommend technical writers reach out to organizations before submitting a statement of interest to discuss the project they’ll be working on and gain a better understanding of the organization. Technical writers do not need to submit a formal application through Season of Docs, so reach out to the organizations as soon as possible!

Will technical writers be paid while working with organizations accepted into Season of Docs?

Yes. Participating organizations will transfer funds directly to the technical writer via OpenCollective. Technical writers should review the organization's proposed project budgets and discuss their compensation and payment schedule with the organization before hiring. Check out our technical writer payment process guide for more details.

General Timeline

May 10

Technical writer hiring deadline

June 14

Organization administrators start reporting on their project status via monthly evaluations

November 21

Organization administrators submit their case study and final project evaluation

December 5

Google publishes the 2023 Season of Docs case studies and aggregate project data

May 1, 2024

Organizations begin to participate in post-program followup surveys

See the full timeline for details.

Care to join us?

Explore the Season of Docs website at g.co/seasonofdocs to learn more about the program. Use our logo and other promotional resources to spread the word. Review the timeline, check out the FAQ, and reach out to organizations now!

If you have any questions about the program, please email us at [email protected].

By Erin McKean, Google Open Source Programs Office

Flutter Cocoon Achieves SLSA Level 3

As part of Dart and Flutter's ongoing mission to harden security, we have achieved Supply Chain Levels for Software Artifacts (SLSA) Level 3 security on Flutter’s Cocoon application. Flutter achieved SLSA Level 2 on Cocoon in 2022.

Highlights

Flutter’s Cocoon application provides continuous integration orchestration for Flutter Infrastructure. Cocoon also helps integrate several CI services with GitHub and provides tools to make GitHub development easier. Achieving SLSA Level 3 for Cocoon means we have addressed all the security concerns of levels 1, 2, and 3 across the application. SLSA Level 3 is all about improving security and ensuring Cocoon’s source code and build artifacts are valid. This is done by adding increased validation to the artifact’s provenance.

What is Provenance?

Provenance is a description of how an artifact is built. Provenance includes information about the type of machine used to build the artifact, the location of the source code, and the instructions used to build the artifact. While SLSA Level 2 requires provenance to exist, SLSA Level 3 goes further by requiring proof that the provenance is valid and legitimate.

Cocoon uses the SLSA Verifier tool to verify provenance using a single-line command. With SLSA Verifier, all Cocoon builds will only be accepted if they have valid provenance. The provenance must prove the artifact was built on a Cloud Build instance with the source code coming from the Cocoon repository on GitHub. This ensures the Cocoon artifacts generated are safe and securely generated.

SLSA Verifier is easy to add into an existing workflow. For Cocoon, this required adding a provenance verification script to run SLSA Verifier on an artifact’s provenance. This script is configured in our Cloud Build template and must run and pass verification before an artifact can be deployed.

Future Work

In addition to improving SLSA Levels for Cocoon, the Flutter team is working towards improving our SLSA levels across some of our larger and more complex projects, such as Flutter and Engine. These projects have their own set of challenges, such as overhauling our artifact generation process to use Gn and Ninja (Engine), and hardening security requirements for our release workflows (Flutter). We are excited to continue to deliver new security updates and solutions!

Google Summer of Code 2023 contributor applications open!

Contributor applications for Google Summer of Code (GSoC) 2023 are now open! Students and open source beginners 18 years and older are welcome to apply during the registration period, which opened March 20th at 18:00 UTC and closes April 4th at 18:00 UTC.

Google Summer of Code is a global online program focused on bringing new contributors into open source software development. GSoC Contributors work with an open source organization on a 12+ week programming project under the guidance of mentors. GSoC’s mission is centered around bringing new contributors into open source communities through mentorship and collaboration.

Since 2005, GSoC has welcomed new developers into the open source community every year. The GSoC program has brought together over 19,000 contributors from 112 countries and 18,000 mentors from 800+ open source organizations.

2023 will be the 19th consecutive year hosting Google Summer of Code. We are keeping the big changes we made leading into the 2022 program, with one adjustment around eligibility described below:

  • Increased flexibility in project lengths (10-22 weeks, not a set 12 weeks for everyone).
  • Choice of project time commitment (medium at ~175 hours or large at ~350 hours)
  • For 2023, we are expanding the program to be open to students and beginners in open source software development.

We invite students and beginners in open source to check out Google Summer of Code. Now that applications are open, please keep a few helpful tips in mind:

Interested contributors may register and submit project proposals on the GSoC site from now until Tuesday, April 4th at 18:00 UTC.

Best of luck to all our applicants!

By Stephanie Taylor, Program Manager, and Perry Burnham, Associate Program Manager for the Google Open Source Programs Office

Getting To SLSA Level 2 with Tekton and Tekton Chains

Overview

As application developers, we achieve amazing results quickly by leveraging a rich ecosystem of freely available libraries, modules and frameworks that provide ready-to-use capabilities and abstract away from underlying complexity. This is so foundational to how we work that we'll nonchalantly build and publish an app that pulls in hundreds of dependencies without even thinking about it. And it's only fairly recently, in the wake of some very high profile and high impact compromises, that we've started to reckon with the fact that this wonderful ecosystem is also a security quagmire. All of the dependencies that feed into your build make up your software supply chain, and supply chains need to be secured. In this post, we'll show how an increasingly popular open source CI/CD system, Tekton, implements the OpenSSF SLSA framework to provide you with supply chain security guarantees.

Software Supply Chain Security

A software supply chain is anything that goes into or affects your code from development, through your CI/CD pipeline, until it gets deployed into production. Increasingly, the software supply chain has become a vector for attacks. The recent Log4j, SolarWinds, Kaseya, and Codecov hacks highlight vulnerable surface areas exposed by an insecure software supply chain.

Between 2020 and 2021, there has been a 650% Surge in OSS supply chain attacks, and Gartner projects that 45% of organizations worldwide will have experienced software supply chain attacks by 2025.

Supply Chains Levels for Software Artifacts (SLSA)

The Supply chain Levels for Software Artifacts (SLSA) framework is a check-list of controls to prevent tampering, improve integrity, and increase security in the packages and infrastructure used by projects, businesses or enterprises. SLSA formalizes criteria around software supply chain integrity to help the industry and open source ecosystem secure the software development life cycle at all stages.

As part of the framework, SLSA has multiple levels of assurances. These levels contain industry-recognized best practices to create four levels of increasing assurance.

Supply-Chain Levels for Software Artifacts (SLSA) Levels 1 through 4

SLSA provides a set of requirements that needs to be met for an artifact to be considered for a particular SLSA level.

Tekton + Tekton Chains

Tekton is a powerful and flexible, open source, cloud-native framework for creating CI/CD systems, allowing developers to build, test, and deploy across cloud providers and on-premise systems. Tekton consists of several subprojects which are relevant to SLSA:

  • Pipelines: A system that allows one to define a pipeline of CI/CD tasks and have it be orchestrated by the Tekton controller.
  • Chains: A standalone system which observes Pipelines and generates provenance for the artifacts built by Pipelines.

Tekton build processes are defined as tasks and pipelines. A Task is a collection of Steps that are defined and arranged in a specific order of execution as part of a continuous integration flow.

A Pipeline is a collection of Tasks defined and arranged in a specific order of execution as part of a continuous integration flow.

A TaskRun is an instantiation of a Task with specific inputs, outputs and execution parameters while a PipelineRun is an instantiation of a Pipeline.

A Task/Pipeline can define a set of Results. TaskRuns and PipelineRuns create Results as defined in the Task/Pipeline. Results are used to communicate to Tekton Chains run specifics like the uri and the digest of the built artifact.

Tasks, Pipelines, TaskRuns and PipelineRuns are defined through yaml files. The entire build is defined by the set of yaml files which define Tekton Tasks, Pipelines, TaskRuns and PipelineRuns. These yaml files can be checked in as code and run directly from the code repository.

Getting to SLSA L1: Automation + Provenance

For an artifact to be SLSA L1 compliant it should satisfy the following:

  1. Scripted build: All build steps are fully defined in some sort of “build script”. The only manual command, if any, is to invoke the build script.
  2. Provenance: The provenance is available to the consumer in a format that the consumer accepts. The format SHOULD be in-toto SLSA Provenance, but another format MAY be used if both producer and consumer agree and it meets all the other requirements.

Tekton Tasks, TaskRuns, Pipelines and PipelineRuns are specified in yaml files. These yaml files can be considered as scripts and can even be checked in into a code repository. These could also be run from code repositories. Tekton Chains provides a way to generate provenance in in-toto SLSA format. As such, Tekton can easily make builds which satisfy the SLSA L1 requirements.

Let's follow through with an example, which has the following files:

  • setup.sh: Sets up Google cloud to run an instance of the build specified in pipeline_run.yaml. It also installs Tekton Pipeline and Tekton Chains. In the production environment, this would be run once to set up the environment and all builds would use the same environment.
  • pipeline_run.yaml: This file is the actual build file that is run by Tekton Pipelines. The build here first clones a Github repo, builds the container specified in the source and uploads it to a Docker repository.
A workflow diagram depicting how Tekton can be used to acheive SLSA L2 requirements
The build script pipeline.yaml is the definition of the script while pipeline_run.yaml defines an instance of the build. It provides instance specific parameters for the build. Though both pipeline_run.yaml and pipeline.yaml are in source control for this example, the build definition is in pipeline.yaml and as such pipeline.yaml being in source control would satisfy the requirement of a source controlled build script.

kubectl create -f

https://raw.githubusercontent.com/google/tekton-slsa-demo/main/pipeline_run.yaml

Tekton Chains for Provenance Generation

Provenance is metadata about how an artifact was built, including the build process, top-level source, and dependencies. Knowing the provenance allows software consumers to make risk-based security decisions.

Tekton Chains observes TaskRuns and PipelineRuns in a Kubernetes cluster. Once the runs are done, Chains collects information (provenance) about the Run or the build process and the artifact created by the Run. It signs the provenance and stores the signed provenance. The provenance generated for the example build complies to the SLSA provenance schema and is explained further below.

Note that every step of the build has been recorded and can be reconstructed by following the steps in the provenance.

Next Steps: CI/CD @ SLSA L2

SLSA requires that for a build to be SLSA L2 compliant it should satisfy the following

  1. Every change to the source is tracked in a version control system
  2. All build steps were fully defined in some sort of “build script”. The only manual command, if any, was to invoke the build script.
  3. All build steps ran using some build service, not on a developer’s workstation.
  4. The provenance is available to the consumer in a format that the consumer accepts. The format SHOULD be in-toto SLSA Provenance, but another format MAY be used if both producer and consumer agree and it meets all the other requirements.
  5. The provenance’s authenticity and integrity can be verified by the consumer. This SHOULD be through a digital signature from a private key accessible only to the service generating the provenance.
  6. The data in the provenance MUST be obtained from the build service (either because the generator is the build service or because the provenance generator reads the data directly from the build service). Regular users of the service MUST NOT be able to inject or alter the contents.

Every change to the source is tracked in a version control system

Tekton does not explicitly enforce that the source is version controlled. Tekton users can enforce that the source is version controlled by writing an appropriate Task which will check for version control. The source should also be communicated by Tekton Pipelines to Tekton Chains through a result variable that is suffixed with -ARTIFACT_INPUTS.

All build steps were fully defined in some sort of “build script”. The only manual command, if any, was to invoke the build script.

This is a requirement for SLSA L1 as well and as explained above, Tekton provides a way to script the build through yaml files. The build is defined as a Pipeline (or Task) which can be saved as a yaml file and submitted into source control. The build instance which is defined as a PipelineRun (or TaskRun) can resolve the Pipeline (or Task) yaml from source control and use it for the current instance of the build.

All build steps ran using some build service, not on a developer’s workstation.

Tekton can be hosted on a cloud provider or on a hosted Kubernetes cluster and run as a build service. The build scripts can be submitted into source control (like GitHub) and Tekton can read the scripts directly from source control.

Provenance should be available

This is a requirement for SLSA L1 and as explained above Tekton Chains provides build provenance.

Provenance should be signed and Authenticated

As can be seen in the example, Tekton Chains creates and signs the build provenance. The signature can be verified anytime to ensure that the provenance has not been tampered after the build and the provenance is really created by the build process that claims to have built it. The signing is done according to the SLSA specification using the DSSE format.

Tekton Chains creates the provenance and signs it using a secure private key. Chains then uploads the signed provenance to a user-specified location, one of which is Google Cloud’s Container Analysis, which implements the open standard Grafeas API for storing provenance.

An annotated block of code depicting how Tekton Chains create provenance and signs it

Provenance should be generated by a Service

Note that the provenance in the example is generated by the Tekton Chains service and it cannot be modified after it has been generated, which is guaranteed by the signature.

SLSA requirements for the contents of the provenance, for the build to be considered L2.

All images below are extracted from the provenance of the example build. These can be verified by re-running the example.

1. Identifies artifact: The provenance MUST identify the output artifact via at least one cryptographic hash. The subject field in the SLSA provenance captures the location of the built artifact and the cryptographic hash associated with it. To be able to capture the artifact, Tekton Pipelines should populate the result variable -ARTIFACT_OUTPUTS with the location and the digest of the artifact.
A block of code extracted from the provenance of the example build
2. Identifies builder: The provenance identifies the entity that performed the build and generated the provenance. The builder.id field captures the builder that built the artifact.
A block of code extracted from the provenance of the example build
3. Identifies build instructions: The provenance identifies the top-level instructions used to execute the build. In our example, the build script is in source control. Recording the repo, the path in the repo and the commit hash will uniquely identify the build instructions used to build the artifact.
A block of code extracted from the provenance of the example build
4. Identifies source code: The provenance identifies the repository origin(s) for the source code used in the build. The materials field records all the dependencies used to build the artifact, one of which is the source code. In the example the source used is in a GitHub repo, and as such the repo name and the commit hash will uniquely identify the source code.
A block of code extracted from the provenance of the example build

Conclusion

SLSA aims to secure the software supply chain by providing guidelines on how the software build should be done. Tekton pipelines and Tekton chains implement those guidelines and help in securing the software supply chain.

By Prakash Jagatheesan (team: TektonCD), Brandon Lum (team: GOSST)