Posted by Shanqing Cai, Software Engineer, Tools and Infrastructure.
We are excited to share TensorFlow Debugger (tfdbg), a tool that makes debugging of machine learning models (ML) in TensorFlow easier. TensorFlow, Google's open-source ML library, is based on dataflow graphs. A typical TensorFlow ML program consists of two separate stages:
Setting up the ML model as a dataflow graph by using the library's Python API,
Training or performing inference on the graph by using the Session.run()method.
If errors and bugs occur during the second stage (i.e., the TensorFlow runtime), they are difficult to debug.
To understand why that is the case, note that to standard Python debuggers, the Session.run() call is effectively a single statement and does not exposes the running graph's internal structure (nodes and their connections) and state (output arrays or tensors of the nodes). Lower-level debuggers such as gdb cannot organize stack frames and variable values in a way relevant to TensorFlow graph operations. A specialized runtime debugger has been among the most frequently raised feature requests from TensorFlow users.
tfdbg addresses this runtime debugging need. Let's see tfdbg in action with a short snippet of code that sets up and runs a simple TensorFlow graph to fit a simple linear equation through gradient descent.
import numpy as np import tensorflow as tf import tensorflow.python.debug as tf_debug xs = np.linspace(-0.5, 0.49, 100) x = tf.placeholder(tf.float32, shape=[None], name="x") y = tf.placeholder(tf.float32, shape=[None], name="y") k = tf.Variable([0.0], name="k") y_hat = tf.multiply(k, x, name="y_hat") sse = tf.reduce_sum((y - y_hat) * (y - y_hat), name="sse") train_op = tf.train.GradientDescentOptimizer(learning_rate=0.02).minimize(sse)
sess = tf_debug.LocalCLIDebugWrapperSession(sess) for _ in range(10): sess.run(train_op, feed_dict={x: xs, y: 42 * xs})
As the highlighted line in this example shows, the session object is wrapped as a class for debugging (LocalCLIDebugWrapperSession), so the calling the run() method will launch the command-line interface (CLI) of tfdbg. Using mouse clicks or commands, you can proceed through the successive run calls, inspect the graph's nodes and their attributes, visualize the complete history of the execution of all relevant nodes in the graph through the list of intermediate tensors. By using the invoke_stepper command, you can let the Session.run() call execute in the "stepper mode", in which you can step to nodes of your choice, observe and modify their outputs, followed by further stepping actions, in a way analogous to debugging procedural languages (e.g., in gdb or pdb).
A class of frequently encountered issue in developing TensorFlow ML models is the appearance of bad numerical values (infinities and NaNs) due to overflow, division by zero, log of zero, etc. In large TensorFlow graphs, finding the source of such nodes can be tedious and time-consuming. With the help of tfdbg CLI and its conditional breakpoint support, you can quickly identify the culprit node. The video below demonstrates how to debug infinity/NaN issues in a neural network with tfdbg:
A screencast of the TensorFlow Debugger in action, from this tutorial.
Compared with alternative debugging options such as Print Ops, tfdbg requires fewer lines of code change, provides more comprehensive coverage of the graphs, and offers a more interactive debugging experience. It will speed up your model development and debugging workflows. It offers additional features such as offline debugging of dumped tensors from server environments and integration with tf.contrib.learn. To get started, please visit this documentation. This research paperlays out the design of tfdbg in greater detail.
The minimum required TensorFlow version for tfdbgis 0.12.1. To report bugs, please open issues on TensorFlow's GitHub Issues Page. For general usage help, please post questions on StackOverflow using the tag tensorflow.
Acknowledgements
This project would not be possible without the help and feedback from members of the Google TensorFlow Core/API Team and the Applied Machine Intelligence Team.
It's faster: TensorFlow 1.0 is incredibly fast! XLA lays the groundwork for even more performance improvements in the future, and tensorflow.org now includes tips & tricksfor tuning your models to achieve maximum speed. We'll soon publish updated implementations of several popular models to show how to take full advantage of TensorFlow 1.0 - including a 7.3x speedup on 8 GPUs for Inception v3 and 58x speedup for distributed Inception v3 training on 64 GPUs!
It's more flexible: TensorFlow 1.0 introduces a high-level API for TensorFlow, with tf.layers, tf.metrics, and tf.losses modules. We've also announced the inclusion of a new tf.keras module that provides full compatibility with Keras, another popular high-level neural networks library.
It's more production-ready than ever: TensorFlow 1.0 promises Python API stability (details here), making it easier to pick up new features without worrying about breaking your existing code.
Python APIs have been changed to resemble NumPy more closely. For this and other backwards-incompatible changes made to support API stability going forward, please use our handy migration guide and conversion script.
Higher-level API modules tf.layers, tf.metrics, and tf.losses - brought over from tf.contrib.learnafter incorporating skflowand TF Slim
Experimental release of XLA, a domain-specific compiler for TensorFlow graphs, that targets CPUs and GPUs. XLA is rapidly evolving - expect to see more progress in upcoming releases.
Introduction of the TensorFlow Debugger (tfdbg), a command-line interface and API for debugging live TensorFlow programs.
New Android demos for object detection and localization, and camera-based image stylization.
Installation improvements: Python 3 docker images have been added, and TensorFlow's pip packages are now PyPI compliant. This means TensorFlow can now be installed with a simple invocation of pip install tensorflow.
We're thrilled to see the pace of development in the TensorFlow community around the world. To hear more about TensorFlow 1.0 and how it's being used, you can watch the TensorFlow Developer Summit talks on YouTube, covering recent updates from higher-level APIs to TensorFlow on mobile to our new XLA compiler, as well as the exciting ways that TensorFlow is being used:
Click herefor a link to the livestream and video playlist (individual talks will be posted online later in the day).
There are already thousands of developers including Independent Software Vendors (ISVs) creating solutions to help schools and enterprises running the G Suite collaboration and productivity suite (formerly Google Apps). If you're thinking about becoming one, consider building applications that extend, enhance, and integrate G Suite apps and data with other mission critical systems to help businesses and educational institutions succeed.
Looking for inspiration? Here's a preview of some of the sessions that current and potential G Suite developers should consider:
If that's not enough Apps Script for you, or you're new to that technology, swing by to hear its Product Manager give you an introduction in his talk, quick intro video to give you an idea of what you can do with it!
Did you know that Apps Script also powers "add-ons" which extend the functionality of Google Docs, Sheets, and Forms? Then come to "the G Suite Marketplace where administrators or employees can install your add-ons for their organizations.
In addition to Apps Script apps, all your Google Docs, Sheets, and Slides documents live in Google Drive. But did you know that Drive is not just for individual file storage? Hear directly from a Drive Product Manager on how you can, "the Drive API and Team Drives, you can extend what Drive can do for your organization. One example from the most recent Google I/O tells the story of how WhatsApp used the Drive API to back up all your conversations! To get started with your own Drive API integration, check out this blog post and short video. Confused by when you should use Google Drive or Google Cloud Storage? I've got an app, err video, for that too! :-)
Not a software engineer but still code as part of your profession? Want to build a custom app for your department or line of business without having to worry about IT overhead? You may have heard about Google App Maker, our low-code development tool that does exactly that. Curious to learn more about it? Hear directly from its Product Manager lead in his talk entitled, "
All of these talks are just waiting for you at Next, the best place to get your feet wet developing for G Suite, and of course, the Google Cloud Platform. Start by checking out the session schedule. Next will also offer many opportunities to meet and interact with industry peers along with representatives from all over Google who love the cloud. Register today and see you in San Francisco!
Today, we're launching the Google Developers India channel: a brand new Youtube channel tailored for Indian Developers. The channel will include original content like interviews with local experts, developer spotlights, technical tutorials, and complete Android courses to help you be a successful developer.
Why India?
By 2018, India will have the largest developer base in the world with over 4 million developers. Our initiative to train 2 million Indian developers, along with the tremendous popularity of mobile development in the country and the desire to build better mobile apps, will be best catered by an India-specific developers channel featuring Indian developers, influencers, and experts.
Here is a taste of what's to come in 2017:
Tech Interviews: Advice from India's top developers, influencers and tech experts.
Developer Stories: Inspirational stories of Indian developers.
DevShow India: A weekly show that will keep new and seasoned developers updated on all the news, trainings, and API's from Google.
Skilled to Scaled: A real life developer journey that takes us from the germination of an idea for an app, all the way to monetizing it on Google Play.
So what's next?
The channel is live now. Click hereto check it out.
Posted by Alex Fischer, Software Engineer, Google Search.
TL;DR: Today, we're adding a feature to the AMP integration in Google Search that allows users to access, copy, and share the canonical URL of an AMP document. But before diving deeper into the news, let's take a step back to elaborate more on URLs in the AMP world and how they relate to the speed benefits of AMP.
What's in a URL? On the web, a lot - URLs and origins represent, to some extent, trust and ownership of content. When you're reading a New York Times article, a quick glimpse at the URL gives you a level of trust that what you're reading represents the voice of the New York Times. Attribution, brand, and ownership are clear.
Recent product launches in different mobile apps and the recent launch of AMP in Google Search have blurred this line a little. In this post, I'll first try to explain the reasoning behind some of the technical decisions we made and make sense of the different kinds of AMP URLs that exist. I'll then outline changes we are making to address the concerns around URLs.
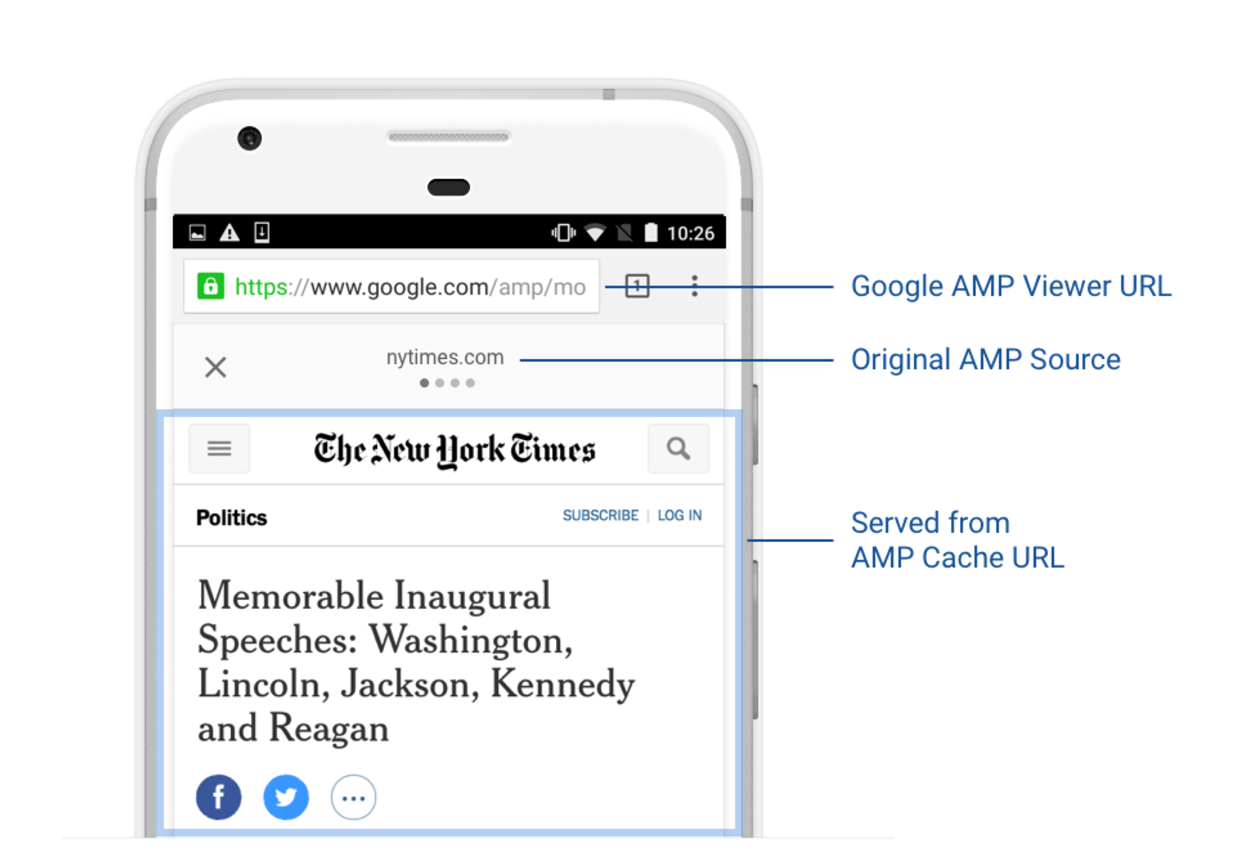
To start with, AMP documents have three different kinds of URLs:
Original URL: The publisher's document written in the AMP format. http://www.example.com/amp/doc.html
AMP Cache URL: The document served through an AMP Cache (e.g., all AMPs served by Google are served through the Google AMP Cache). Most users will never see this URL. https://www-example-com.cdn.ampproject.org/c/www.example.com/amp/doc.html
Google AMP Viewer URL: The document displayed in an AMP viewer (e.g., when rendered on the search result page). https://www.google.com/amp/www.example.com/amp.doc.html
Although having three different URLs with different origins for essentially the same content can be confusing, there are two main reasons why these different URLs exist: caching and pre-rendering. Both are large contributors to AMP's speed, but require new URLs and I will elaborate on why that is.
AMP Cache URLs
Let's start with AMP Cache URLs. Paul Bakaus, a Google Developer Advocate for AMP, has an excellent post describing why AMP Caches exist. Paul's post goes into great detail describing the benefits of AMP Caches, but it doesn't quite answer the question why they require new URLs. The answer to this question comes down to one of the design principles of AMP: build for easy adoption. AMP tries to solve some of the problems of the mobile web at scale, so its components must be easy to use for everyone.
There are a variety of options to get validation, proximity to users, and other benefits provided by AMP Caches. For a small site, however, that doesn't manage its own DNS entries, doesn't have engineering resources to push content through complicated APIs, or can't pay for content delivery networks, a lot of these technologies are inaccessible.
For this reason, the Google AMP Cache works by means of a simple URL "transformation." A webmaster only has to make their content available at some URL and the Google AMP Cache can then cache and serve the content through Google's world-wide infrastructure through a new URL that mirrors and transforms the original. It's as simple as that. Leveraging an AMP Cache using the original URL, on the other hand, would require the webmaster to modify their DNS records or reconfigure their name servers. While some sites do just that, the URL-based approach is easier to use for the vast majority of sites.
AMP Viewer URLs
In the previous section, we learned about Google AMP Cache URLs -- URLs that point to the cached version of an AMP document. But what about www.google.com/amp URLs? Why are they needed? These are "AMP Viewer" URLs and they exist because of pre-rendering. AMP's built-in support for privacy and resource-conscientious pre-rendering is rarely talked about and often misunderstood. AMP documents can be pre-rendered without setting off a cascade of resource fetches, without hogging up users' CPU and memory, and without running any privacy-sensitive analytics code. This works regardless of whether the embedding application is a mobile web page or a native application. The need for new URLs, however, comes mostly from mobile web implementations, so I am using Google's mobile search result page (SERP) as an illustrative example.
How does pre-rendering work?
When a user performs a Google search that returns AMP-enabled results, some of these results are pre-rendered behind the scenes. When the user clicks on a pre-rendered result, the AMP page loads instantly.
Pre-rendering works by loading a hidden iframe on the embedding page (the search result page) with the content of the AMP page and an additional parameter that indicates that the AMP document is only being pre-rendered. The JavaScript component that handles the lifecycle of these iframes is called "AMP Viewer".
The AMP Viewer pre-renders an AMP document in a hidden iFrame.
The user's browser loads the document and the AMP runtime and starts rendering the AMP page. Since all other resources, such as images and embeds, are managed by the AMP runtime, nothing else is loaded at this point. The AMP runtime may decide to fetch some resources, but it will do so in a resource and privacy sensible way.
When a user clicks on the result, all the AMP Viewer has to do is show the iframe that the browser has already rendered and let the AMP runtime know that the AMP document is now visible. As you can see, this operation is incredibly cheap - there is no network activity or hard navigation to a new page involved. This leads to a near-instant loading experience of the result.
Where do google.com/amp URLs come from?
All of the above happens while the user is still on the original page (in our example, that's the search results page). In other words, the user hasn't gone to a different page; they have just viewed an iframe on the same page and so the browser doesn't change the URL.
We still want the URL in the browser to reflect the page that is displayed on the screen and make it easy for users to link to. When users hit refresh in their browser, they expect the same document to show up and not the underlying search result page. So the AMP viewer has to manually update this URL. This happens using the History API. This API allows the AMP Viewer to update the browser's URL bar without doing a hard navigation.
The question is what URL the browser should be updated to. Ideally, this would be the URL of the result itself (e.g., www.example.com/amp/doc.html); or the AMP Cache URL (e.g., www-example-com.cdn.ampproject.org/www.example.com/amp/doc.html). Unfortunately, it can't be either of those. One of the main restrictions of the History API is that the new URL must be on the same origin as the original URL (reference). This is enforced by browsers (for security reasons), but it means that in Google Search, this URL has to be on the www.google.com origin.
Why do we show a header bar?
The previous section explained restrictions on URLs that an AMP Viewer has to handle. These URLs, however, can be confusing and misleading. They can open up the doors to phishing attacks. If an AMP page showed a login page that looks like Google's and the URL bar says www.google.com, how would a user know that this page isn't actually Google's? That's where the need for additional attribution comes in.
To provide appropriate attribution of content, every AMP Viewer must make it clear to users where the content that they're looking at is coming from. And one way of accomplishing this is by adding a header bar that displays the "true" origin of a page.
What's next?
I hope the previous sections made it clear why these different URLs exist and why there needs to be a header in every AMP viewer. We have heard how you feel about this approach and the importance of URLs. So what next? As you know, we want to be thoughtful in what we do and ensure that we don't break the speed and performance users expect from AMP pages.
Since the launch of AMP in Google Search in Feb 2015, we have taken the following steps:
All Google URLs (i.e., the Google AMP cache URL and the Google AMP viewer URL) reflect the original source of the content as best as possible: www.google.com/amp/www.example.com/amp/doc.html.
When users scroll down the page to read a document, the AMP viewer header bar hides, freeing up precious screen real-estate.
When users visit a Google AMP viewer URL on a platform where the viewer is not available, we redirect them to the canonical page for the document.
In addition to the above, many users have requested a way to access, copy, and share the canonical URL of a document. Today, we're adding support for this functionality in form of an anchor button in the AMP Viewer header on Google Search. This feature allows users to use their browser's native share functionality by long-tapping on the link that is displayed.
In the coming weeks, the Android Google app will share the original URL of a document when users tap on the app's share button. This functionality is already available on the iOS Google app.
Lastly, we're working on leveraging upcoming web platform APIs that allow us to improve this functionality even further. One such API is the Web Share API that would allow AMP viewers to invoke the platform's native sharing flow with the original URL rather than the AMP viewer URL.
We as Google have every intention in making the AMP experience as good as we can for both, users and publishers. A thriving ecosystem is very important to us and attribution, user trust, and ownership are important pieces of this ecosystem. I hope this blog post helps clear up the origin of the three URLs of AMP documents, their role in making AMP fast, and our efforts to further improve the AMP experience in Google Search. Lastly, an ecosystem can only flourish with your participation: give us feedback and get involved with AMP.
The Associate Android Developer Certification program was announced at Google I/O 2016, and launched a few months later. Since then, over 322 Android developers spanning 61 countries have proven their competency and earned the title of Google Certified Associate Android Developer. To establish a professional standard for what it means to be an Associate Android developer in the current job market, Google created this certification, which allows us to recognize developers who have proven themselves to uphold that standard.
We conducted a job task analysis to determine the required competencies and content of the certification exam. Through field research and interviews with experts, we identified the knowledge, work practices, and essential skills expected of an Associate Android developer.
The certification process consists of a performance-based exam and an exit interview. The certification fee includes three exam attempts. The cost for certification is $149 USD, or 6500 INR if you reside in India. After payment, the exam will be available for download, and you have 48 hours to complete and submit it for grading.
In the exam, you will implement missing features and debug an Android app using Android Studio. If you pass, you will undergo an exit interview where, you will answer questions about your exam and demonstrate your knowledge of Associate Android Developer competencies.
Check out this short video for a quick overview of the Associate Android Developer certification process:
Earning your AAD Certification signifies that you possess the skills expected of an Associate Android developer, as determined by Google. You can showcase your credential on your resume and display your digital badge on your social media profiles. As a member of the AAD Alumni Community, you will also have access to program benefits focused on increasing your visibility as a certified developer.
Test your Android development skills and earn the title of Google Certified Associate Android Developer. Visit g.co/devcertification to get started!
Posted by Amy Schapiro and the Women Techmakers team
For the tech industry to thrive and create groundbreaking technology that supports the global ecosystem, it is criticalto increase the diversity and inclusion of communities that make the technology. To support this global network of tech hubs - incubators, community organizations, accelerators and coworking spaces - Women Techmakers partnered with Change Catalyst to develop an in-depth video series and set of guides on how to build inclusive technology hubs.
Watch the videos on the Women Techmakers YouTube channel, and access the how-to guides on the Change Catalyst site [via this link].
For more information about Women Techmakers, Google's global program supporting women in technology, and to join the Membership program, visit womentechmakers.com.
Originally posted on the Firebase Blog Posted by Francis Ma, Firebase Product Manager
Almost eight months ago, we launchedthe expansion of Firebase to help developers build high-quality apps, grow their user base, and earn more money across iOS, Android and the Web. We've already seen great adoption of the platform, which brings together the best of Google's core businesses from Cloud to mobile advertising.
Our ultimate goal with Firebase is to free developers from so much of the complexity associated with modern software development, giving them back more time and energy to focus on innovation.
As we work towards that goal, we've continued to improve Firebase, working closely with our user community. We recently introducedmajor enhancements to many core features, including Firebase Analytics, Test Lab and Cloud Messaging, as well as added support for game developers with a C++ SDK and Unity plug-in.
We're deeply committed to Firebase and are doubling down on our investment to solve developer challenges.
Fabric and Firebase Joining Forces
Today, we're excited to announce that we've signed an agreement to acquire Fabric to continue the great work that Twitter put into the platform. Fabric will join Google's Developer Product Group, working with the Firebase team. Our missions align closely: help developers build better apps and grow their business.
As a popular, trusted tool over many years, we expect that Crashlytics will become the main crash reporting offering for Firebase and will augment the work that we have already done in this area. While Fabric was built on the foundation of Crashlytics, the Fabric team leveraged its success to launch a broad set of important tools, including Answers and Fastlane. We'll share further details in the coming weeks after we close the deal, as we work closely together with the Fabric team to determine the most efficient ways to further combine our strengths. During the transition period, Digits, the SMS authentication services, will be maintained by Twitter.
The integration of Fabric is part of our larger, long-term effort of delivering a comprehensive suite of features for iOS, Android and mobile Web app development.
This is a great moment for the industry and a unique opportunity to bring the best of Firebase with the best of Fabric. We're committed to making mobile app development seamless, so that developers can focus more of their time on building creative experiences.
In Android Security, we're constantly working to better understand how to make Android devices operate more smoothly and securely. One security solution included on all devices with Google Play is Verify apps. Verify apps checks if there are Potentially Harmful Apps (PHAs) on your device. If a PHA is found, Verify apps warns the user and enables them to uninstall the app.
But, sometimes devices stop checking up with Verify apps. This may happen for a non-security related reason, like buying a new phone, or, it could mean something more concerning is going on. When a device stops checking up with Verify apps, it is considered Dead or Insecure (DOI). An app with a high enough percentage of DOI devices downloading it, is considered a DOI app. We use the DOI metric, along with the other security systems to help determine if an app is a PHA to protect Android users. Additionally, when we discover vulnerabilities, we patch Android devices with our security update system. This blog post explores the Android Security team's research to identify the security-related reasons that devices stop working and prevent it from happening in the future.
Flagging DOI Apps
To understand this problem more deeply, the Android Security team correlates app install attempts and DOI devices to find apps that harm the device in order to protect our users.
With these factors in mind, we then focus on 'retention'. A device is considered retained if it continues to perform periodic Verify apps security check ups after an app download. If it doesn't, it's considered potentially dead or insecure (DOI). An app's retention rate is the percentage of all retained devices that downloaded the app in one day. Because retention is a strong indicator of device health, we work to maximize the ecosystem's retention rate. Therefore, we use an app DOI scorer, which assumes that all apps should have a similar device retention rate. If an app's retention rate is a couple of standard deviations lower than average, the DOI scorer flags it. A common way to calculate the number of standard deviations from the average is called a Z-score. The equation for the Z-score is below.
N = Number of devices that downloaded the app.
x = Number of retained devices that downloaded the app.
p = Probability of a device downloading any app will be retained.
In this context, we call the Z-score of an app's retention rate a DOI score. The DOI score indicates an app has a statistically significant lower retention rate if the Z-score is much less than -3.7. This means that if the null hypothesis is true, there is much less than a 0.01% chance the magnitude of the Z-score being as high. In this case, the null hypothesis means the app accidentally correlated with lower retention rate independent of what the app does.
This allows for percolation of extreme apps (with low retention rate and high number of downloads) to the top of the DOI list. From there, we combine the DOI score with other information to determine whether to classify the app as a PHA. We then use Verify apps to remove existing installs of the app and prevent future installs of the app.
Difference between a regular and DOI app download on the same device.
Results in the wild
Among others, the DOI score flagged many apps in three well known malware families— Hummingbad, Ghost Push, and Gooligan. Although they behave differently, the DOI scorer flagged over 25,000 apps in these three families of malware because they can degrade the Android experience to such an extent that a non-negligible amount of users factory reset or abandon their devices. This approach provides us with another perspective to discover PHAs and block them before they gain popularity. Without the DOI scorer, many of these apps would have escaped the extra scrutiny of a manual review.
The DOI scorer and all of Android's anti-malware work is one of multiple layers protecting users and developers on Android. For an overview of Android's security and transparency efforts, check out our page.
Posted by Matteo Vallone, Google Play Games Business Development
Back in November, we launched the Google Play Indie Games Contest for developers from 15 European countries, to celebrate the passion and innovation of the indie community in the region. The contest will reward the winners with exposure to industry experts and players worldwide, as well as other prizes that will showcase their art and help them grow their business on Android and Google Play.
Thank you to the nearly 1000 of you who submitted high quality games in all types of genres! Your creativity, enthusiasm and dedication have once again impressed us and inspired us. We had a very fun time testing and judging the games based on fun, innovation, design excellence and technical and production quality, and it was challenging to select only 20 finalists:
At the final event attendees will have a say on which 10 of these finalists will get to pitch their games to the jury, who will decide on the final contest winners who will receive the top prizes.
Register now to join us in London, meet the developers, check out their great games, vote for your favourites, and have fun with various industry experts and indie developers.
A big thank you again to everyone who entered and congratulations to the finalists. We look forward to seeing you at the Saatchi Gallery in London on 16th February.