Tag Archives: Partners

Mumzworld reaches 300% ROAS with Google Analytics

From rattles to diapers to playhouses, Mumzworld sells everything for babies and children to hundreds of thousands of online shoppers in the Middle East each year. The company advertises on many platforms and works hard to engage consumers with the best possible product catalog. 

For Mumzworld, the challenge was to spend those ad dollars wisely, with full insight into ROI and product availability. The company wanted to increase online sales and repeat buyers while keeping user acquisition cost low. They also wanted a platform to help them manage on-site inventory better and lower out-of-stock product views.

For help, Mumzworld turned to InfoTrust, a Google Analytics Certified Partner that specializes in ecommerce data integration. Together, Mumzworld and InfoTrust implemented Google Analytics Enhanced Ecommerce for deeper shopper insights, product inventory tracking and leveraged InfoTrust’s data integration tool, Analyze.ly, to import cost-related metrics from non-Google platforms into GA. 

Through remarketing and automated reports for out-of-stock products day-over-day, Mumzworld was able to see growth in total conversions, conversion rate and maintain a ROAS at 300% across top channels. Read the full case study.
Click image for full-sized version

“InfoTrust cleaned up our Google Analytics account and helped us better capture key data in dashboards, so we could dissect the information that helps us make our business better. It showed us key KPIs to watch for and created automated reports so we could measure and react to these KPIs.” —Mona Ataya, CEO and Founder, Mumzworld FZ-LLC

To learn how Mumzworld and InfoTrust worked together to achieve these results, download the full case study

Posted by Daniel Waisberg, Analytics Advocate

What it looks like to process 3.5 million books in Google’s cloud

Today’s guest blog comes from Kalev Leetaru, founder of The GDELT Project, which monitors the
world’s news media in nearly every country in over 100 languages to identify the events and narratives driving our global society.

This past September I published into Google BigQuery a massive new public dataset of metadata from 3.5 million digitized English-language books dating back more than two centuries (1800-2015), along with the full text of 1 million of these books. The archive, which draws from the English-language public domain book collections of the Internet Archive and HathiTrust, includes full publication details for every book, along with a wide array of computed content-based data. The entire archive is available as two public BigQuery datasets, and there’s a growing collection of sample queries to help users get started with the collection. You can even map two centuries of books with a single line of SQL.

What did it look like to process 3.5 million books? Data-mining and creating a public archive of 3.5 million books is an example of an application perfectly suited to the cloud, in which a large amount of specialized processing power is needed for only a brief period of time. Here are the five main steps that I took to make the invaluable learnings of millions of books more easily and speedily accessible in the cloud:
  1. The project began with a single 8-core Google Compute Engine (GCE) instance with a 2TB SSD persistent disk that was used to download the 3.5 million books. I downloaded the books to the instance’s local disk, unzipped them, converted them into a standardized file format, and then uploaded them to Google Cloud Storage (GCS) in large batches, using the composite objects and parallel upload capability of GCS. Unlike traditional UNIX file systems, GCS performance does not degrade with large numbers of small files in a single directory, so I could upload all 3.5 million files into a common set of directories.
    Figure 1: Visualization of two centuries of books
  2. Once all books had been downloaded and stored into GCS, I launched ten 16-core High Mem (100GB RAM) GCE instances (160 cores total) to process the books, each with a 50GB persistent SSD root disk to achieve faster IO over traditional persistent disks. To launch all ten instances quickly, I launched the first instance and configured that with all of the necessary software libraries and tools, then created and used a disk snapshot to rapidly clone the other nine with just a few clicks. Each of the ten compute instances would download a batch of 100 books at a time to process from GCS.
  3. Once the books had been processed, I uploaded back into GCS all of the computed metadata. In this way, GCS served as a central storage fabric connecting the compute nodes. Remarkably, even in worst-case scenarios when all 160 processors were either downloading new batches of books from GCS or uploading output files back to GCS in parallel, there was no measurable performance degradation.
  4. With the books processed, I deleted the ten compute instances and launched a single 32-core instance with 200GB of RAM, a 10TB persistent SSD disk, and four 375GB direct-attached Local SSD Disks. I used this to reassemble the 3.5 million per-book output files into single output files, tab-delimited with data available for each year, merging in publication metadata and other information about each book. Disk IO of more than 750MB/s was observed on this machine.
  5. I then uploaded the final per-year output files to a public GCS directory with web downloading enabled, allowing the public to download the files.
Since very few researchers have the bandwidth, local storage or computing power to process even just the metadata of 3.5 million books, the entire collection was uploaded into Google BigQuery as a public dataset. Using standard SQL queries, you can explore the entire collection in tens of seconds at speeds of up to 45.5GB/s and perform complex analyses entirely in-database.

The entire project, from start to finish, took less than two weeks, a good portion of which consisted of human verification for issues with the publication metadata. This is significant because previous attempts to process even a subset of the collection on a modern HPC supercluster had taken over one month and completed only a fraction of the number of books examined here. The limiting factor was always the movement of data: transferring terabytes of books and their computed metadata across hundreds of processors.

This is where Google’s cloud offerings shine, seemingly purpose-built for data-first computing. In just two weeks, I was able to process 3.5 million books, spinning up a cluster of 160 cores and 1TB of RAM, followed by a single machine with 32 cores, 200GB of RAM, 10TB of SSD disk and 1TB of direct-attached scratch SSD disk. I was able to make the final results publicly accessible through BigQuery at query speeds of over 45.5GB/s.

You can access the entire collection today in BigQuery, explore sample queries, and read more technical detail about the processing pipeline on the GDELT Blog.

I’d like to thank Google, Clemson University, the Internet Archive, HathiTrust, and OCLC in making this project possible, along with all of the contributing libraries and digitization sponsors that have made these digitized books available.

- Posted by Kalev Leetaru, founder of The GDELT Project

Google Analytics User Conference: G’day Australia

The Australian Google Analytics User Conference is worth clearing your diaries for, with some of the most well-known and respected international industry influencers making their way to Sydney and Melbourne to present at the conference this September.


Hosted by Google Certified Partners, Loves Data, you’ll be learning about the latest features, what’s trending and popular, best practices and uncovering ways to get the most out of Google Analytics. Topics covered include: making sure digital analytics is indispensable to your organisation; applying analytics frameworks to your whole organisation; improving your data quality and collection; data insights you can action; and presenting data to get results.

Presenting the keynote is Jim Sterne, Chairman of the Digital Analytics Association, founder of eMetrics and also known as the godfather of analytics. Joining him are two speakers from Google in the US: Krista Seiden, Google Product Manager and Analytics Advocate and Mike Kwong, Senior Staff Software Engineer.

Other leading international industry influencers presenting at the conference include Simo Ahava (Google Developer Expert; Reaktor), Chris Chapo (Enjoy), Benjamin Mangold (Loves Data), Lea Pica (Consultant, Leapica.com), Chris Samila (Optimizely), Carey Wilkins (Evolytics) and Tim Wilson (Web Analytics Demystified).  

Expect to network with other like-minded data enthusiasts, marketers, developers and strategists, plus get to know the speakers better during the Conference’s Ask Me Anything session. We’ve even covered our bases for those seeking next-level expertise with a marketing or technical masterclass available the day before the conference. Find out more information about the speakers and check out the full program.

Last year’s conference sold out way in advance and this year’s conference is heading in the same direction. Book your tickets now to avoid disappointment. 

Event details Sydney
Masterclass & Conference | 8 & 9 September 2015

Event details Melbourne
Masterclass & Conference | 10 & 11 September 2015

Tackling Quantitative PR Measurement with AirPR & Google Analytics

The following is a guest post by Leta Soza. Leta is the PR Engineer at AirPR where she lives and breathes PR strategy, content marketing, community cultivation, and analytics. Her analytics adoration stems from the firmly rooted belief that you can’t manage what you can’t measure, so bring on the data. She works with everyone from Fortune 500 companies to innovative startups in order to assist them in proving the ROI of their PR efforts while optimizing their strategies. 

It’s no secret that PR has historically been difficult to measure… quantitatively that is.

PR pros have always had to rely on less than stellar metrics (AVEs, impressions calculations, etc.) to show ROI, and with seemingly no viable reporting alternatives, PR has basically been relegated to the budgetary back seat.

For years, the industry has struggled to prove its value, lagging behind in technological innovation. But as every aspect of business becomes driven by data, vanity metrics are becoming unacceptable and PR is being held accountable for demonstrating its impact on the bottom line.

At AirPR, we’ve made it our mission to provide analytics, insights, and measurement solutions for the rapidly evolving PR industry. Our Analyst product focuses on increasing overall PR performance while seeking to solve systemic industry challenges through the application of big data.

Analyst, our measurement and insights solution, was created to assist PR and communication professionals in understanding what’s moving the needle in terms of their business objectives. 

Interested in how many potential customers came to your website from that press hit? Curious which authors drove the most social amplification during a specific quarter? Want to more deeply understand message pull-through or even attribute revenue? Analyst simplifies getting these answers.

One of the key features of Analyst is our unique integration with Google Analytics. Our integration arms Analyst users with a comprehensive snapshot of the PR activities driving business objectives, as well as the insights to understand the media placements (earned or owned) that are achieving specific company aims, giving PR professionals a single dashboard dedicated to displaying the performance of their efforts. Completing the GA integration creates a comprehensive view of the most meaningful and actionable PR data in aggregate which then allows users to click into any piece of data for more context. 
AirPR Analyst Dashboard (click for full-sized image)

In PR attribution is key, so we leverage Google Analytics data in order to display PR-specific performance and demonstrate ROI. Our aim: To change the way the industry thinks about PR analytics, insights, and measurement and to provide the solutions that support this shift. 

To quote legendary management consultant Peter Drucker, “In this new era of ‘big data’ it is even more important to convert raw data to true information.” Our goal is to deliver actionable and meaningful information. When decision makers understand what’s working, they can increase effort on certain aspects, eliminate others, and make impactful budget allocation decisions for future PR campaigns, much like they do for advertising.

To learn more about AirPR Analyst, check us out in the Google Analytics app gallery.

Posted by Leta Soza, PR Engineer at AirPR 

Google Analytics Conference Nordic in Stockholm, Sweden


The event takes place August 28-29 in Stockholm, Sweden. You can expect to hear expert tips on how to get maximum value out of Google Analytics, and learn from other organizations using the tool. 

Started based on an initiative by Outfoxwho gathered the other Google Analytics Certified Partners, the conference is now returning for the fourth consecutive year.

Our Stockholm conference includes:

 • Clinics led by Google Analytics Certified Partners
 • Case studies from businesses and other organizations
 • Opportunities to interact with peers and experts
 • ...much more!

The conference is being visited by two top speakers from Google, Daniel Waisberg and Kerri Jacobs.

Daniel Waisberg is the Analytics Advocate at Google, where he is responsible for fostering Google Analytics by educating and inspiring Online Marketing professionals. Both at Google and his previous positions, Daniel has worked with some of the biggest Internet brands to measure and optimize online behavior. 

Before kickstarting the Google Analytics Premium sales team, Kerri Jacobs was a Sales Manager for the DoubleClick publisher, agency and marketer product portfolio. Kerri has been a leader in the online sales world since the early days.

Besides meeting Google, you’ll meet Google Analytics Certified Partners Outfox, iProspect, Knowit, MediaAnalys, Netbooster, Klikki and Web Guide Partner. You will also meet and learn from several end users who use Google Analytics on a daily basis.

To join us in Stockholm August 28-29, visit the conference site and secure your ticket before it's sold out again.

Posted by Lars Johansson, Google Analytics Certified Partner

8 Custom Reports from the Google Analytics Solutions Gallery

The following is a guest post from Rachelle Maisner, who recently transitioned from Sr Analyst to Account Manager at Digitaria, a Google Analytics Certified Partner.
New analysts have it easy these days. Back in my day, we have to walk uphill in the snow both ways to get decent enough web reporting. My first blush with web analytics came upon me when I was a marketing coordinator for an advertising agency several years ago. I got the hand-me-down grunt work of pulling stats for one of our client's websites using server logs. Server logs, people. It was painfully slow, and gut-wrenchingly inefficient. So for the sake of my sanity, I started looking into better solutions, and I knew if it could help the client out with more meaningful reporting, that would make me look really good. When I found a solution I liked, I needed to pitch the client for their buy in. That conversation went something like... "I found this great tool, and it's free- we can install it on your website and try out this fast new reporting. It's called Google Analytics."
Since then, there are now so many fantastic resources available to budding young analysts. From the Analysis Exchange to Avinash's own Market Motive courses, not to mention GA's recently revamped Analytics Academy, there's a wealth of quality education and training just a click away to anyone who’s willing to learn. 
I'm blogging to tell you all about one of my absolute favorite new resources-- a tremendous goldmine of knowledge sharing unlike anything else this industry has ever seen-- Google Analytics’ very own Solutions Gallery.
The Solutions Gallery is a free and public platform that allows users to share custom reports, segments and dashboards. It's invaluable resource not only for those that are new to digital analytics, but also for analytics veterans looking for fresh ideas and new approaches. I mean, wow, you can download reports and dashboards from experts all over the globe and instantly apply them to your own Google Analytics account. 

I was so excited about the Solutions Gallery that I uploaded 8 custom reports of my own to share with the community, and in about a month I had over 1,600+ imports. 
I have received awesome feedback and gratitude for the custom reports I created, so I am absolutely thrilled to be able to share them here on the Google Analytics blog and showcase them to a wider audience. I hope you find these helpful and I hope they encourage you to not only get more from your data, but to upload some of your own solutions to the Gallery.
All my custom reports are organized into four categories. These categories are based on the ABC's of analytics, plus D for bonus points: Acquisition, Behavior, Conversion, and Diagnostics.
A is for Acquisition
Visits and Goal Conversion by Traffic Source: Take your traffic source reports one step further by understanding volume & conversion by each channel. This is one way to see how your best visitors are getting to your site. I recommend setting up a goal for “engaged visits”, for this custom report and some of the following reports. When you import this custom report, change Goal One to your engaged visits goal, or another significant KPI configured as a goal.
B is for Behavior
Page Effectiveness: Ever ponder the question, “How is my content doing?” This custom report provides page-level performance, allowing you to discover your top and bottom performing pages using various traffic and engagement metrics.
Social Sharing: A four-tab custom report chock full of site-to-social reporting. Tab 1 is the Shared Content Trend, showing how top pages are shared to social networks over time. Tab 2 is Top Shared Content by Network, a first step to discovering what content works for specific channels. Tab 3 is a report on Socially Engaged Visitors, providing a quick profile of visitors that engage in social sharing links. And finally, Tab 4 is Social Outcomes and Conversions, tying social engagement to site goals.
C is for Conversion
Simple E-Commerce Report: A starting point for trending revenue or purchases against visits, with a traffic sources breakdown.
PPC Campaign Goal Performance: Analyze paid search performance against goal conversion by search engine. Change goal one completions to your engaged visits goal. This report filters for Google campaigns. To filter for Bing change the source filter for "Bing" or delete the filter to include all search engines.
PPC Keywords: Get a paid keyword report with traffic volume, CPC, goal conversions, and cost per conversion.
D is for Diagnostics
Page Timing: Use this custom report to QA page load timing and reveal problem pages. Switch from the "data" table view to the "comparison" table view, and compare load time to bounce rate, allowing you to view the bounce rate for each page against the site average.
Internal and External 404 Report: A custom report to help resolve 404 errors. Includes two report tabs. Tab 1: bad inbound links, and Tab 2: bad internal links. Be sure to change the filter for "page title" to the page title used on your site's 404 page.
Posted by Rachelle Maisner, Account Manager at Digitaria, a Google Analytics Certified Partner

Ensuring Data Accuracy with a Tag Management Policy

The following is a guest post from GACP Michael Loban, CMO at InfoTrust.

The quality of the website analytics data we have is directly related to the tag management processes adopted by an organization. Most likely, you can remember days when the following incidents may have occurred:
  1. You find that one (or several) of the pages on your site is missing Google Analytics, or some pages had Google Analytics deployed twice causing duplicate pageviews and inflating traffic.
  2. Google Analytics custom variables were inconsistent or missing on some portions of the site, leading to data quality issues.
  3. An unauthorized marketing tag was piggybacking off of another tag.
  4. One of the tags on an international site you managed did not follow the new EU Cookie Laws related to privacy.
Adopting a Tag Management System like Google Tag Manager is a great way to go, but having a great tool to organize and deploy your tags is often not enough. You still need a system, a process, and ongoing review. Here are the steps for creating a tag management policy for your company:

1. Know where you are – what tags are currently firing, where and how? Whether you have a small site with a few hundred pages or an international publication with thousands of pages, it is important to assess your current tag deployment. 

Can you say, with 100% confidence, that your analytics tag are located on every page?  Are you sure the cookies set by your analytics tag/tool are accurate and not over-writing each other?

Regardless of whether you are confident or not, I suggest using a tool like TagInspector.com (Tag Inspector is an InfoTrust product). It will help you locate:
  1. All the tags on your site, split up by specific pages’ tags, and even pages they are missing from.
  2. Cookies set by various tags and what pages they are set on.
  3. How the tag is deployed – through a tag management system or directly from a page source.
  4. Instances of tag piggybacking – one tag being loaded by another tag.
Here is a screenshot from an example scan. It shows how tags load (commonly referred to as tag hierarchy). We have removed the website URL, but as you can see there are instances when Google Analytics is being loaded by the TMS, and instances where Google Analytics is being loaded directly from the source of the page. 


2. Document all approved tags. The average enterprise website might have 25-50 marketing tags. Not all of them have to be present across all pages. However, even if you are considering moving to a Tag Management System, or already are using one, it is not a bad idea to have the following documented and categorized:
  1. Tag name and functionality
  2. Pages or the category pages the tag needs to be on
  3. Information collected through the tag about visitors (cookies set)
  4. Firing rules

Check out Tagopedia – a wiki of tags to learn more about the many different types of tags.

3. Consider the implementation of a Tag Management System. There is a reason this is step three, and not step one or two. A lot of companies jump to this step first, thinking that a new technology will miraculously make all tagging issues disappear. The first step in moving to a TMS is knowing what tags you need to keep, and where they are or how they are loaded on your site so you can remove them from the source after the tag management system is deployed.

When considering the implementation of a tag management system, think about your team. Every website of a TMS vendor says you will no longer need your IT team to make changes to the tags thus simplifying and expediting the process. I have met plenty of marketers who do not want anything to do with a TMS. Even though you will free up your IT resources, you will still need a person or team with the technical training to manage your tags. 

Naturally, your first step in evaluating Tag Management vendors should be outlining what features you really need. Google Tag Manager is free, and is one of the few TMS systems that works for both mobile websites and native mobile applications. 

NOTE:  If you do decide to migrate to a TMS or if you have already done so, you still should scan all the pages across your site to ensure that your tags fire correctly, such as, once per page for analytics tags – and only from your TMS. You certainly want to avoid having a tag in the source of your page and inside a TMS – this will inflate your data and cause data quality issues.

4. Run ongoing site audits to ensure correct tags are deployed across correct pages. Ideally, this will only serve as the insurance. However, ongoing site scans or audits can help you avoid the moments when you realize you did not capture AdWords conversions because your GA or AdWords conversion tag was removed from the conversion page. Keep in mind certain tags might only fire when a user looks at your website on a mobile device, and your scan might need to simulate different user agents.  Doing this manually for all the sites you manage, or across one very large site, can be quite challenging. Again, TagInspector.com can help speed up this process and dramatically reduce the effort required. Here is an example screenshot of the scanning options:


5. Think ahead – will you be able to innovate? Complete lock down is in nobody’s best interests. What happens if there is a new platform for A/B testing that you would like to try? How long will it take you to get the tag approved, implemented on your site, verify its performance, and launch a campaign? Keep innovation in mind and make it relatively easy for marketers in your company to adopt new technologies.

One way to go about this is having an application that needs to be completed and approved prior to implementing a new tag. This will help you ensure only tags that meet company standards are implemented on your site. 

At the end of the day, tag deployment and data collection will only get more complex. If you do not have any process for managing your tags, it is time to start. If you have some kind of process, perhaps it is time for optimization. Get all the stakeholders in the room, and decide who will be your tag management team, and what the first step will be to ensure tag accuracy. You can’t do analysis if the data isn’t accurate. And your data won’t be accurate if your marketing tags aren’t implemented correctly. 

If you would like to learn more about implementing a tag management policy, we would like to invite you to attend a free webinar on March 26th at 1:00PM EST where we will discus items outlined in this post, and a lot more. 

Posted by Michael Loban, CMO at Google Analytics Certified Partner InfoTrust

How the Analysis Exchange is helping Non-Profits make data-driven decisions

The following is a guest post from Eric Peterson, Senior Partner at Google Analytics Certified Partner Web Analytics Demystified.

Summary: Web Analytics Demystified continues to advance the Analysis Exchange to help anyone, anywhere get “hand’s on” experience conducting analysis with Google Analytics in an effort to support non-profits worldwide. 

While thousands of non-profit organizations use Google Analytics on their websites, many have not yet been able to take full advantage of the data generated on their site’s performance. The Analysis Exchange, an education initiative developed by Web Analytics Demystified that provides free web data analysis to non-profits, offers organizations an opportunity to gain insights from web analytics to better meet their goals.

The Exchange pairs a non-profit organization with two web analysts --- one a student wanting the hands-on training and the other a mentor with years of direct experience in the analytics field. Together, they work on projects with objectives aimed at improving the non-profit’s website performance and overall use of their analytics data.

Since its introduction, over 400 non-profit organizations have used the Analysis Exchange for more than 1,000 projects using data from Google Analytics. Among these organizations have been those involved in public media, foundations, environmental concerns, youth-focused organizations, museums, schools, and many others.

Learn more about the Analysis Exchange in this brief video:


Paull Young, Director of Digital at charity: water, has achieved success with multiple Analysis Exchange projects for his organization. He says, “I see analytics becoming central to how non-profits do business – though I don’t see that being the case right now. charity: water is one of the most digitally focused non-profits you’ll find, but we’re at the front of a trend towards online donations that is only going to increase.

Every non-profit aims to become more and more efficient, delivering maximum impact for the minimum amount of cost. Smart application of analytics will be a must to achieve this objective.”

Other organizations have gained value from Analysis Exchange projects by not only exposing ‘what happened’ on their site and what were the successes but more importantly identifying factors that led to successes on the site and how to make improvements. An example of some takeaways have been:
  • What content visitors consumed and where they came from
  • What social channels drove the most activity to the site as well as off the site
  • Factors that lead to significant increases in visits
  • Competitive benchmarks of success
  • What factors led to declines in traffic and how to correct
Analysis Exchange projects are completely free and take less than a few hours for non-profits and mentors. Google Analytics is the standard analytics tool used for all projects.  Its ease-of-use dramatically improves the non-profits ability to continue to use web analytics after projects are completed.

We’re looking for more non-profits as well as student-mentor partners to sign up to the The Analysis Exchange. You can learn more about our effort at www.analysis-exchange.com or write our Executive Director Wendy Greco directly at [email protected].

Richer Insights For B2B Marketing With Google Analytics

The following is a guest post from Google Analytics Certified Partner Feras Alhlou, Partner & Principal Consultant at E-Nor Inc.
Marketers and sales professionals want to know who’s visiting their site, what content the target audience is consuming and what converts site visitors to paying customers. 
In a B2B environment -- where long sales cycles and multiple stakeholders affect sales decision -- “knowing who’s coming to your site” takes on another dimension. 
Say you’re in charge of marketing an eLearning system, and your target market includes telecom, hi-tech/software companies and universities. Your sales cycle could span several months, and there are multiple personas/stakeholders who will evaluate your company and your product. 
Some key personas include:
  • Trainers, professors and teachers evaluating user experience and ease of uploading curricula and content 
  • Management/administrators evaluating your company, pricing, client testimonials, case studies, etc.
  • IT assessing technical aspects of products, maintainability, your technical support processes, etc. 
As a marketer, your job is to ensure your site addresses the needs of each stakeholder, while realizing that the interests/questions each group of stakeholders are likely to be different. It’s critical that the message and content (that you invested so much in creating) “sticks” with the unique personas in each market segment. 
Easier said than done; measuring and optimizing all the above isn’t for the faint of heart.
But don’t fret. Integrating Google Analytics with Account-Based Marketing and Firmographic data has come to the rescue. 
B2B Measurement Framework
Let’s walk through a typical scenario and highlight key performance indicators (KPIs). The measurement framework our eLearning marketing manager has in mind includes (and yes, they follow GA’s ABC!):
Acquisition
    1. What percent of my traffic comes from industries I target
      1. Telecom
      2. Hi-tech/software companies
      3. .edu’s
    2. Percentage increase or decrease in traffic from industries I’m not targeting 
    3. Traffic volume and frequency from organizations our sales team targets offline
Behavior
    1. Landing page stickiness by industry and organization
    2. What content is very popular
    3. What content is most shared
    4. All the above segmented by the three targeted industries
Conversion
    1. Number of whitepaper downloads by industry and company
    2. Number of demo requests
    3. Sales follow-up call requests 
    4. All the above segmented by the three targeted industries
If your site visitors aren’t providing you with company and industry data, it’s not possible to report on this data in Google Analytics. Hello Insightera, a marketing personalization platform, enables your to enrich customer’s onsite journey with firmographic data in a seamless integrated fashion (note, another product in the Google Analytics app gallery offering similar functionality is Demandbase).
Rich Firmographic Data in Google Analytics
Insightera’s firmographic data is organized by 1) deriving information from site visitors by identifying their ISP 2) determining that organization’s information, including location, industry (and soon company size and company revenue will also be available). 
With easy-to-navigate firmographic readily available, analytics data takes on a new dimension; advertising dollars can be better targeted, and you have the ability to customize a visitor’s experience in several new ways.
Here’s a few examples of the rich and super cool data you have access to with Insightera, nicely integrated in the Google Analytics Reports (in Custom Variables):
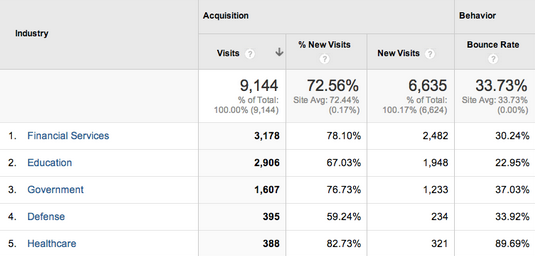
1- Traffic Distribution by Industry  
Within the GA interface you have a nice presentation your traffic by industry. Telecom seems to be strong (24.1% of traffic) in the report below, while Education could use some love from your marketing team. 

2- Engagement By Industry
You can also report on your KPIs by industry (e.g. see how “Education” is the number 2 industry in the report below)

3- Traffic & Engagement By Organization
This report below shows the platform’s ability to take data segmentation a step further, and highlights specific organizations within the industry visiting the website (e.g. Yale University)

With firmographic data integrated into Google Analytics, it is possible to optimize paid campaigns such as Google AdWords, LinkedIn, banner ads, etc., and pinpoint how many companies from a specified list visited your site, which industries and what size companies visited the site. It provides the opportunity to then target paid campaigns to those visitors and channels, or increase efforts to reach untapped segments of a targeted audience. 
Technical Considerations 
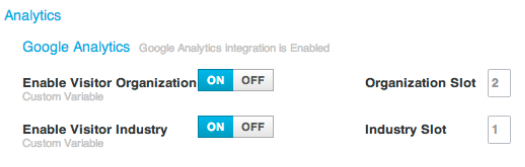
Not a whole lot of considerations. Insightera makes it easy to plug and play. In your ‘Admin’ interface, select your Custom Variables slots for the ‘Industry’ and ‘Organization’ -- and let the rich data flow. Double check that the selected custom variable slots are empty and that you’re not already using them for something else in your Google Analytics implementation. 

Content Personalization
Equipped with this new data, you can automate and personalize remarketing efforts and create targeted ads based on any given criteria. In the example above, the education-specific whitepaper can be presented to your higher-ed visitors, while hi-tech/software related content can be presented to your hi-tech/software visitors. 
Insightera’s recommendation engine filters visitors by location and industry, content preferences and CRM data and digital behavior patterns. This process then predicts which content or channel works best for each visitor.
Increase the Value of Universal Analytics with more User Centricity 
If you’re an early adopter of Universal Analytics or planning to migrate to Universal Analytics, Insightera will soon have you covered. The same method described above can be applied and firmographic data can be integrated into Custom Dimensions. 

With some additional customization, and if you are (and you should be) user-centric, you can take up your implementation a notch up and report on visitors, not just visits, across web, mobile and other devices. Examples include where you have premium/gated content behind registration, user logins or when users self-identify. In these examples, a user-id is associated with each authenticated visitor and stored in a Custom Dimension. Measuring user behavior across multiple sessions and across multiple devices will then be available and you’ll be able to stitch data from different data sources including Insightera as well CRM systems such integrating GA with SalesForce.

Conclusion
As advertising and remarketing efforts reach new levels of focus, site owners have the most relevant information to meet their needs thanks to account-based marketing. Combining the power of Google Analytics with the new scope of firmographic data allows a new level of Performance Analytics. This set of tools offers deeper analytic insights into who your potential customers are, what they do, where they come from and what they consume.
Posted by Feras Alhlou, Principal Consultant, E-Nor, a Google Analytics Authorized Premium Reseller

Klarna tracks third-party iframe with Universal Analytics’ cookieless approach

Klarna is one of the biggest providers in Europe of in-store credit and invoice based payment solutions for the ecommerce sector. The company enables the end-consumer to order and receive products, then pay for them afterwards. Klarna assesses the credit and fraud risk for the  merchant, allowing the merchant to have a zero-friction checkout process – a win-win for the merchant-customer relationship.


Third-party domains pose a problem
Merchants use Klarna’s iframed checkout solution. The iframe is located on the merchant’s domain, but the actual iframe contents are hosted on  Klarna’s own domain. Browsers such as Safari on iPhone and iPad, and later generation desktop browsers such as Internet Explorer 10 prevent  third-party cookies by default. Many analytics solutions rely on the use of cookies though. In order to prevent the loss of nearly all iPhone visits and  many desktop visits, Klarna wanted to address this problem. 

A cookieless approach to the rescue
Working with Google Analytics Certified Partner Outfox, Klarna found exactly what it needed in Universal Analytics, which introduces a set of features that change the way data is collected and organized in Google Analytics accounts. In addition to standard Google Analytics features, Universal Analytics provides new data collection methods, simplified feature configuration, custom dimensions and metrics, and multi-platform tracking.
“Thanks to Universal Analytics we can track the iframe on our merchants’ domains and be sure we get all traffic.”
- David Fock, Vice President Commerce, Klarna

In Klarna’s new cookieless approach, the “storage: none” option was selected in creating the account in Universal Analytics. The checkout iframe meanwhile uses a unique non-personally identifiable ‘client ID’. These measures cause Universal Analytics to disable cookies and instead use the client ID as a session identifier. Because no cookies are in use, browsers that don’t allow for third-party cookies aren’t an issue at all. 

Virtual pageviews are sent on checkout form interactions. Custom dimensions and metrics are used for tagging a visit, with a dimension  indicating which merchant is hosting the iframe, and a metric showing what cart value the user brings to the checkout.

Complete tracking and assured analysis
With Universal Analytics features, Klarna ensures iframe tracking is complete across all browsers. By using the virtual pageviews as URL goals  and funnel steps, goal flow visualizations are used to find bottlenecks in the checkout flow. The new custom dimensions and metrics together with  ecommerce tracking mean that reports can now be set up to reveal how each merchant’s cart value correlates to its final transaction value.

Be sure to check out the whole case study here.

Posted by the Google Analytics Team