Tag Archives: Ecommerce

Mumzworld reaches 300% ROAS with Google Analytics

From rattles to diapers to playhouses, Mumzworld sells everything for babies and children to hundreds of thousands of online shoppers in the Middle East each year. The company advertises on many platforms and works hard to engage consumers with the best possible product catalog. 

For Mumzworld, the challenge was to spend those ad dollars wisely, with full insight into ROI and product availability. The company wanted to increase online sales and repeat buyers while keeping user acquisition cost low. They also wanted a platform to help them manage on-site inventory better and lower out-of-stock product views.

For help, Mumzworld turned to InfoTrust, a Google Analytics Certified Partner that specializes in ecommerce data integration. Together, Mumzworld and InfoTrust implemented Google Analytics Enhanced Ecommerce for deeper shopper insights, product inventory tracking and leveraged InfoTrust’s data integration tool, Analyze.ly, to import cost-related metrics from non-Google platforms into GA. 

Through remarketing and automated reports for out-of-stock products day-over-day, Mumzworld was able to see growth in total conversions, conversion rate and maintain a ROAS at 300% across top channels. Read the full case study.
Click image for full-sized version

“InfoTrust cleaned up our Google Analytics account and helped us better capture key data in dashboards, so we could dissect the information that helps us make our business better. It showed us key KPIs to watch for and created automated reports so we could measure and react to these KPIs.” —Mona Ataya, CEO and Founder, Mumzworld FZ-LLC

To learn how Mumzworld and InfoTrust worked together to achieve these results, download the full case study

Posted by Daniel Waisberg, Analytics Advocate

How To Setup Enhanced Ecommerce Impressions Using Scroll Tracking

A version of this post originally appeared on Google Analytics Certified Partner InfoTrust's site.
by Nate Denlinger, Web Developer at GACP InfoTrust, LLC

One of our specialities here at InfoTrust is helping ecommerce businesses leverage their web analytics to make better data-driven marketing decisions. This typically starts with installing Google’s Universal Analytics web analytics software and utilizing all of the functionality that is offered with Enhanced Ecommerce tracking capabilities.
Enhanced Ecommerce provides you with a complete picture of what customers on your site are seeing, interacting with and purchasing.
One of the ways you track what your customers are seeing is with product impressions (whenever a user sees an image or description of your products on your website).
Normally, you track what products users see or impressions by simply adding an array of product objects to the DataLayer. These represent the products seen on the page, meaning when any page loads with product images/descriptions, data is sent to Google Analytics that a user saw those specific products. This works well.
However, there is a major issue with this method.  Sometimes you are sending impressions for products that the user never actually sees. This can happen when your page scrolls vertically and some products are off the page or “below the fold”.
For example, lets take a look at a page on Etsy.com:
Sample page on Etsy.com (click for full size)
Here are the results for the search term “Linens”. Currently, you can see sixteen products listed in the search results.  However, in the normal method of sending product impressions, a product impression would be sent for every product on the page.
So, in reality this is what we are telling Google Analytics that the user is seeing (every single product on the page):
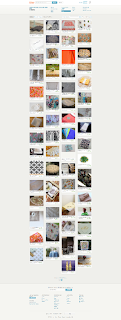
Sample page of Etsy.com (click for full-size)

Obviously, no one's screen looks like this, but by sending all products as an impression, we are effectively saying that our customer saw all 63 products. What happens if the user never scrolls past the 16 products shown in the first screenshot?
We are greatly skewing the impressions for the products on the bottom of the page, because often times, users are not scrolling the entire length of the page (and therefore not seeing the additional products).
This could cause you to make incorrect assumptions about how well a product is selling based off of position.
The solution: Scroll-based impression tracking!
Here is how it works at a high level:
  1. Instead of automatically adding all product impressions to the DataLayer, we add it to another variable just for temporary storage. Meaning, we do not send all the products loaded on a page directly to Google Analytics, but rather just identify the products that loaded on the page.
  2. When the page loads, we actually see what products are visible on the page (ones “above the fold” or where the user can actually see them) and add only those products to the DataLayer for product impressions. Now we don’t send any other product impressions unless they are actually visible to the user.
  3. Once the user starts to scroll, we start capturing all the products that haven’t been seen before. We continue to capture these products until the user stops scrolling for a certain amount of time.
  4. We then batch all of those products together and send them to the DataLayer as product impressions. 
  5. If the user starts to scroll again, we start checking again. However, we never send the same product twice on the same page. If they scroll to the bottom then back up, we don’t send the first products twice.
Using our example on the “Linen” search results, right away we would send product impressions for the first 16 products. Then, let’s say the user scrolled halfway down the page and stopped. We would then send product impressions for products 18 through 40. The user then scrolls to the bottom of the page so we would send product impressions for 41 through 63. Finally the user scrolls back to the top of the page before clicking on the first product. No more impressions would be sent as impressions for all products have already been sent.
The result: Product impressions are only sent as users actually navigate through the pages and can see the products. This is a much more accurate form of product impression tracking since it reflects actual user navigation. 
Next steps: for the technical how-to guide + code samples, please see this post on the InfoTrust site.

Refreshing “The Customer Journey to Online Purchase” – New Insights into Marketing Channels

Last year we introduced “The Customer Journey to Online Purchase” -- a tool that helped marketers visualize the roles played by marketing channels like paid search, email and display ads in their customers' journeys.

The goal was to help marketers learn more about the customer journeys for their industries. If social makes your customers aware, and email makes them convert -- or vice versa -- you can make sure you're in both places with the right kind of message.

Today we're happy to introduce a new improved version of the Customer Journey to Online Purchase, with a few key enhancements.  We’ve refreshed the data based on millions of consumer interactions, updated the industry classifications, and we’ve split out paid search so you can see the influence of brand and generic search terms on the purchase decision.

In each industry you can now see journeys for small, medium and large companies, which can often be quite different.
Click to enlarge image
For instance, the above image shows the journey for customers of small businesses in the shopping industry. Note that organic search is very often an "assist" interaction for these customers.
Click to enlarge image
Now here's the same journey for large shopping businesses. Note that display clicks and social are strongly assisting interactions -- while display didn’t even appear for the small businesses above. For both small and large businesses, a direct website visit is most likely to be the last interaction. Across industries, the differences from small to large businesses illustrate how different marketing strategies and customer profiles may lead to different buying behavior.

And there's more! Now you can drill down into each marketing channel for a closer look at the role it plays based on its position in the purchase path. Channels that occur more frequently in the beginning of the path are more likely to help generate awareness for your product, while the end of the path is closer to the customer’s purchase decision.
Click to enlarge image
In these charts, for example, we see the different roles that different channels play in the Shopping industry. One interesting insight is that all channels -- even those traditionally thought of as “upper funnel” or “lower funnel” -- occur throughout the purchase path, but a given channel may be more common at particular stages depending on its role (and depending on the industry).

Each marketing campaign and channel may have a different impact on customers depending on when they interact with it. Using what you learn from this tool, you can help adapt your marketing messaging to be more relevant and useful for your customers.

Try the Customer Journey to Online Purchase today. And for more helpful marketing insights, check out Measure What Matters Most: our new guide chock-full of suggestions on how to measure the impact of your marketing -- across channels -- to complement what you learn from the Customer Journey tool and take action to improve your marketing.

Happy analyzing!


Better data, better decisions: Enhanced Ecommerce boosts shopping analytics

Earlier this week, we announced the beta launch of Enhanced Ecommerce for Google Analytics. It's a complete revamp of our ecommerce analytics, designed to provide richer insights into pre-purchase shopping behavior and into product performance.

“With Enhanced Ecommerce our clients can immediately gain clear insight into the most important metrics about shopper behavior and conversion: what products are viewed, where they are viewed, when they are added to carts, how the checkout process works and where customers get lost, and even details like payment methods.”
- Caleb Whitmore, CEO of Analytics Pros

Enhanced Ecommerce is designed to keep pace with the remarkable rise of online retail, which grew another 30% year over year in 2013. Digital data has played an essential role in that growth, offering deep insights into shopper behavior and letting retailers make smarter decisions. But needs are rapidly increasing and retailers are requiring more sophisticated and comprehensive analysis tools to understand shoppers and product-level performance. With the launch of Enhanced Ecommerce, we’re providing these tools.

“Enhanced Ecommerce will help us to overcome many challenges. As an example, I'm looking at a report that indicates a 74.4% checkout abandonment rate.  That insight is shockingly simple: over 7 out of 10 people that add something to the cart and start to checkout don't complete it! This is the kind of data that can drive change more readily than, say, simple conversion rates for e-commerce orders.”
 - Caleb Whitmore, CEO of Analytics Pros

Enhanced Ecommerce is built on top of the powerful Universal Analytics foundation. It includes tracking code updates (including full support for Google Tag Manager), data model changes, and new end-user reports that address ecommerce-specific use cases. Together they help online retailers see farther and understand customers better than ever before. 

Get deeper insights
  • Analyze how far shoppers get in the shopping funnel and where they drop off. 
  • Understand which products are viewed most, which are frequently abandoned in cart and which ones convert well. 
  • Upload rich product metadata to slice and dice your data.
  • Create rich user segments to delve deeper into your users’ shopping behavior and the products they interact with.

Optimize your site 
  • Create product lists for onsite merchandising rules and product landing pages to see which lists and products are best at driving customer engagement.
  • Analyze how internal promotions impact sales, and act immediately on the results.
  • With retailers reporting average on-site conversion rates of around 2.7%, even small improvements can have a big impact.
Close the loop
  • With refund support, Google Analytics now covers the entire shopping lifecycle.
  • Import user segments, based on ecommerce activity, for targeting in your remarketing campaigns.
In the chart below, see an example of how the new reports can benefit your business. You can create segments directly from the funnel reports to analyze abandoned cart sessions. See which products were abandoned and which devices to target to recapture those users. This data allows you to take immediate action. 
Shopping behavior funnel report. Use the table to analyze by any session level dimension
Enhanced Ecommerce is all about the bottom line. We've designed it to help you improve your total experience and turn more shoppers into buyers.

Learn more
Sign up today for the new Analytics Academy course on Enhanced Ecommerce! Or come learn more at Internet Retailer Conference Exhibition on June 12; Google’s Jesse Nichols will present Enhanced Ecommerce live. 

You can find more information on getting started with Enhanced Ecommerce in our Help Center and Developer site.  

Happy Analyzing!


Post by: Marcia Jung, Product Manager, Google Analytics