Tag Archives: Health

Releasing the Healthcare Text Annotation Guidelines

The Healthcare Text Annotation Guidelines are blueprints for capturing a structured representation of the medical knowledge stored in digital text. In order to automatically map the textual insights to structured knowledge, the annotations generated using these guidelines are fed into a machine learning algorithm that learns to systematically extract the medical knowledge in the text. We’re pleased to release to the public the Healthcare Text Annotation Guidelines as a standard.

Google Cloud recently launched AutoML Entity Extraction for Healthcare, a low-code tool used to build information extraction models for healthcare applications. There remains a significant execution roadblock on AutoML DIY initiatives caused by the complexity of translating the human cognitive process into machine-readable instructions. Today, this translation occurs thanks to human annotators who annotate text for relevant insights. Yet, training human annotators is a complex endeavor which requires knowledge across fields like linguistics and neuroscience, as well as a good understanding of the business domain. With AutoML, Google wanted to democratize who can build AI. The Healthcare Text Annotation Guidelines are a starting point for annotation projects deployed for healthcare applications.

The guidelines provide a reference for training annotators in addition to explicit blueprints for several healthcare annotation tasks. The annotation guidelines cover the following:
  • The task of medical entity extraction with examples from medical entity types like medications, procedures, and body vitals.
  • Additional tasks with defined examples, such as entity relation annotation and entity attribute annotation. For instance, the guidelines specify how to relate a medical procedure entity to the source medical condition entity, or how to capture the attributes of a medication entity like dosage, frequency, and route of administration.
  • Guidance for annotating an entity’s contextual information like temporal assessment (e.g., current, family history, clinical history), certainty assessment (e.g., unlikely, somewhat likely, likely), and subject (e.g., patient, family member, other).
Google consulted with industry experts and academic institutions in the process of assembling the Healthcare Text Annotation Guidelines. We took inspiration from other open source and research projects like i2b2 and added context to the guidelines to support information extraction needs for industry-applications like Healthcare Effectiveness Data and Information Set (HEDIS) quality reporting. The data types contained in the Healthcare Text Annotation Guidelines are a common denominator across information extraction applications. Each industry application can have additional information extraction needs that are not captured in the current version of the guidelines. We chose to open source this asset so the community can tailor this project to their needs.

We’re thrilled to open source this project. We hope the community will contribute to the refinement and expansion of the Healthcare Text Annotation Guidelines, so they mirror the ever-evolving nature of healthcare.

By Andreea Bodnari, Product Manager and Mikhail Begun, Program Manager—Google Cloud AI

Exploring AI for radiotherapy planning with Mayo Clinic

More than 18 million new cancer cases are diagnosed globally each year, and radiotherapy is one of the most common cancer treatments—used to treat over halfof cancers in the United States. But planning for a course of radiotherapy treatment is often a time-consuming and manual process for clinicians. The most labor-intensive step in planning is a technique called “contouring” which involves segmenting both the areas of cancer and nearby healthy tissues that are susceptible to radiation damage during treatment. Clinicians have to painstakingly draw lines around sensitive organs on scans—a time-intensive process that can take up to seven hours for a single patient.

Technology has the potential to augment the work of doctors and other care providers, like the specialists who plan radiotherapy treatment. We’re collaborating with Mayo Clinic on research to develop an AI system that can support physicians, help reduce treatment planning time and improve the efficiency of radiotherapy. In this research partnership, Mayo Clinic and Google Health will work to develop an algorithm to assist clinicians in contouring healthy tissue and organs from tumors, and conduct research to better understand how this technology could be deployed effectively in clinical practice. 

Mayo Clinic is an international center of excellence for cancer treatment with world-renowned radiation oncologists. Google researchers have studied how AI can potentially be used to augment other areas of healthcare—from mammographies to the early deployment of an AI system that detects diabetic retinopathy using eye scans. 

In a previous collaboration with University College London Hospitals, Google researchers demonstrated how an AI system could analyze and segment medical scans of patients with head and neck cancer— similar to how expert clinicians would. Our research with Mayo Clinic will also focus on head and neck cancers, which are particularly challenging areas to contour, given the many delicate structures that sit close together. 

In this first phase of research with Mayo Clinic, we hope to develop and validate a model as well as study how an AI system could be deployed in practice. The technology will not be used in a clinical setting and algorithms will be developed using only de-identified data. 

While cancer rates continue to rise, the shortage of radiotherapy experts continues to grow as well. Waiting for a radiotherapy treatment plan can be an agonizing experience for cancer patients, and we hope this research will eventually support a faster planning process and potentially help patients to access treatment sooner.

This researcher is tracking COVID with help from Google

A research team at Carnegie Mellon University (CMU) has been working to make epidemiological forecasting as universal as weather forecasting. When COVID hit, they launched COVIDcast to develop data monitoring and forecasting resources that can help public health officials, researchers, and the public make informed decisions. 

Last month, CMU received $1 million from Google.org and a team of thirteen Google.org Fellows to work pro bono for six months to help continue building out COVIDcast. This was part of Google.org’s $100 million commitment to COVID relief

We caught up with Ryan Tibshirani, a research lead at CMU, to learn more about the project and what the Google.org fellows will work on. 

Tell us a little bit about yourself.  

I'm a faculty member at CMU, jointly appointed in Statistics and Machine Learning, and I’m very interested in epidemiological forecasting and tracking. In 2012, I cofounded Delphi centered on this topic with Roni Rosenfeld, Professor and Head of Machine Learning at CMU.  

What do you focus on most these days?

Since the pandemic began I’ve  spent all of my time on COVID-19 research. Delphi has quadrupled the number of researchers in just eight months and we’re laser-focused on COVID. Leading Delphi's pandemic response effort has been both a challenge—I've never done anything like this before—and a joy—the group is full of amazing people. 

How did you come up with the idea for COVIDcast? 

To back up just a bit: Roni and I formed Delphi in 2012 with the goal to develop the theory and practice of epidemiological forecasting, primarily for seasonal influenza in the U.S. We want this technology to become as universally accepted and useful as today’s weather forecasting. 

Our forecasting system has been a top performer at the Centers for Disease Control's (CDC) annual forecasting challenges, and last year Delphi Group was named one of the two Centers of Excellence for Influenza Forecasting. I like to think of COVIDcast as a replica of what we’ve done for the flu but better and faster.

Break it down for us, what is COVIDcast?

The COVIDcast project is about building and providing an ecosystem for COVID-19 tracking and forecasting. Our aim is to support informed decision-making at federal, state, and local levels of government, in the healthcare sector, and beyond. 

The project has many parts: 

  • Unique relationships with tech and healthcare partners that give us access to data with different views of pandemic activity in the U.S;

  • Code and infrastructure to build new, geographically-detailed, continuously-updated COVID-19 indicators;

  • A historical database of all indicators, including revision tracking;

  • A public API that serves new indicators daily, along with interactive maps and graphics to display them;

  • And lastly, modeling work that builds on the indicators to improve nowcasting and forecasting the spread of COVID-19.

A key element of COVIDcast is that we make all of our work as open and accessible as possible to other researchers and the public to help amplify its impact. We share both our data and a range of software tools—from data processing and visualization to sophisticated statistical tools. 

How will the Google.org funding and fellowship help?

This support will help Delphi expand our efforts to provide a geographically-detailed view of various aspects of the pandemic and to develop an early warning system for health officials, for example, when the number of cases in a locale are expected to rise. There will be more pandemics and epidemics after COVID-19. We want to be prepared, and we believe Delphi's work can help us do that. 

The Google.org Fellowship just kicked off. What are you most excited about?  

Everything! We're excited to embed all the Google.org Fellows—engineers, user experience designers and researchers, program and product managers—into our workstreams. We hope they can help accelerate our progress and introduce us to leading industry product and software development techniques. Each and every one of the fellows has special skills that will be put to good use. We can't wait to see what we can achieve, together. 

More broadly, what role does the tech sector play in COVID-19 response efforts? 

An enormous role. The tech sector is uniquely positioned to provide data and platforms that even governments can't provide. It also has the skills and experience to quickly assemble large-scale systems, in real time. Google has been extraordinarily helpful to us on all of these fronts.

Improving the Accuracy of Genomic Analysis with DeepVariant 1.0

Sequencing genomes involves sampling short pieces of the DNA from the ~6 billion pairs of nucleobases — i.e., adenine (A), thymine (T), guanine (G), and cytosine (C) — we inherit from our parents. Genome sequencing is enabled by two key technologies: DNA sequencers (hardware) that "read" relatively small fragments of DNA, and variant callers (software) that combine the reads to identify where and how an individual's genome differs from a reference genome, like the one assembled in the Human Genome Project. Such variants may be indicators of genetic disorders, such as an elevated risk for breast cancer, pulmonary arterial hypertension, or neurodevelopmental disorders.

In 2017, we released DeepVariant, an open-source tool which identifies genome variants in sequencing data using a convolutional neural network (CNN). The sequencing process begins with a physical sample being sequenced by any of a handful of instruments, depending on the end goal of the sequencing. The raw data, which consists of numerous reads of overlapping fragments of the genome, are then mapped to a reference genome. DeepVariant analyzes these mappings to identify variant locations and distinguish them from sequencing errors.

Soon after it was first published in 2018, DeepVariant underwent a number of updates and improvements, including significant changes to improve accuracy for whole exome sequencing and polymerase chain reaction (PCR) sequencing.

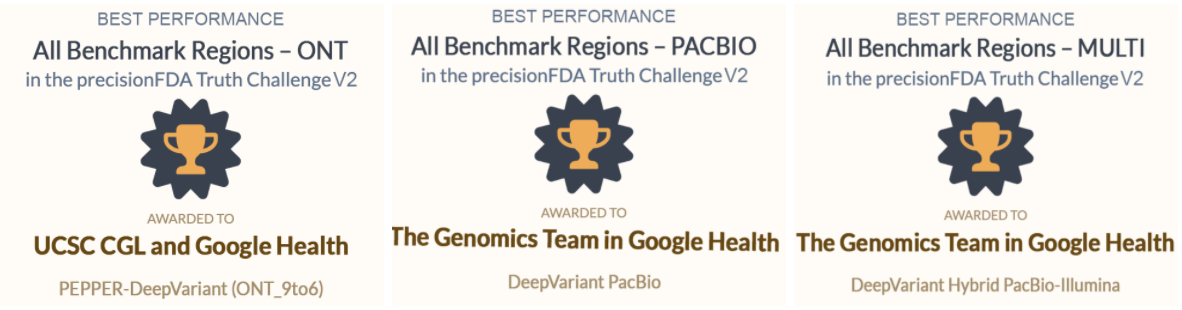
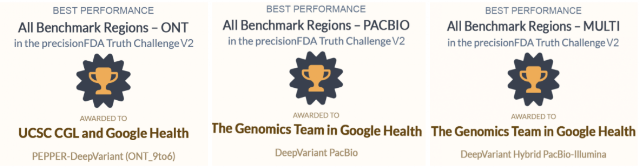
We are now releasing DeepVariant v1.0, which incorporates a large number of improvements for all sequencing types. DeepVariant v1.0 is an improved version of our submission to the PrecisionFDA v2 Truth Challenge, which achieved Best Overall accuracy for 3 of 4 instrument categories. Compared to previous state-of-the-art models, DeepVariant v1.0 significantly reduces the errors for widely-used sequencing data types, including Illumina and Pacific Biosciences. In addition, through a collaboration with the UCSC Genomics Institute, we have also released a model that combines DeepVariant with the UCSC’s PEPPER method, called PEPPER-DeepVariant, which extends coverage to Oxford Nanopore data for the first time.

Sequencing Technologies and DeepVariant
For the last decade, the majority of sequence data were generated using Illumina instruments, which produce short (75-250 bases) and accurate sequences. In recent years, new technologies have become available that can sequence much longer pieces, including Pacific Biosciences, which can produce long and accurate sequences up to ~15,000 bases in length, and Oxford Nanopore, which can produce reads up to 1 million bases long, but with higher error rates. The particular type of sequencing data a researcher might use depends on the ultimate use-case.

Because DeepVariant is a deep learning method, we can quickly re-train it for these new instrument types, ensuring highly accurate sequence identification. Accuracy is important because a missed variant call could mean missing the causal variant for a disorder, while a false positive variant call could lead to identifying an incorrect one. Earlier state-of-the-art methods could reach ~99.1% accuracy (~73,000 errors) on a 35-fold coverage Illumina whole genome, whereas an early version of DeepVariant (v0.10) had ~99.4% accuracy (46,000 errors), corresponding to a 38% error reduction. DeepVariant v1.0 reduces Illumina errors by another ~22% and PacBio errors by another ~52% relative to the last DeepVariant release (v0.10).

DeepVariant Overview
DeepVariant is a convolutional neural network (CNN) that treats the task of identifying genetic variants as an image classification problem. DeepVariant constructs tensors, essentially multi-channel images, where each channel represents an aspect of the sequence, such as the bases in the sequence (called read base), the quality of alignment between different reads (mapping quality), whether a given read supports an alternate allele (read supports variant), etc. It then analyzes these data and outputs three genotype likelihoods, corresponding to how many copies (0, 1, or 2) of a given alternate allele are present.

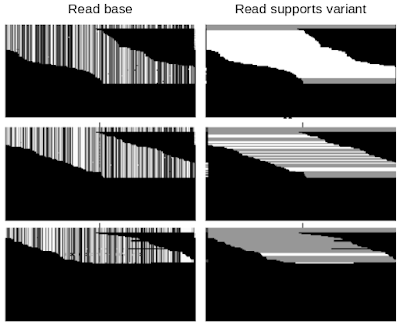
Example of DeepVariant data. Each row of pixels in each panel corresponds to a single read, i.e., a short genetic sequence. The top, middle, and bottom rows of panels present examples with a different number of variant alleles. Only two of the six data channels are shown: Read base — the pixel value is mapped to each of the four bases, A, C, G, or T; Read supports variant — white means that the read is consistent with a given allele and grey means it is not. Top: Classified by DeepVariant as a "2", which means that both chromosomes match the variant allele. Middle: Classified as a “1”, meaning that one chromosome matches the variant allele. Bottom: Classified as a “0”, implying that the variant allele is missing from both chromosomes.

Technical Improvements in DeepVariant v1.0
Because DeepVariant uses the same codebase for each data type, improvements apply to each of Illumina, PacBio, and Oxford Nanopore. Below, we show the numbers for Illumina and PacBio for two types of small variants: SNPs (single nucleotide polymorphisms, which change a single base without changing sequence length) and INDELs (insertions and deletions).

  • Training on an extended truth set

    The Genome in a Bottle consortium from the National Institute of Standards and Technology (NIST) creates gold-standard samples with known variants covering the regions of the genome. These are used as labels to train DeepVariant. Using long-read technologies the Genome in a Bottle expanded the set of confident variants, increasing the regions described by the standard set from 85% of the genome to 92% of it. These more difficult regions were already used in training the PacBio models, and including them in the Illumina models reduced errors by 11%. By relaxing the filter for reads of lower mapping quality, we further reduced errors by 4% for Illumina and 13% for PacBio.

  • Haplotype sorting of long reads

    We inherit one copy of DNA from our mother and another from our father. PacBio and Oxford Nanopore sequences are long enough to separate sequences by parental origin, which is called a haplotype. By providing this information to the neural network, DeepVariant improves its identification of random sequence errors and can better determine whether a variant has a copy from one or both parents.

  • Re-aligning reads to the alternate (ALT) allele

    DeepVariant uses input sequence fragments that have been aligned to a reference genome. The optimal alignment for variants that include insertions or deletions could be different if the aligner knew they were present. To capture this information, we implemented an additional alignment step relative to the candidate variant. The figure below shows an additional second row where the reads are aligned to the candidate variant, which is a large insertion. You can see sequences that abruptly stop in the first row can now be fully aligned, providing additional information.

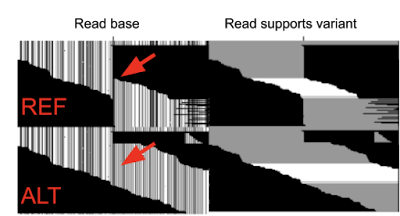
    Example of DeepVariant data with realignment to ALT allele. DeepVariant is presented the information in both rows of data for the same example. Only two of the six data channels are shown: Read base (channel #1) and Read supports variant (channel #5). Top: Shows the reads aligned to the reference (in DeepVariant v0.10 and earlier this is all DeepVariant sees). Bottom: Shows the reads aligned to the candidate variant, in this case a long insertion of sequence). The red arrow indicates where the inserted sequence begins.
  • Use a small network to post-process outputs

    Variants can have multiple alleles, with a different base inherited from each parent. DeepVariant’s classifier only generates a probability for one potential variant at a time. In previous versions, simple hand-written rules converted the probabilities into a composite call, but these rules failed in some edge cases. In addition, it also separated the way a final call was made from the backpropagation to train the network. By adding a small, fully-connected neural network to the post-processing step, we are able to better handle these tricky multi-allelic cases.

  • Adding data to train the release model

    The timeframe for the competition was compressed, so we trained only with data similar to the challenge data (PCR-Free NovaSeq) to speed model training. In our production releases, we seek high accuracy for multiple instruments as well as PCR+ preparations. Training with data from these diverse classes helps the model generalize, so our DeepVariant v1.0 release model outperforms the one submitted.

The charts below show the error reduction achieved by each improvement.

Training a Hybrid model
DeepVariant v1.0 also includes a hybrid model for PacBio and Illumina reads. In this case, the model leverages the strengths of both input types, without needing new logic.

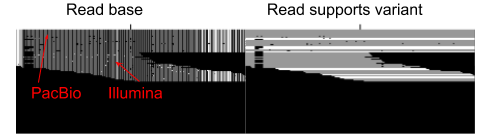
Example of DeepVariant merging data from both PacBio and Illumina. Only two of the six data channels are shown: Read base (channel #1) and Read supports variant (channel #5). The longer PacBio reads (at the upper part of the image) span the region being called entirely, while the shorter Illumin reads span only a portion of the region.

We observed no change in SNP errors, suggesting that PacBio reads are strictly superior for SNP calling. We observed a further 49% reduction in Indel errors relative to the PacBio model, suggesting that the Indel error modes of Illumina and PacBio HiFi can be used in a complementary manner.

PEPPER-Deepvariant: A Pipeline for Oxford Nanopore Data Using DeepVariant
Until the PrecisionFDA competition, a DeepVariant model was not available for Oxford Nanopore data, because the higher base error rate created too many candidates for DeepVariant to classify. We partnered with the UC Santa Cruz Genomics Institute, which has extensive expertise with Nanopore data. They had previously trained a deep learning method called PEPPER, which could narrow down the candidates to a more tractable number. The larger neural network of DeepVariant can then accurately characterize the remaining candidates with a reasonable runtime.

The combined PEPPER-DeepVariant pipeline with the Oxford Nanopore model is open-source and available on GitHub. This pipeline was able to achieve a superior SNP calling accuracy to DeepVariant Illumina on the PrecisionFDA challenge, which is the first time anyone has shown Nanopore outperforming Illumina in this way.

Conclusion
DeepVariant v1.0 isn’t the end of development. We look forward to working with the genomics community to further maximize the value of genomic data to patients and researchers.

Source: Google AI Blog


Making data useful for public health

Researchers around the world have used modelling techniques to find patterns in data and map the spread of COVID-19, in order to combat the disease. Modelling a complex global event is challenging, particularly when there are many variables—human behavior, evolving science and policy, and socio-economic issues—as well as unknowns about the virus itself. Teams across Google are contributing tools and resources to the broader scientific community of epidemiologists, analysts and researchers who are working with policymakers and public health officials to address the public health and economic crisis.

Organizing the world’s data for epidemiological researchers

Lack of access to useful high-quality data has posed a significant challenge, and much of the publicly available data is scattered, incomplete, or compiled in many different formats. To help researchers spend more of their time understanding the disease instead of wrangling data, we've developed a set of tools and processes to make it simpler for researchers to discover and work with normalized high-quality public datasets. 


With the help of Google Cloud, we developed a COVID-19 Open Data repository—a comprehensive, open-source resource of COVID-19 epidemiological data and related variables like economic indicators or population statistics from over 50 countries. Each data source contains information on its origin, and how it’s processed so that researchers can confirm its validity and reliability. It can also be used with Data Commons, BigQuery datasets, as well as other initiatives which aggregate regional datasets. 


This repository also includes two Google datasets developed to help researchers study the impact of the disease in a privacy-preserving manner. In April, we began publishing the COVID-19 Community Mobility Reports, which provide anonymized insights into movement trends to understand the impact of policies like shelter in place. These reports have been downloaded over 16 million times and are now updated three times a week in 64 languages, with localized insights covering 12,000 regions, cities and counties for 135 countries. Groups including the OECD, World Bank and Bruegel have used these reports in their research, and the insights inform strategies like how public health could safely unwind social distancing policies.


The latest addition to the repository is the Search Trends symptoms dataset, which aggregates anonymized search trends for over 400 symptoms. This will help researchers better understand the spread of COVID-19 and its potential secondary health impacts.

Tools for managing complex prediction modeling

The data that models rely upon may be imperfect due a range of factors, including a lack of widespread testing or inconsistent reporting. That’s why COVID-19 models need to account for uncertainty in order for their predictions to be reliable and useful. To help address this challenge, we’re providing researchers examples of how to implement bespoke epidemiological models using TensorFlow Probability (TFP), a library for building probabilistic models that can measure confidence in their own predictions. With TFP, researchers can use a range of data sources with different granularities, properties, or confidence levels, and factor that uncertainty into the overall prediction models. This could be particularly useful in fine-tuning the increasingly complex models that epidemiologists are using to understand the spread of COVID-19, particularly in gaining city or county-level insights when only state or national-level datasets exist.  


While models can help predict what happens next, researchers and policymakers are also turning to simulations to better understand the potential impact of their interventions. Simulating these "what if" scenarios involve calculating highly variable social interactions at a massive scale. Simulators can help trial different social distancing techniques and gauge how changes to the movement of people may impact the spread of disease.


Google researchers have developed an open-source agent-based simulator that utilizes real-world data to simulate populations to help public health organizations fine tune their exposure notification parameters. For example, the simulator can consider different disease and transmission characteristics, the number of places people visit, as well as the time spent in those locations. We also contributed to Oxford’s agent-based simulator by factoring in real world mobility and representative models of interactions within different workplace sectors to understand the effect of an exposure notification app on the COVID-19 pandemic.


The scientific and developer community are working on important work to understand and manage the pandemic. Whether it’s by contributing to open source initiatives or funding data science projects and providing Google.org Fellows, we’re committed to collaborating with researchers on efforts to build a more equitable and resilient future.

How sobriety has helped me cope through a pandemic

I never considered myself an addict until the day I found myself huddled under my covers at four in the afternoon, hungover and wishing my surroundings would disappear. This wasn’t the first time that had happened—in fact, it had become a weekly occurrence—but as I curled up into a ball, feeling pathetic and utterly alone, I realized I had no other options. I grabbed my phone from my nightstand and searched “rehab centers near me.”

I’d been dealing with major depression for years, and up until that moment I thought I had tried everything to find a cure. Special diets, an alphabet soup of antidepressant regimens, group therapy, solo therapy, transcranial magnetic stimulation, ketamine infusions. The only thing I hadn’t tried was sobriety. Drugs and alcohol were my only escape. I couldn’t fathom giving up the one thing that freed myself from the darkest grips of my own mind.

My Google search surfaced a number of local treatment centers, and after making some calls, I found one with a program that could help me. That was more than two years ago. Since then, thanks to hard work that continues today, I’ve remained sober and depression-free. 

Most people in recovery would agree: you can’t do it alone. It’s a reciprocal relationship—my recovery community helps to keep me sober, and my sobriety allows me to play an active role in that community. Twelve-step programs, new habits and the support of others with similar experiences provide a foundation, and then I can build a life I never thought was possible to live when depression controlled my every moment.

That foundation has carried me through COVID-19. Staying sober during a global pandemic is a bit of a paradox. During a time when people are more isolated than ever before, turning to substances to self-soothe seems like a natural response. And the data backs that up: Google searches for “how to get clean” reached an all-time high in June, and “how to get sober” surged in June and then again in August. In the past 30 days, searches for “rehab near me” hit their second-highest peak in recorded history.

And yet sobriety—in an era where it’s harder than ever to stay sober—is precisely what’s gotten me through this time. Staying sober has let me be present with my emotions, to face my anxieties and difficulties head-on. While I can’t numb my feelings, I can protect my mental health. My recovery practice has allowed me to do just that: Daily gratitude lists remind me how fortunate I still am, my sponsor regularly offers wisdom and advice, my peers hold space for my challenges and I do the same for them.

In the throes of my own crisis, the first place I turned to for help was Google. I ended up at a rehab center that profoundly transformed the way I move through the world. Last September, as part of National Recovery Month, Google made these resources even easier to find with its Recover Together site. This year, Google is adding even more features, including a mapping tool that allows you to search for local support groups by simply typing in your zip code. Of course, the search results also include virtual meetings, now that many programs have moved online. 

Map of addiction support groups in Boston area

Our new Recover Together map shows nearby (and virtual) support groups.

I’m proud to work for a company that prioritizes an issue that affects an estimated one in eight American adults and their loved ones. I’m proud to work for a company where I can take time from my day to attend 12-step meetings, no questions asked, and where I can bring my whole self to work and speak freely about my struggles. And I’m proud to work for a company that celebrates my experience as one of triumph rather than shame. That’s committed to reducing the stigma around addiction by providing resources for people like me. 

Recovery doesn’t happen in a vacuum. I can’t do it all by myself, which is why I’m sharing my story today. I hope that even one person who has fought similar battles will read what I have to say and realize that they, too, aren’t in this alone.

Google supports COVID-19 AI and data analytics projects

Nonprofits, universities and other academic institutions around the world are turning to artificial intelligence (AI) and data analytics to help us better understand COVID-19 and its impact on communities—especially vulnerable populations and healthcare workers. To support this work, Google.org is giving more than $8.5 million to 31 organizations around the world to aid in COVID-19 response. Three of these organizations will also receive the pro-bono support of Google.org Fellowship teams

This funding is part of Google.org’s $100 million commitment to COVID-19 relief and focuses on four key areas where new information and action is needed to help mitigate the effects of the pandemic.


Monitoring and forecasting disease spread

Understanding the spread of COVID-19 is critical to informing public health decisions and lessening its impact on communities. We’re supporting the development of data platforms to help model disease and projects that explore the use of diverse public datasets to more accurately predict the spread of the virus.


Improving health equity and minimizing secondary effects of the pandemic

COVID-19 has had a disproportionate effect on vulnerable populations. To address health disparities and drive equitable outcomes, we’re supporting efforts to map the social and environmental drivers of COVID-19 impact, such as race, ethnicity, gender and socioeconomic status. In addition to learning more about the immediate health effects of COVID-19, we’re also supporting work that seeks to better understand and reduce the long-term, indirect effects of the virus—ranging from challenges with mental health to delays in preventive care.


Slowing transmission by advancing the science of contact tracing and environmental sensing

Contact tracing is a valuable tool to slow the spread of disease. Public health officials around the world are using digital tools to help with contact tracing. Google.org is supporting projects that advance science in this important area, including research investigating how to improve exposure risk assessments while preserving privacy and security. We’re also supporting related research to understand how COVID-19 might spread in public spaces, like transit systems.


Supporting healthcare workers

Whether it’s working to meet the increased demand for acute patient care, adapting to rapidly changing protocols or navigating personal mental and physical wellbeing, healthcare workers face complex challenges on the frontlines. We’re supporting organizations that are focused on helping healthcare workers quickly adopt new protocols, deliver more efficient care, and better serve vulnerable populations. 

Together, these organizations are helping make the community’s response to the pandemic more advanced and inclusive, and we’re proud to support these efforts. You can find information about the organizations Google.org is supporting below.  

Monitoring and forecasting disease spread

  • Carnegie Mellon University*: informing public health officials with interactive maps that display real-time COVID-19 data from sources such as web surveys and other publicly-available data.

  • Keio University: investigating the reliability of large-scale surveys in helping model the spread of COVID-19.

  • University College London:modeling the prevalence of COVID-19 and understanding its impact using publicly-available aggregated, anonymized search trends data.  

  • Boston Children's Hospital, Oxford University, Northeastern University*: building a platform to support accurate and trusted public health data for researchers, public health officials and citizens.

  • Tel Aviv University: developing simulation models using synthetic data to investigate the spread of COVID-19 in Israel.

  • Kampala International University, Stanford University, Leiden University, GO FAIR: implementing data sharing standards and platforms for disease modeling for institutions across Uganda, Ethiopia, Nigeria, Kenya, Tunisia and Zimbabwe. 

Improving health equity and minimizing secondary effects of the pandemic 

  • Morehouse School of Medicine’s Satcher Health Leadership Institute*: developing an interactive, public-facing COVID-19 Health Equity Tracker of the United States. 

  • Florida A&M University, Shaw University: examining structural social determinants of health and the disproportionate impact of COVID-19 in communities of color in Florida and North Carolina.

  • Boston University School of Public Health:investigating the drivers of racial, ethnic and socioeconomic disparities in the causes and consequences of COVID-19, with a focus on Massachusetts.

  • University of North Carolina, Vanderbilt University:investigating molecular mechanisms underlying susceptibility to SARS-CoV-2 and variability in COVID-19 outcomes in Hispanic/Latinx populations. 

  • Beth Israel Deaconess Medical Center: quantifying the impact of COVID-19 on healthcare not directly associated with the virus, such as delayed routine or preventative care.

  • Georgia Institute of Technology:investigating opportunities for vulnerable populations to find information related to COVID-19. 

  • Cornell Tech:developing digital tools and resources for advocates and survivors of intimate partner violence during COVID-19. 

  • University of Michigan School of Information: evaluating health equity impacts of the rapid virtualization of primary healthcare. 

  • Indian Institute of Technology Gandhinagar: modeling the impact of air pollution on COVID-related secondary health exacerbations. 

  • Cornell University, EURECOM:developing scalable and explainable methods for verifying claims and identifying misinformation about COVID-19.

Slowing transmission by advancing the science of contact tracing and environmental sensing

  • Arizona State University:applying federated analytics (a state-of-the-art, privacy-preserving analytic technique) to contact tracing, including an on-campus pilot.

  • Stanford University:applying sparse secure aggregation to detect emerging hotspots.

  • University of Virginia, Princeton University, University of Maryland:designing and analyzing effective digital contact tracing methods. 

  • University of Washington: investigating environmental SARS-CoV-2 detection and filtration methods in bus lines and other public spaces. 

  • Indian Institute of Science, Bengaluru:mitigating the spread of COVID-19 in India’s transit systems with rapid testing and modified commuter patterns. 

  • TU Berlin, University of Luxembourg:using quantum mechanics and machine learning to understand the binding of SARS-CoV-2 spike protein to human cells—a key process in COVID-19 infection.

Supporting healthcare workers 

  • Medic Mobile, Dimagi: developing data analytics tools to support frontline health workers in countries such as India and Kenya.

  • Global Strategies:developing software to support healthcare workers adopting COVID-19 protocols in underserved, rural populations in the U.S., including Native American communities. 

  • C Minds:creating an open-source, AI-based support system for clinical trials related to COVID-19.  

  • Hospital Israelita Albert Einstein:supporting and integrating community health workers and volunteers to help deliver mental health services and monitor outcomes in one of Brazil's most vulnerable communities.

  • Fiocruz Bahia, Federal University of Bahia:establishing an AI platform for research and information-sharing related to COVID-19 in Brazil.

  • RAD-AID:creating and managing a data lake for institutions in low- and middle-income countries to pool anonymized data and access AI tools.  

  • Yonsei University College of Medicine: scaling and distributing decision support systems for patients and doctors to better predict hospitalization and intensive care needs due to COVID-19.

  • University of California Berkeley and Gladstone Institutes: developing rapid at-home CRISPR-based COVID-19 diagnostic tests using cell phone technology. 

  • Fondazione Istituto Italiano di Tecnologia:enabling open-source access to anonymized COVID-19 chest X-ray and clinical data, and researching image analysis for early diagnosis and prognosis.

*Recipient of a Google.org Fellowship 

Using symptoms search trends to inform COVID-19 research

Search is often where people come to get answers on health and wellbeing, whether it’s to find a doctor or treatment center, or understand a symptom better just before a doctor's visit. In the past, researchers have used Google Search data to gauge the health impact of heatwaves, improve prediction models for influenza-like illnesses, and monitor Lyme disease incidence. Today we’re making available a dataset of search trends for researchers to study the link between symptom-related searches and the spread of COVID-19. We hope this data could lead to a better understanding of the pandemic’s impact.

fever-2x.gif

Using the dataset, researchers can develop models and create visualizations based on the popularity of symptom-related searches. This sample visualization is based on search volume for fever across the U.S. This visualization does not reflect the dataset’s user interface but shows what can be generated. 

How search trends can support COVID-19 research 

The COVID-19 Search Trends symptoms dataset includes aggregated, anonymized search trends for more than 400 symptoms, signs and health conditions, such as cough, fever and difficulty breathing. The dataset includes trends at the U.S. county-level from the past three years in order to make the insights more helpful to public health, and so researchers can account for changes in searches due to seasonality.


Public health currently uses a range of datasets to track and forecast the spread of COVID-19. Researchers could use this dataset to study if search trends can provide an earlier and more accurate indication of the reemergence of the virus in different parts of the country. And since measures such as shelter-in-place have reduced the accessibility of care and affected people’s wellbeing more generally, this dataset—which covers a broad range of symptoms and conditions, from diabetes to stress—could also be useful in studying the secondary health effects of the pandemic.

The dataset is available in Google Cloud's COVID-19 Free Public Dataset Program and is downloadable in CSV format from Google Research at Open COVID-19 Data GitHub repository

Advancing health research with privacy protections

The COVID-19 Search Trends symptoms dataset is powered by the same anonymization technology that we use in the Community Mobility Reports and other Google products every day. No personal information or individual search queries are included. The dataset was produced using differential privacy, a state-of-the-art technique that adds random noise to the data to provide privacy guarantees while preserving the overall quality of the data.

Similar to Google Trends, the data is normalized based on a symptom’s relative popularity, allowing researchers to study spikes in search interest over different time periods, without exposing any individual query or even the number of queries in any given area. 

More information about the privacy methods used to generate the dataset can be found in this report.

What’s next

This early release is limited to the United States and covers searches made in English and Spanish. It covers all states and many counties, where the available data meets quality and privacy thresholds. It was developed to specifically aid research on COVID-19, so we intend to make the dataset available for the duration of the pandemic. 

As we receive feedback from public health researchers, civil society groups and the community at large, we’ll evaluate and expand this dataset by including additional countries and regions. 

Researchers and public health experts are doing incredible work to respond to the pandemic. We hope this dataset will be useful in their work towards stopping the spread of COVID-19.

Source: Search


Using Machine Learning to Detect Deficient Coverage in Colonoscopy Screenings

Colorectal cancer (CRC) is a global health problem and the second deadliest cancer in the United States, resulting in an estimated 900K deaths per year. While deadly, CRC can be prevented by removing small precancerous lesions in the colon, called polyps, before they become cancerous. In fact, it is estimated that a 1% increase in the adenoma detection rate (ADR, defined as the fraction of procedures in which a physician discovers at least one polyp) can lead to a 6% decrease in the rate of interval CRCs (a CRC that is diagnosed within 60 months of a negative colonoscopy).

Colonoscopy is considered the gold standard procedure for the detection and removal of polyps. Unfortunately, the literature indicates that endoscopists miss on average 22%-28% of polyps during colonoscopies; furthermore, 20% to 24% of polyps that have the potential to become cancerous (adenomas) are missed. Two major factors that may cause an endoscopist to miss a polyp are (1) the polyp appears in the field of view, but the endoscopist misses it, perhaps due to its small size or flat shape; and (2) the polyp does not appear in the field of view, as the endoscopist has not fully covered the relevant area during the procedure.

In “Detecting Deficient Coverage in Colonoscopies”, we introduce the Colonoscopy Coverage Deficiency via Depth algorithm, or C2D2, a machine learning-based approach to improving colonoscopy coverage. The C2D2 algorithm performs a local 3D reconstruction of the colon as images are captured during the procedure, and on that basis, identifies which areas of the colon were covered and which remained outside of the field of view. C2D2 can then indicate in real time whether a particular area of the colon has suffered from deficient coverage so the endoscopist can return to that area. Our work proposes a novel approach to compute coverage in real time, for which 3D reconstruction is done using a calibration-free, unsupervised learning method, and evaluate it in a large scale way.

The C2D2 Algorithm
When considering colon coverage, it is important to estimate the coverage fraction — what percentage of the relevant regions were covered by a complete procedure. While a retrospective analysis is useful for the physician and could provide general guidance for future procedures, it is more useful to have real-time estimation of coverage fraction, on a segment by segment basis, i.e. knowledge of what fraction of the current segment has been covered while traversing the colon. The helpfulness of such functionality is clear: during the procedure itself, a physician may be alerted to segments with deficient coverage, and can immediately return to review these areas. Higher coverage will result in a higher proportion of polyps being seen.

The C2D2 algorithm is designed to compute such a segment-by-segment coverage in two phases: computing depth maps for each frame of the colonoscopy video, followed by computation of coverage based on these depth maps.

C2D2 computes a depth image from a single RGB image. Then, based on the computed depth images for a video sequence, C2D2 calculates local coverage, so it can detect where the coverage has been deficient and a second look is required.

Depth map creation consists of both depth estimation as well as pose estimation — the localization of where the endoscope is in space, as well as the direction it is pointing. In addition to the detection of deficient coverage, depth and pose estimation are useful for a variety of other interesting tasks. For example, depth can be used for improved detection of flat polyps, while pose estimation can be used for relocalizing areas of the colon (including polyps) that the endoscopist wishes to revisit, and both together can be used for visualization and navigation.

Top row: RGB image, from which the depth is computed. Bottom row: Depth image as computed by C2D2. Yellow is deeper, blue is shallower. Note that the “tunnel” structure is captured, as well as the Haustral ridges.

In order to compute coverage fractions from these depth maps, we trained C2D2 on two sources of data: synthetic sequences and real sequences. We generated the synthetic videos using a graphical model of a colon. For each synthetic video, ground truth coverage is available in the form of a number between 0 (completely uncovered) and 1 (completely covered). For real sequences, we analyzed de-identified colonoscopy videos, for which ground truth coverage is unavailable.

Performance on Synthetic Videos
When using synthetic videos, the availability of ground truth coverage enables the direct measurement of C2D2’s performance. We quantify this using the mean absolute error (MAE), which indicates how much the algorithm’s prediction differs, on average, from the ground truth. We find that C2D2’s MAE = 0.075; meaning that, on average, the prediction of C2D2 is within 7.5% of the ground truth. By contrast, a group of physicians given the same task achieved MAE = 0.177, i.e., within 17.7% of the ground truth. Thus, the C2D2 attained an accuracy rate 2.4 times higher on synthetic sequences.

Performance on Real Videos
Of course, what matters most is performance on videos of real colonoscopies. The challenge in this case is the absence of ground truth labelling: we don’t know what the actual coverage is. Additionally, one cannot use labels provided by experts directly as they are not always accurate, due to the challenges described earlier. However, C2D2 can still perform inference on real colonoscopy videos. Indeed, the learning pipeline is designed to perform equally well on synthetic and real colonoscopy videos.

To verify performance on real sequences, we used a variant of a technique common in the generative modelling literature, which involves providing video sequences to human experts along with C2D2’s coverage scores for those sequences. We then ask the experts to assess whether C2D2’s score is correct. The idea is that while it is difficult for experts to assign a score directly, the task of verifying a given score is considerably easier. (This is similar to the fact that verifying a proposed solution to an algorithmic problem is generally much easier than computing that solution.) Using this methodology, experts verified C2D2’s score 93% of the time. And in a more qualitative sense, C2D2’s output seems to pass the “eyeball test”, see the figure below.

Coverage on real colonoscopy sequences. Top row: Frames from a well covered sequence — the entire “tunnel” down the lumen may be seen; C2D2 coverage = 0.931. Middle row: A partially covered sequence — the bottom may be seen, but the top is not as visible; C2D2 coverage = 0.427. Bottom row: A poorly covered sequence, much of what is seen is the wall; C2D2 coverage = 0.227.

Next steps
By alerting physicians to missed regions of the colon wall, C2D2 promises to lead to the discovery of more adenomas, thereby increasing the ADR and concomitantly decreasing the rate of interval CRC. This would be of tremendous benefit to patients.

In addition to this work that addresses colonoscopy coverage, we are concurrently conducting research to improve polyp detection by combining C2D2 with an automatic, real-time polyp detection algorithm. This study adds to the mounting evidence that physicians may use machine learning methods to augment their efforts, especially during procedures, to improve the quality of care for patients.

Acknowledgements
This research was conducted by Daniel Freedman, Yochai Blau, Liran Katzir, Amit Aides, Ilan Shimshoni, Danny Veikherman, Tomer Golany, Ariel Gordon, Greg Corrado, Yossi Matias, and Ehud Rivlin, with support from Verily. We would like to thank all of our team members and collaborators who worked on this project with us, including: Nadav Rabani, Chen Barshai, Nia Stoykova, David Ben-Shimol, Jesse Lachter, and Ori Segol, 3D-Systems and many others. We'd also like to thank Yossi Matias for support and guidance. The research was conducted by teams from Google Health and Google Research, Israel.

Source: Google AI Blog