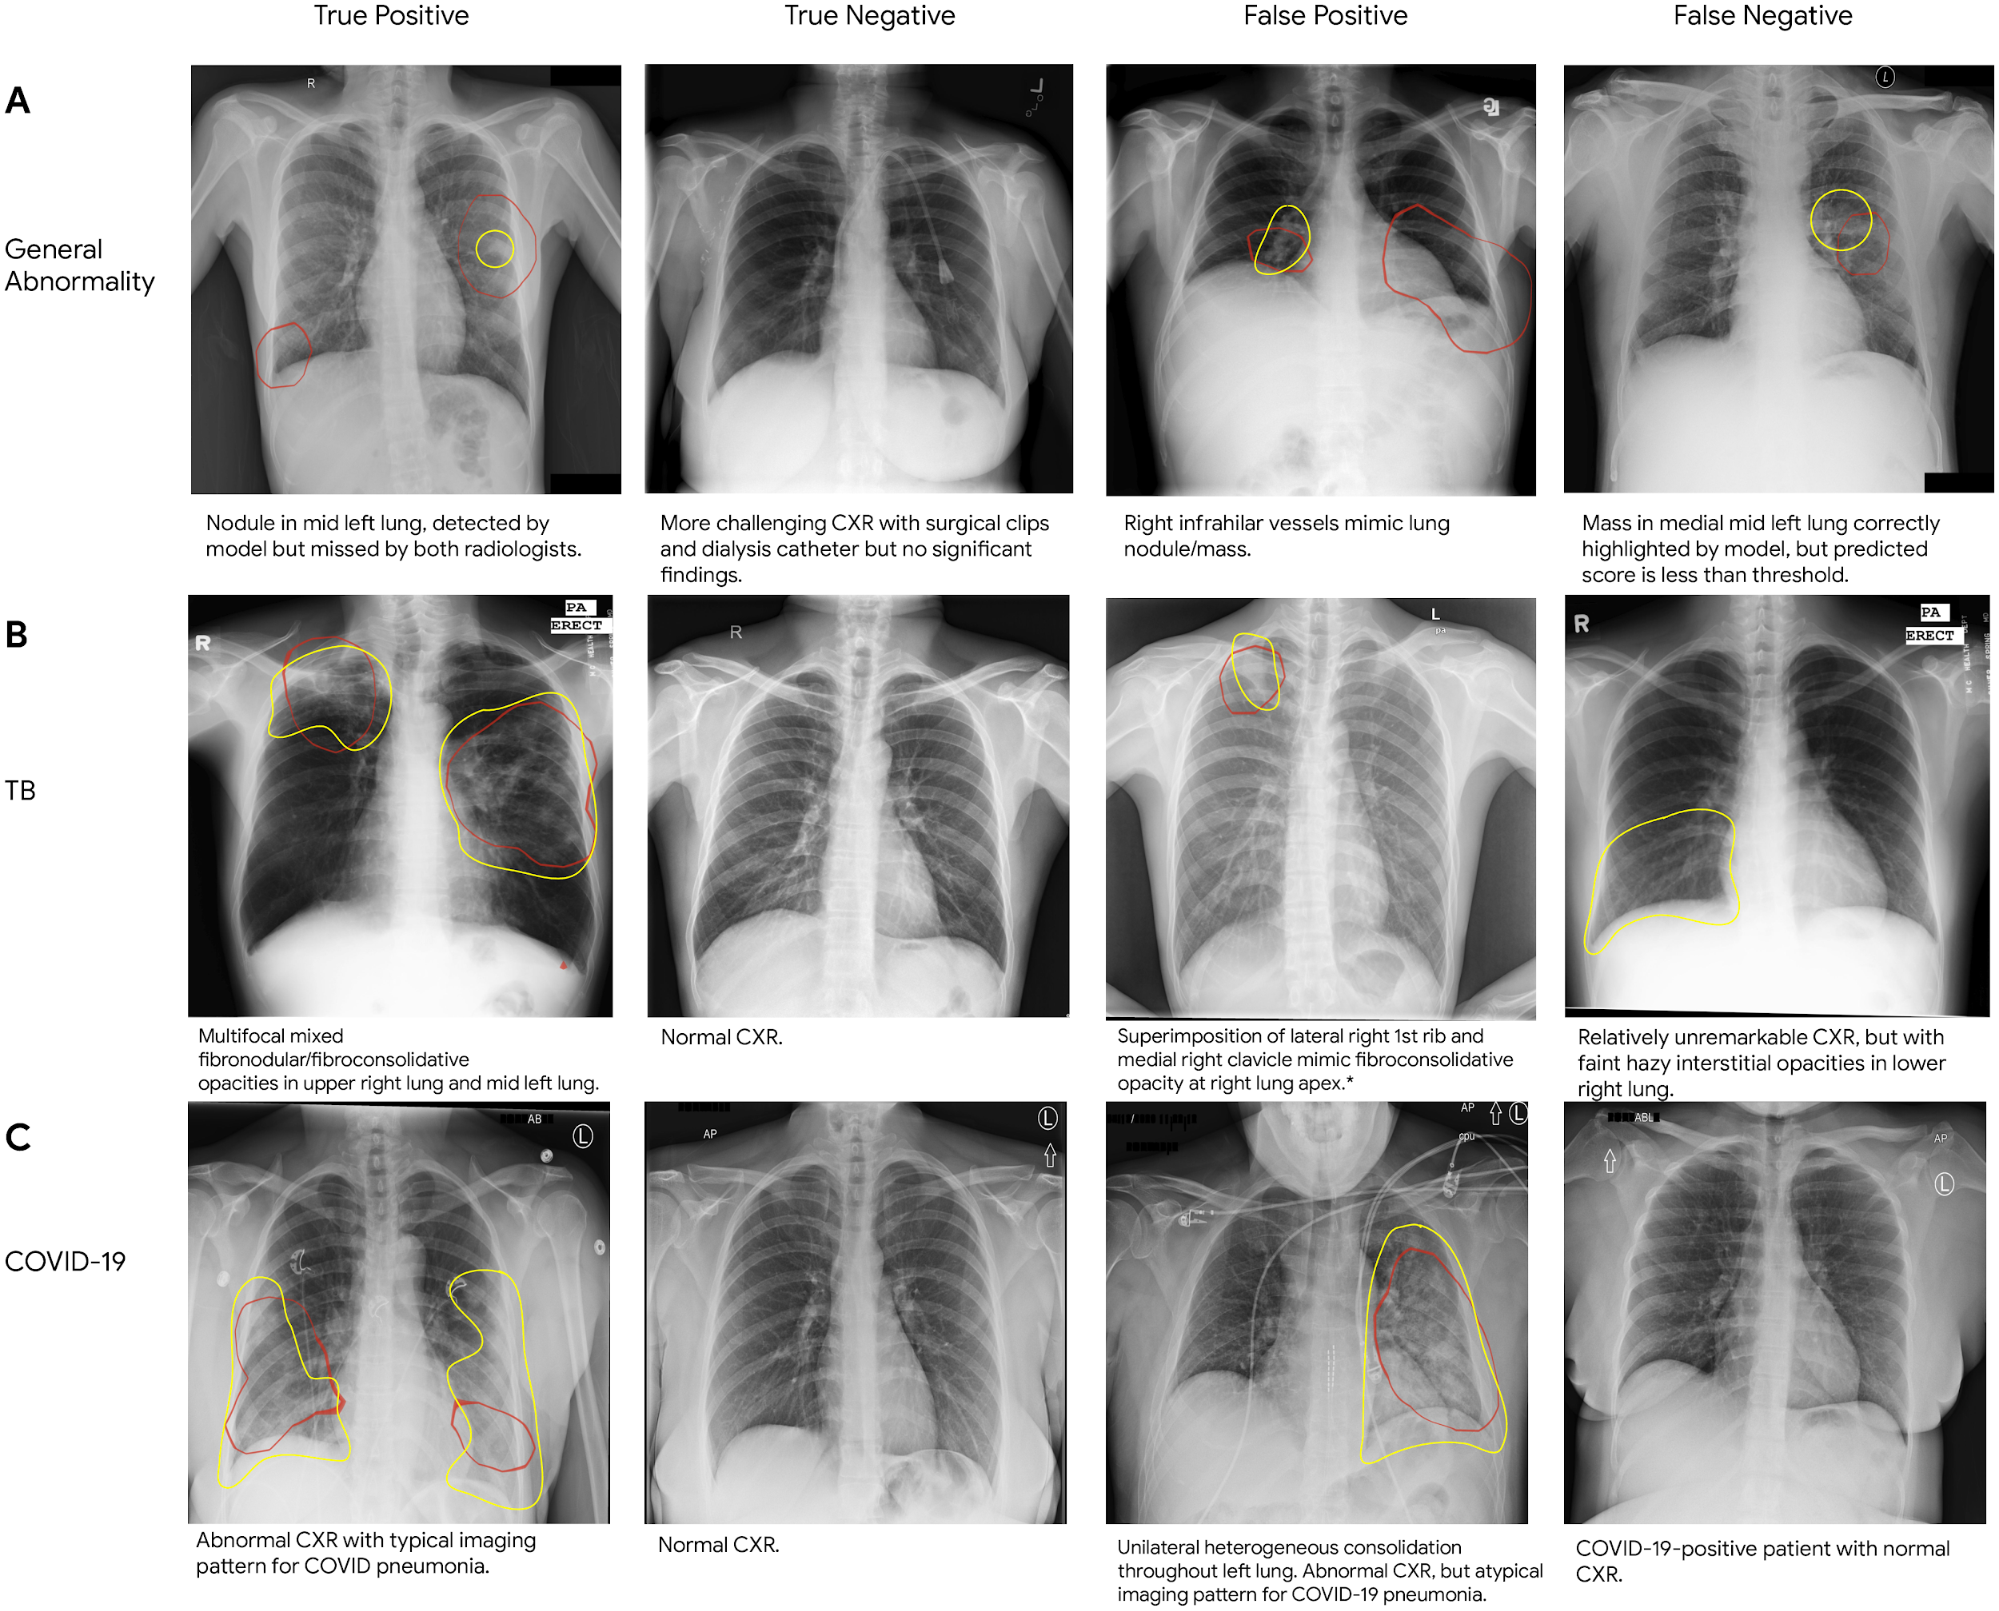
Tag Archives: Health

Improved Detection of Elusive Polyps via Machine Learning

With the increasing ability to consistently and accurately process large amounts of data, particularly visual data, computer-aided diagnostic systems are more frequently being used to assist physicians in their work. This, in turn, can lead to meaningful improvements in health care. An example of where this could be especially useful is in the diagnosis and treatment of colorectal cancer (CRC), which is especially deadly and results in over 900K deaths per year, globally. CRC originates in small pre-cancerous lesions in the colon, called polyps, the identification and removal of which is very successful in preventing CRC-related deaths.

The standard procedure used by gastroenterologists (GIs) to detect and remove polyps is the colonoscopy, and about 19 million such procedures are performed annually in the US alone. During a colonoscopy, the gastroenterologist uses a camera-containing probe to check the intestine for pre-cancerous polyps and early signs of cancer, and removes tissue that looks worrisome. However, complicating factors, such as incomplete detection (in which the polyp appears within the field of view, but is missed by the GI, perhaps due to its size or shape) and incomplete exploration (in which the polyp does not appear in the camera’s field of view), can lead to a high fraction of missed polyps. In fact, studies suggest that 22%–28% of polyps are missed during colonoscopies, of which 20%–24% have the potential to become cancerous (adenomas).

Today, we are sharing progress made in using machine learning (ML) to help GIs fight colorectal cancer by making colonoscopies more effective. In “Detection of Elusive Polyps via a Large Scale AI System”, we present an ML model designed to combat the problem of incomplete detection by helping the GI detect polyps that are within the field of view. This work adds to our previously published work that maximizes the coverage of the colon during the colonoscopy by flagging for GI follow-up areas that may have been missed. Using clinical studies, we show that these systems significantly improve polyp detection rates.

Incomplete Exploration
To help the GI detect polyps that are outside the field of view, we previously developed an ML system that reduces the rate of incomplete exploration by estimating the fractions of covered and non-covered regions of a colon during a colonoscopy. This earlier work uses computer vision and geometry in a technique we call colonoscopy coverage deficiency via depth, to compute segment-by-segment coverage for the colon. It does so in two phases: first computing depth maps for each frame of the colonoscopy video, and then using these depth maps to compute the coverage in real time.

The ML system computes a depth image (middle) from a single RGB image (left). Then, based on the computation of depth images for a video sequence, it calculates local coverage (right), and detects where the coverage has been deficient and a second look is required (blue color indicates observed segments where red indicates uncovered ones). You can learn more about this work in our previous blog post.

This segment-by-segment work yields the ability to estimate what fraction of the current segment has been covered. The helpfulness of such functionality is clear: during the procedure itself, a physician may be alerted to segments with deficient coverage, and can immediately return to review these areas, potentially reducing the rates of missed polyps due to incomplete exploration.

Incomplete Detection
In our most recent paper, we look into the problem of incomplete detection. We describe an ML model that aids a GI in detecting polyps that are within the field of view, so as to reduce the rate of incomplete detection. We developed a system that is based on convolutional neural networks (CNN) with an architecture that combines temporal logic with a single frame detector, resulting in more accurate detection.

This new system has two principal advantages. The first is that the system improves detection performance by reducing the number of false negatives detections of elusive polyps, those polyps that are particularly difficult for GIs to detect. The second advantage is the very low false positive rate of the system. This low false positive rate makes these systems more likely to be adopted in the clinic.

Examples of the variety of polyps detected by the ML system.

We trained the system on 3600 procedures (86M video frames) and tested it on 1400 procedures (33M frames). All the videos and metadata were de-identified. The system detected 97% of the polyps (i.e., it yielded 97% sensitivity) at 4.6 false alarms per procedure, which is a substantial improvement over previously published results. Of the false alarms, follow-up review showed that some were, in fact, valid polyp detections, indicating that the system was able to detect polyps that were missed by the performing endoscopist and by those who annotated the data. The performance of the system on these elusive polyps suggests its generalizability in that the system has learned to detect examples that were initially missed by all who viewed the procedure.

We evaluated the system performance on polyps that are in the field of view for less than five seconds, which makes them more difficult for the GI to detect, and for which models typically have much lower sensitivity. In this case the system attained a sensitivity that is about three times that of the sensitivity that the original procedure achieved. When the polyps were present in the field of view for less than 2 seconds, the difference was even more stark — the system exhibited a 4x improvement in sensitivity.

It is also interesting to note that the system is fairly insensitive to the choice of neural network architecture. We used two architectures: RetinaNet and  LSTM-SSD. RetinaNet is a leading technique for object detection on static images (used for video by applying it to frames in a consecutive fashion). It is one of the top performers on a variety of benchmarks, given a fixed computational budget, and is known for balancing speed of computation with accuracy. LSTM-SSD is a true video object detection architecture, which can explicitly account for the temporal character of the video (e.g., temporal consistency of detections, ability to deal with blur and fast motion, etc.). It is known for being robust and very computationally lightweight and can therefore run on less expensive processors. Comparable results were also obtained on the much heavier Faster R-CNN architecture. The fact that results are similar across different architectures implies that one can choose the network meeting the available hardware specifications.

Prospective Clinical Research Study
As part of the research reported in our detection paper we ran a clinical validation on 100 procedures in collaboration with Shaare Zedek Medical Center in Jerusalem, where our system was used in real time to help GIs. The system helped detect an average of one polyp per procedure that would have otherwise been missed by the GI performing the procedure, while not missing any of the polyps detected by the GIs, and with 3.8 false alarms per procedure. The feedback from the GIs was consistently positive.

We are encouraged by the potential helpfulness of this system for improving polyp detection, and we look forward to working together with the doctors in the procedure room to further validate this research.

Acknowledgements
The research was conducted by teams from Google Health and Google Research, Israel with support from Verily Life Sciences, and in collaboration with Shaare Zedek Medical Center. Verily is advancing this research via a newly established center in Israel, led by Ehud Rivlin. This research was conducted by Danny Veikherman, Tomer Golany, Dan M. Livovsky, Amit Aides, Valentin Dashinsky, Nadav Rabani, David Ben Shimol, Yochai Blau, Liran Katzir, Ilan Shimshoni, Yun Liu, Ori Segol, Eran Goldin, Greg Corrado, Jesse Lachter, Yossi Matias, Ehud Rivlin, and Daniel Freedman. Our appreciation also goes to several institutions and GIs who provided advice along the way and tested our system prototype. We would like to thank all of our team members and collaborators who worked on this project with us, including: Chen Barshai, Nia Stoykova, and many others.

Source: Google AI Blog


Mental health trends & how they affect communities of color

Editor’s note: July is Bebe Moore Campbell National Minority Mental Health Awareness Month. To bring awareness to mental health, Asad Abdullah II — a Google engineer, trauma-informed meditation instructor and mental health advocate — chatted with licensed psychologist Dr. Ghynecee Temple about mental health trends, how they affect communities of color and ways to cope.  

Search interest for anxiety reached a record high across the U.S. this year. As we begin to reintegrate into life after an extended period of social distancing and self-isolation, people across the country are looking for ways to cope. 


Marginalized communities in particular have been disproportionately affected and continue to face challenges and stigmas when it comes to accessing resources and talking openly about mental wellbeing. According to Mental Health First Aid, 48% of White Americans with mental illness received mental health services, compared to 31% of Black Americans and Latino/Hispanic Americans and 22% of AAPI populations.


Curious to talk more about the mental health trends we’re seeing for marginalized groups, I sat down with Dr. Ghynecee Temple of the Ladipo Group, a Black-owned company dedicated to the emotional wellness of Black and African-American people and communities. Dr. Temple sifted through these trends, discussed lingering mental health stigmas and shared ways we can take care of our wellbeing and support others. 

Search interest for “why do I feel anxious for no reason” spiked 400% in 2021 U.S. compared to 2020. How is this affecting communities of color specifically? 


There's always a reason you feel anxious, you just may not have uncovered it yet. For communities of color, both before and during the pandemic, there are unique experiences that affect their mental wellbeing. You may deal with navigating daily discrimination, feel a lack of autonomy being in a system that suppresses or grapple with intersecting identities.


Fast forward to COVID-19, and you have a massive loss of control. You can’t see, smell or touch it, but it’s ever-looming and ever-present. So of course you’re going to feel anxious.


Still in some communities, getting mental health help is stigmatized. What I tell people is: Your brain is your control center for your entire body. If your thoughts are off,  it's going to impact every facet of your functioning. And if something is off and not feeling right, why wouldn't we get help? 


As people prepare to return to work and school, what would you say to those who are experiencing uneasiness or anxiety? 


Your feelings about the transition are valid. Some people are excited to socialize again,  others are relieved as home may not always be the safest place for them, and still others are nervous about interacting with people outside of their bubble. Don’t judge your feelings, and accept that you’re going to experience different moods each day.


What are some practical steps we can take to manage those feelings?


There’s still a lot of uncertainty, but part of what we can do to weather that storm is to be present. Instead of thinking about what’s happening in two months or 12 months, ask yourself how you are feeling right now and what you need at this moment. Set boundaries and goals for yourself. For example, if you feel safer wearing a mask, continue to do so even if it’s not required. If you’re struggling with social anxiety, set a goal to socialize for 15 minutes at lunch before allowing yourself to go back to your desk to decompress. Exposure is one of the most helpful things to improve social anxiety. Start small and challenge yourself to build upon it every day.


A lot of people are turning to therapy, and search interest for “black therapists” spiked last summer. How can people within the BIPOC community go about finding a therapist?


A quick Google search will show you resources near you — and even a self-assessment to help you learn more about anxiety. When finding a therapist, many therapists will have an online bio where they can talk about their own identities that feel salient or what communities they’ve worked with before — start there. Then ask for a consultation and evaluate them for yourself. I love when new clients ask me questions! You don’t have to pick the first therapist you find. Remember that you’re shopping and want to feel comfortable and safe.


I’m a Blue Dot Listener at Google. Our aim is to de-stigmatize mental health conversations in the workplace through allyship, peer support and education. I’d love to know from you, how we can be better mental health allies at work?


As allies, we need to check our own beliefs and biases, and embrace a continuous posture of learning and unlearning. I’d also encourage people to know their limits. There are often instances where we try to support people, but it’s out of our scope. Know when to connect people to the right resources.


You’ve been in the mental health space for almost a decade, what makes you hopeful for mental wellbeing for historically underrepresented groups?


The fact that people are even searching for mental health topics is encouraging. It makes me hopeful that people are willing to learn and unlearn things. 


Applying Advanced Speech Enhancement in Cochlear Implants

For the ~466 million people in the world who are deaf or hard of hearing, the lack of easy access to accessibility services can be a barrier to participating in spoken conversations encountered daily. While hearing aids can help alleviate this, simply amplifying sound is insufficient for many. One additional option that may be available is the cochlear implant (CI), which is an electronic device that is surgically inserted into a part of the inner ear, called the cochlea, and stimulates the auditory nerve electrically via external sound processors. While many individuals with these cochlear implants can learn to interpret these electrical stimulations as audible speech, the listening experience can be quite varied and particularly challenging in noisy environments.

Modern cochlear implants drive electrodes with pulsatile signals (i.e., discrete stimulation pulses) that are computed by external sound processors. The main challenge still facing the CI field is how to best process sounds — to convert sounds to pulses on electrodes — in a way that makes them more intelligible to users. Recently, to stimulate progress on this problem, scientists in industry and academia organized a CI Hackathon to open the problem up to a wider range of ideas.

In this post, we share exploratory research demonstrating that a speech enhancement preprocessor — specifically, a noise suppressor — can be used at the input of a CI’s processor to enhance users’ understanding of speech in noisy environments. We also discuss how we built on this work in our entry for the CI Hackathon and how we will continue developing this work.

Improving CIs with Noise Suppression
In 2019, a small internal project demonstrated the benefits of noise suppression at the input of a CI’s processor. In this project, participants listened to 60 pre-recorded and pre-processed audio samples and ranked them by their listening comfort. CI users listened to the audio using their devices' existing strategy for generating electrical pulses.

Audio without background noise
   
Audio with background noise
   
Audio with background noise + noise suppression

Background audio clip from “IMG_0991.MOV” by Kenny MacCarthy, license: CC-BY 2.0.

As shown below, both listening comfort and intelligibility usually increased, sometimes dramatically, when speech with noise (the lightest bar) was processed with noise suppression.

CI users in an early research study have improved listening comfort — qualitatively scored from "very poor" (0.0) to "OK" (0.5) to "very good" (1.0) — and speech intelligibility (i.e., the fraction of words in a sentence correctly transcribed) when trying to listen to noisy audio samples of speech with noise suppression applied.

For the CI Hackathon, we built on the project above, continuing to leverage our use of a noise suppressor while additionally exploring an approach to compute the pulses too

Overview of the Processing Approach
The hackathon considered a CI with 16 electrodes. Our approach decomposes the audio into 16 overlapping frequency bands, corresponding to the positions of the electrodes in the cochlea. Next, because the dynamic range of sound easily spans multiple orders of magnitude more than what we expect the electrodes to represent, we aggressively compress the dynamic range of the signal by applying "per-channel energy normalization" (PCEN). Finally, the range-compressed signals are used to create the electrodogram (i.e., what the CI displays on the electrodes).

In addition, the hackathon required a submission be evaluated in multiple audio categories, including music, which is an important but notoriously difficult category of sounds for CI users to enjoy. However, the speech enhancement network was trained to suppress non-speech sounds, including both noise and music, so we needed to take extra measures to avoid suppressing instrumental music (note that in general, music suppression might be preferred by some users in certain contexts). To do this, we created a “mix” of the original audio with the noise-suppressed audio so that enough of the music would pass through to remain audible. We varied in real-time the fraction of original audio mixed from 0% to 40% (0% if all of the input is estimated as speech, up to 40% as more of the input is estimated as non-speech) based on the estimate from the open-source YAMNet classifier on every ~1 second window of audio of whether the input is speech or non-speech.

The Conv-TasNet Speech Enhancement Model
To implement a speech enhancement module that suppresses non-speech sounds, such as noise and music, we use the Conv-TasNet model, which can separate different kinds of sounds. To start, the raw audio waveforms are transformed and processed into a form that can be used by a neural network. The model transforms short, 2.5 millisecond frames of input audio with a learnable analysis transform to generate features optimized for sound separation. The network then produces two “masks” from those features: one mask for speech and one mask for noise. These masks indicate the degree to which each feature corresponds to either speech or noise. Separated speech and noise are reconstructed back to the audio domain by multiplying the masks with the analysis features, applying a synthesis transform back to audio-domain frames, and stitching the resulting short frames together. As a final step, the speech and noise estimates are processed by a mixture consistency layer, which improves the quality of the estimated waveforms by ensuring that they sum up to the original input mixture waveform.

Block diagram of the speech enhancement system, which is based on Conv-TasNet.

The model is both causal and low latency: for each 2.5 milliseconds of input audio, the model produces estimates of separated speech and noise, and thus could be used in real-time. For the hackathon, to demonstrate what could be possible with increased compute power in future hardware, we chose to use a model variant with 2.9 million parameters. This model size is too large to be practically implemented in a CI today, but demonstrates what kind of performance would be possible with more capable hardware in the future.

Listening to the Results
As we optimized our models and overall solution, we used the hackathon-provided vocoder (which required a fixed temporal spacing of electrical pulses) to produce audio simulating what CI users might perceive. We then conducted blind A-B listening tests as typical hearing users.

Listening to the vocoder simulations below, the speech in the reconstructed sounds — from the vocoder processing the electrodograms — is reasonably intelligible when the input sound doesn't contain too much background noise, however there is still room to improve the clarity of the speech. Our submission performed well in the speech-in-noise category and achieved second place overall.

Simulated audio with fixed temporal spacing
Vocoder simulation of what CI users might perceive from audio from an electrodogram with fixed temporal spacing, with background noise and noise suppression applied.

A bottleneck on quality is that the fixed temporal spacing of stimulation pulses sacrifices fine-time structure in the audio. A change to the processing to produce pulses timed to peaks in the filtered sound waveforms captures more information about the pitch and structure of sound than is conventionally represented in implant stimulation patterns.

Simulated audio with adaptive spacing and fine time structure
Vocoder simulation, using the same vocoder as above, but on an electrodogram from the modified processing that synchronizes stimulation pulses to peaks of the sound waveform.

It's important to note that this second vocoder output is overly optimistic about how well it might sound to a real CI user. For instance, the simple vocoder used here does not model how current spread in the cochlea blurs the stimulus, making it harder to resolve different frequencies. But this at least suggests that preserving fine-time structure is valuable and that the electrodogram itself is not the bottleneck.

Ideally, all processing approaches would be evaluated by a broad range of CI users, with the electrodograms implemented directly on their CIs rather than relying upon vocoder simulations.

Conclusion and a Call to Collaborate
We are planning to follow up on this experience in two main directions. First, we plan to explore the application of noise suppression to other hearing-accessibility modalities, including hearing aids, transcription, and vibrotactile sensory substitution. Second, we'll take a deeper dive into the creation of electrodogram patterns for cochlear implants, exploiting fine temporal structure that is not accommodated in the usual CIS (continous interleaved sampling) patterns that are standard in the industry. According to Louizou: “It remains a puzzle how some single-channel patients can perform so well given the limited spectral information they receive''. Therefore, using fine temporal structure might be a critical step towards achieving an improved CI experience.

Google is committed to building technology with and for people with disabilities. If you are interested in collaborating to improve the state of the art in cochlear implants (or hearing aids), please reach out to [email protected].

Acknowledgements
We would like to thank the Cochlear Impact hackathon organizers for giving us this opportunity and partnering with us. The participating team within Google is Samuel J. Yang, Scott Wisdom, Pascal Getreuer, Chet Gnegy, Mihajlo Velimirović, Sagar Savla, and Richard F. Lyon with guidance from Dan Ellis and Manoj Plakal.

Source: Google AI Blog


Multi-task Prediction of Organ Dysfunction in ICUs

The intensive care unit (ICU) of a hospital looks after the most medically vulnerable patients, many of whom require organ support, such as mechanical ventilation or dialysis. While always critical, the demand on ICU services during the COVID-19 pandemic has further underscored the importance of data-driven decision-making in healthcare. Furthermore, the ability to accurately predict the clinical outcomes of ICU patients has the potential to guide therapy and may inform decisions about most effective care, including staffing and triage support.

Applying machine learning (ML) to electronic health records (EHRs) has shown promise in predicting clinical outcomes. However, many of these ML models are based on single-task learning (ST), where the models are trained only to predict a specific adverse event, such as an organ dysfunction or the need for a life-support intervention. Of greater benefit would be to train multi-task models, which take into account a variety of competing risks along with the interdependencies between organ systems that factor into patient outcomes in a realistic setting.

In “Multi-task prediction of organ dysfunction in the ICU using sequential sub-network routing”, we propose a multi-task learning (MTL) architecture, called Sequential Sub-Network Routing (SeqSNR), that better captures the complexity of a realistic setting. Inspired by a clinician's holistic approach to diagnosing problems, SeqSNR is designed to use flexible parameter sharing and routing to find related tasks and encourage cross-learning between them. We successfully applied SeqSNR to the task of continuous adverse event prediction in an ICU setting and showed advantages over single-task and naïve multi-tasking, especially in low training data scenarios.

Data and Labels
In this study, we used the freely available, open access, de-identified MIMIC-III EHR dataset, which includes a patient cohort consisting of 36,498 adults across 52,038 critical care admissions at the Beth Israel Deaconess Medical Center between 2001 and 2012. Similar to our previous studies, we employed a version of the MIMIC-III dataset that was mapped to the Fast Healthcare Interoperability Resource (FHIR) standard and used a comprehensive set of features, including a sequence of vital signs, laboratory results, past medications, procedures, diagnoses, and more.

The MIMIC-III database contains multi-modal recordings from ICU patients. Unlike most datasets in ML, the input and targets are often not explicitly defined and must be inferred from the data. So, using a combination of automated rule-based methods and clinical review, we defined a suite of diverse endpoints, including critical care interventions, specific organ dysfunctions, and overall patient outcomes.

The task given to the model was to predict the onset of a selection of adverse events within 24–48 hours for every hour after a patient’s admission into the ICU. The defined adverse events included acute kidney injury (AKI), continuous renal replacement therapy (CRRT) dialysis, administration of vasopressors and inotropes, mechanical ventilation (MV), mortality, and remaining length of stay (LoS).

The SeqSNR Algorithm
While multi-task learning captures the interdependencies between organ systems and balances competing risks, it can be challenging to implement successfully. In practice, jointly-trained tasks often impair one another, an effect called “negative transfer”. The intuition behind SeqSNR was that modular ‘sub-networks’ would mitigate this issue by automatically optimizing how information is shared across multiple tasks.

SeqSNR is a time series adaptation of the SNR architecture and is a combination of a deep embedding layer followed by stacked recurrent neural network (RNN) layers. Modularisation is achieved by splitting both the embedding layer and the RNN stack into multiple modules connected by routing variables that are learned during the training phase. The routing connections are always created between blocks in one layer and the next. This approach minimizes negative transfer by ensuring that data of low relevance to a particular task layer is filtered out. In essence, this means that each task utilizes a different path through the model.

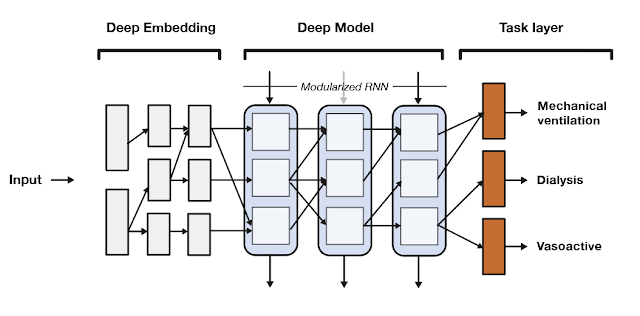
A high-level overview of the SeqSNR architecture.

Findings
SeqSNR shows a modest improvement in discriminative performance overall relative to single-task and naïve multitasking. However, it's performance improvement is more significant in scenarios with few training labels.

Because the prevalence of different outcomes varied widely in the dataset (e.g. ~38% of patients had MV, but CRRT dialysis is present for only ~3%), many accuracy metrics are not suitable. Instead, we report the area under the precision recall curve (AU PRC), which is more reliable given imbalanced data. Moreover, we performed the Wilcoxon Signed Rank Tests to draw statistically significant conclusions for pairwise comparisons of ST learning, shared-bottom (SB) multi-task learning (i.e., naïve multi-task learning), and SeqSNR across bootstrapped samples from the held-out test set. The performance differences between the three architectures were modest, but SeqSNR outperformed both ST and SB in four out of six tasks (p-values are reported in the paper).

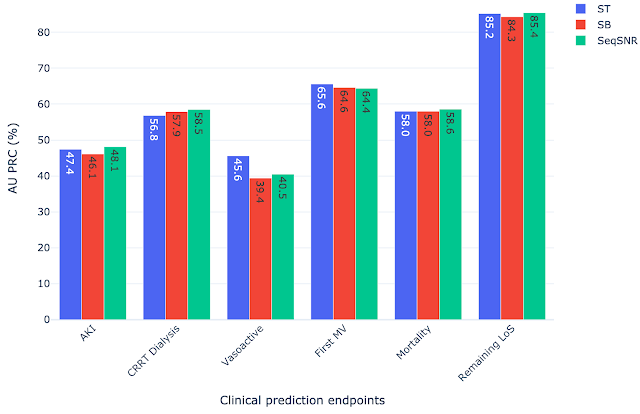
Comparison of single task (ST), shared bottom (SB) and SeqSNR performance on the MIMIC-III dataset.

Label Efficiency
We hypothesized that multi-task learning could assist in low-data scenarios by using easy-to-label auxiliary tasks to boost the performance of the main tasks. We formulated prediction tasks with only a portion of the training labels available for the primary prediction task, but kept the entire dataset for the “helper tasks”. The latter are chosen because they are reliably encoded in the EHR and are straightforward to timestamp. An example of such a helper task is length of stay, since the start and end of admissions are accurately timestamped in MIMIC-III. On the other hand, the start and end of mechanical ventilation events are not reliably timestamped. So, we defined a set of rules based on expert-defined heuristics to determine the ventilation times using multiple sources of mechanical ventilator–related settings along with physiological measurements in the EHR dataset that are indicative of MV.

The development of these rules for a new clinical endpoint was time-consuming and involved manual review of the dataset by experts. The difficulty in exhaustively labeling the dataset led us to test the model performance with only 1–10% of the data labeled, which resulted in a decline in model performance. The “helper tasks” are useful in this scenario since they are 100% labeled and can be used with the primary tasks (1–10% labeled) to jointly train the multi-task model for improved overall performance.

We chose AKI, mechanical ventilation, CRRT Dialysis, and vasoactive medications as primary endpoints using 1%, 5%, and 10% of the training labels, along with 100% of labels for the helper tasks — labs and vitals, mortality, and LoS. Performance of both ST and SeqSNR decreased as the percentage of labels for the primary endpoint was reduced, but SeqSNR outperformed ST across all tasks and all training data reduction percentages, with a statistically significant boost in performance for all cases.

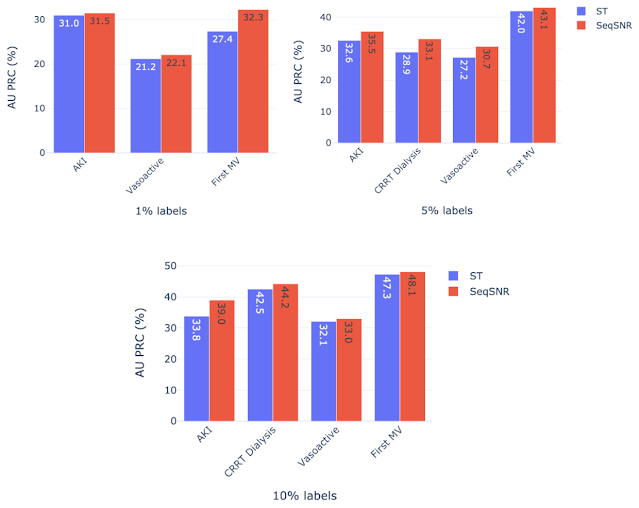
Label efficiency results showing the discriminative performance when the training dataset for the primary endpoint is reduced to 1%, 5% and 10% while the helper tasks have access to all training labels.

This is a useful finding, given the difficulties of annotating endpoint labels in EHR datasets, which frequently necessitates human evaluation by doctors. The ability to use numerous endpoints, some of which may be easier to label (like duration of stay or mortality), could lessen the need for manual curation on more difficult endpoints that are annotated differently (like mechanical ventilation).

Subgroup Performance
While the version of the MIMIC-III dataset used contained labels for gender and age, it did not contain information on race and the information on ethnicity was limited. We computed the performance of all selected models across age and gender subgroups. We observed that in the scenarios with few instances in the dataset, the MTL models (both SB models and SeqSNR) often outperform ST. Even though there are exceptions, on average all models seem to be relatively balanced across age and gender subgroups. We invite the reader to refer to the supplemental section of our paper for a detailed performance breakdown.

Next Steps
This work is a proof of concept for SeqSNR on a set of canonical EHR prediction tasks. The code for this architecture is publicly available here. And will hopefully stimulate further research in EHR multi-tasking and other deep learning architectures inspired by clinical reasoning.

In future, it will be important to evaluate the performance of SeqSNR on different combinations of tasks, different time horizons and different datasets. One other area of potential growth in this project is to expand subgroup analysis by including datasets with additional population information, race, ethnicity, etc. Another area we are exploring is expanding subgroup analysis by including datasets with additional population information, such as race, ethnicity, etc. We also emphasize that these are prototype models designed to showcase methodologies, and more rigorous evaluation would be needed to bring these tools into deployment.

Acknowledgements
This work involved collaborative efforts from a multidisciplinary team of researchers, software engineers, clinicians, and cross-functional contributors. We thank our co-authors: Eric Loreaux, Anne Mottram, Ivan Protsyuk, Natalie Harris, Sebastien Baur, Yuan Xue, Jessica Schrouff, Ali Connell, Alan Karthikesalingam, Martin Seneviratne from Google, Nenad Tomasev from Deepmind, and Hugh Montgomery from University College London. We also thank Zhe Zhao from Google Research and Kathryn Rough, Cian Hughes, Megumi Morigami and Doris Wong from Google Health for their input and review, and the MIMIC team for curating this open access dataset for the research community.

Source: Google AI Blog


Improving Genomic Discovery with Machine Learning

Each person’s genome, which collectively encodes the biochemical machinery they are born with, is composed of over 3 billion letters of DNA. However, only a small subset of the genome (~4-5 million positions) varies between two people. Nonetheless, each person’s unique genome interacts with the environment they experience to determine the majority of their health outcomes. A key method of understanding the relationship between genetic variants and traits is a genome-wide association study (GWAS), in which each genetic variant present in a cohort is individually examined for correlation with the trait of interest. GWAS results can be used to identify and prioritize potential therapeutic targets by identifying genes that are strongly associated with a disease of interest, and can also be used to build a polygenic risk score (PRS) to predict disease predisposition based on the combined influence of variants present in an individual. However, while accurate measurement of traits in an individual (called phenotyping) is essential to GWAS, it often requires painstaking expert curation and/or subjective judgment calls.

In “Large-scale machine learning-based phenotyping significantly improves genomic discovery for optic nerve head morphology”, we demonstrate how using machine learning (ML) models to classify medical imaging data can be used to improve GWAS. We describe how models can be trained for phenotypes to generate trait predictions and how these predictions are used to identify novel genetic associations. We then show that the novel associations discovered improve PRS accuracy and, using glaucoma as an example, that the improvements for anatomical eye traits relate to human disease. We have released the model training code and detailed documentation for its use on our Genomics Research GitHub repository.

Identifying genetic variants associated with eye anatomical traits
Previous work has demonstrated that ML models can identify eye diseases, skin diseases, and abnormal mammogram results with accuracy approaching or exceeding state-of-the-art methods by domain experts. Because identifying disease is a subset of phenotyping, we reasoned that ML models could be broadly used to improve the speed and quality of phenotyping for GWAS.

To test this, we chose a model that uses a fundus image of the eye to accurately predict whether a patient should be referred for assessment for glaucoma. This model uses the fundus images to predict the diameters of the optic disc (the region where the optic nerve connects to the retina) and the optic cup (a whitish region in the center of the optic disc). The ratio of the diameters of these two anatomical features (called the vertical cup-to-disc ratio, or VCDR) correlates strongly with glaucoma risk.

A representative retinal fundus image showing the vertical cup-to-disc ratio, which is an important diagnostic measurement for glaucoma.

We applied this model to predict VCDR in all fundus images from individuals in the UK Biobank, which is the world’s largest dataset available to researchers worldwide for health-related research in the public interest, containing extensive phenotyping and genetic data for ~500,000 pseudonymized (the UK Biobank's standard for de-identification) individuals. We then performed GWAS in this dataset to identify genetic variants that are associated with the model-based predictions of VCDR.

Applying a VCDR prediction model trained on clinical data to generate predicted values for VCDR to enable discovery of genetic associations for the VCDR trait.

The ML-based GWAS identified 156 distinct genomic regions associated with VCDR. We compared these results to a VCDR GWAS conducted by another group on the same UK Biobank data, Craig et al. 2020, where experts had painstakingly labeled all images for VCDR. The ML-based GWAS replicates 62 of the 65 associations found in Craig et al., which indicates that the model accurately predicts VCDR in the UK Biobank images. Additionally, the ML-based GWAS discovered 93 novel associations.

Number of statistically significant GWAS associations discovered by exhaustive expert labeling approach (Craig et al., left), and by our ML-based approach (right), with shared associations in the middle.

The ML-based GWAS improves polygenic model predictions
To validate that the novel associations discovered in the ML-based GWAS are biologically relevant, we developed independent PRSes using the Craig et al. and ML-based GWAS results, and tested their ability to predict human-expert-labeled VCDR in a subset of UK Biobank as well as a fully independent cohort (EPIC-Norfolk). The PRS developed from the ML-based GWAS showed greater predictive ability than the PRS built from the expert labeling approach in both datasets, providing strong evidence that the novel associations discovered by the ML-based method influence VCDR biology, and suggesting that the improved phenotyping accuracy (i.e., more accurate VCDR measurement) of the model translates into a more powerful GWAS.

The correlation between a polygenic risk score (PRS) for VCDR generated from the ML-based approach and the exhaustive expert labeling approach (Craig et al.). In these plots, higher values on the y-axis indicate a greater correlation and therefore greater prediction from only the genetic data. [* — p ≤ 0.05; *** — p ≤ 0.001]

As a second validation, because we know that VCDR is strongly correlated with glaucoma, we also investigated whether the ML-based PRS was correlated with individuals who had either self-reported that they had glaucoma or had medical procedure codes suggestive of glaucoma or glaucoma treatment. We found that the PRS for VCDR determined using our model predictions were also predictive of the probability that an individual had indications of glaucoma. Individuals with a PRS 2.5 or more standard deviations higher than the mean were more than 3 times as likely to have glaucoma in this cohort. We also observed that the VCDR PRS from ML-based phenotypes was more predictive of glaucoma than the VCDR PRS produced from the extensive manual phenotyping.

The odds ratio of glaucoma (self-report or ICD code) stratified by the PRS for VCDR determined using the ML-based phenotypes (in standard deviations from the mean). In this plot, the y-axis shows the probability that the individual has glaucoma relative to the baseline rate (represented by the dashed line). The x-axis shows standard deviations from the mean for the PRS. Data are visualized as a standard box plot, which illustrates values for the mean (the orange line), first and third quartiles, and minimum and maximum.

Conclusion
We have shown that ML models can be used to quickly phenotype large cohorts for GWAS, and that these models can increase statistical power in such studies. Although these examples were shown for eye traits predicted from retinal imaging, we look forward to exploring how this concept could generally apply to other diseases and data types.

Acknowledgments
We would like to especially thank co-author Dr. Anthony Khawaja of Moorfields Eye Hospital for contributing his extensive medical expertise. We also recognize the efforts of Professor Jamie Craig and colleagues for their exhaustive labeling of UK Biobank images, which allowed us to make comparisons with our method. Several authors of that work, as well as Professor Stuart MacGregor and collaborators in Australia and at Max Kelsen have independently replicated these findings, and we value these scientific contributions as well.

Source: Google AI Blog


New tools to support vaccine access and distribution

While over half of U.S. adults are fully vaccinated, vaccine uptake is slowing across the country. Research shows a variety of factors are preventing people from getting vaccinated — from physical access issues, like transportation challenges and not being able to take time off work, to concerns about safety and side effects. 

To help public health officials and researchers in the U.S. reach people facing these challenges, we’re introducing new tools to better understand the vaccination needs of a community. This builds on our work of providing data, insights and tools to public health, epidemiologists, researchers and policymakers since the early days of the pandemic. 

Equitable access to vaccinations 

For some people getting vaccinated is as simple as walking a few blocks to their local pharmacy. For others, it may be much more difficult and involve a long drive or navigating public transit. If public health officials, researchers and healthcare providers can identify areas where vaccination sites are inaccessible or hard to reach, they may be able to implement measures like pop-up vaccine sites or transportation support like ride vouchers.  

Our COVID-19 Vaccination Access Dataset, which is available to the public today, calculates travel time to vaccination sites to identify areas where it may be difficult to reach a site whether someone is walking, driving or taking public transportation. We prepared this dataset using Google Maps Platform Directions API, the same API that powers navigation in Google Maps. This dataset does not contain any user data.

This dataset will help power a new Vaccine Equity Plannerdashboard from Ariadne Labs, a joint center for health systems innovation at Brigham & Women’s Hospital and the Harvard T.H. Chan School of Public Health, and  Boston Children’s Hospital, the primary pediatric teaching affiliate of Harvard Medical School. . This dashboard integrates our dataset with data from other organizations, such as the CDC’s social vulnerability index, to identify “vaccine deserts,” or areas where people have little or no convenient access to a vaccine site, to inform interventions such as pop-up clinics or new sites. 

Vaccine Equity Planner dashboard for New York and Mississippi

Vaccine Equity Planner dashboard for New York and Mississippi.   

Understanding vaccine information needs 

Public health organizations have been the go-to sources for authoritative information throughout the pandemic, and have provided educational campaigns about the safety, efficacy and availability of vaccines. We’ve heard from public health organizations and researchers that they want access to localized and timely data about what information their communities are seeking so they can tailor their communication to people not yet vaccinated. 

In the coming weeks, we’ll introduce a COVID-19 Vaccination Search Insights tool to help public health officials and researchers explore vaccine-related concerns and the information needs of local communities. The tool will show trends representing the relative search interests across three search categories: all vaccine information, intent to get vaccinated (such as eligibility, availability and sites), and safety and side effects. Insights will be provided at the county and zip code level and updated weekly.  

The trends are based on aggregate and anonymized Google Search data so that no user information is included. The process to anonymize the COVID-19 Vaccination Search Insights is powered by differential privacy, a technique that adds noise to the data to provide privacy guarantees while preserving the overall quality of the data. The data can be compared across different regions and over time, without sharing the absolute number of queries in any given area. 

Both tools will initially be available in English and for the U.S. As we get more feedback from public health organizations, researchers, and the community at large, we’ll evaluate expanding these tools internationally.

With these insights, we hope that public health organizations and healthcare providers can more easily and effectively reach their communities. Google will continue to do its part by providing timely and accurate vaccine information and appointment availability to people in Search and supporting organizations focused on vaccine equity. 

Source: Search


Tracking data to advance health equity


Last year, I saw COVID-19 impact the lives of some of the strongest people I know because of their race, class and zip code — especially in my hard-hit hometown of Detroit. But I wasn’t the only one who witnessed this. We’ve all heard how the pandemic has affected vulnerable communities across the country due to structural and long-standing health inequities. Even so, there was no central resource to help consolidate, visualize and understand the data on a national scale. 


Over the past year a team of Google.org Fellows and I worked with the Satcher Health Leadership Institute at Morehouse School of Medicine and a multi-disciplinary Health Equity Taskforce to understand COVID-19 health inequities. Today, we released The Health Equity Tracker (HET), a publicly available data platform that visually displays and contextualizes the health disparities facing communities of color throughout the U.S.


With $1.5 million of Google.org grant funding and over 15,000 pro bono hours donated from 18 Google.org Fellows, the HET parses through a mountain of public health data to record COVID-19 cases, deaths and hospitalizations nationwide across race and ethnicity, sex and age, as well as state and county. The tracker also measures social and systemic factors — like poverty and lack of health insurance — that exacerbate these inequities and have resulted in higher COVID-19 death rates for people of color, especially Black and Latinx communities.  

The HET allows users to compare public health data on a local and national level.

The HET allows users to compare public health data on a local and national level. 

Collecting this data showed us where there are gaps in our knowledge. Public health data can be inconsistent, collected in silos or missing completely. Knowing where these blindspots are is valuable. When we’re aware of unknown or missing data, we’re able to take action toward improving data collection and reporting standards.


The tracker currently focuses on data analysis for COVID-19, but in the future we expect to be able to track additional conditions, like mental and behavioral health. And we’ll include analysis of health inequities for people with disabilities, the LGBTQ+ community and those facing socio economic challenges. 


For me, the process of creating this during a time of devastation has helped me translate mourning into meaning. Future generations deserve more complete, accurate, and representative data that can advance health equity in times of crisis and beyond


Watch Satcher Health Leadership Institute’s YouTube series to learn more about health equity tracker and the Google.org fellows who worked on it.