Tag Archives: Announcements

Get a deeper view of your iOS app installs

If you use AdMob or other mobile ad networks to drive installs of iOS apps, here's some good news: iOS install tracking is coming as a Public Beta in a few weeks to all Google Analytics accounts. This detailed view of iOS install campaigns will be available right in your Google Analytics interface.

Optimize your iOS install marketing programs
Install metrics are a useful way to measure your marketing campaign performance. However, not all marketing efforts create the same volume and quality of users. With these new reports, you'll see how one source performs compared to another, so you can optimize your marketing spend. You can even dive deeper into the same marketing channel to see how one campaign or ad is performing compared to another. 

For instance: If users coming from source X tend to use your app once and abandon it, while users from source Y tend to use it for eight months and generate $68 each in value, you'll know. And with Google Analytics' powerful segmentation, you can combine post-download metrics with your acquisition channels across all Google Analytics reports, to make even better decisions for your marketing programs.


New iOS install tracking report (click image for full-size).

Beyond the install
Google Analytics Certified partner InfoTrust is already finding that the feature helps them measure and optimize install campaign performance.

"Many of our customers have mobile apps that generate more traffic and engagement than their desktop properties. Their goals are to bring users back to the app consistently and drive more engagement through more relevant articles and products, and increasing subscriptions or purchases. Seeing which marketing campaigns drive iOS users to app installs, and what users do after the install, is critical when determining where to use marketing spend."

Amin Shawki, Analytics Manager 
InfoTrust, LLC

Mobile ad networks integrated with the new reporting include Aakri, AdMob, AppLovin, Millennial Media, MdotM, Taptica and Tapjoy, with more to come soon. These iOS integrations join our existing Android campaign measurement tools.

Getting started
Learn more and get started easily with this step-by-step guide.

We hope this iOS integration helps you make even better choices for your business and for your customers. Happy mobile analyzing!

Posted by Rahul Oak, Product Manager, Google Analytics for Apps

Introducing Mobile App Analytics Fundamentals on Analytics Academy

So you’ve built an app? Awesome! But how are you tracking success? Does anyone know about your app? Do you have a good monetization plan? 

Today we’re excited to officially announce our newest Analytics Academy course, Mobile App Analytics Fundamentals, designed to help you answer these questions and more. 

Whether you’re an app developer or an experienced marketer in the mobile app space, knowing the fundamentals of mobile app measurement can help you improve your app marketing and monetization efforts. In this course, you’ll learn how to identify your most valuable users, how to find more of them, and how to tailor your monetization experience for different groups of users.


How it works
In this free online course, instructor Fontaine Foxworth will lead you through a series of conceptual training videos and interactive exercises to teach you about Mobile App Analytics. Throughout the course, she’ll use an example online gaming app called Go Fish!, which will demonstrate common Analytics use cases and help you apply what you learn to your own mobile app. 

After the course opens, you’ll have four weeks to earn a certificate of completion while working alongside a worldwide community of Analytics enthusiasts. In total, the course should take between two to four hours to complete.

Ready to sign up? Register now and join us when the course begins on Tuesday, November 18th.

We look forward to your participation in the course!


Post By: Christina Macholan & The Google Analytics Education Team

Measure What Matters Most: A Marketer’s Guide

It’s no secret that it takes many marketing touchpoints to connect with a customer, find a quality lead, or make a sale. But how do you know the right message to deliver at each point in that journey? How do you ensure that your investments are working, and that you’re not wasting money and resources, or worse, alienating your customers?

Better measurement is the answer. It’s the key to understanding and making the most of these interconnected touchpoints, but it's not always top of mind when building marketing campaigns.

Today, we’re releasing Measure What Matters Most: A Marketer’s Guide to help marketers make sense of today’s complex customer journey by laying a solid measurement foundation.


In this brief guide, we’ll look at four crucial tenets of measurement-focused marketing:
  1. Focus on the right metrics. Set yourself up for success by identifying clear metrics that you want to affect before launching a campaign.
  2. Value your best customers. Instead of measuring transactions alone, model the lifetime value you derive from your customers.
  3. Attribute value across the journey. To find out what’s working in your marketing and what’s not, identify the role of each touchpoint along the customer’s journey.
  4. Prove marketing impact. Use controlled experimentation to understand what happened only because of a given marketing spend change (and would not have happened without it).
Collectively, these points show how better measurement can improve campaign effectiveness, help you get the credit you deserve for your programs and, most importantly, ensure a better return on investment for all of your marketing. Download “Measure What Matters Most: A Marketer’s Guide” to find out how.

Posted by Sara Jablon Moked, Product Marketing Manager, Google Analytics

Brian Gavin Diamonds Sees 60% Increase in Customer Checkout with Enhanced Ecommerce

"Enhanced Ecommerce in Google Analytics made it extremely easy to analyze the metrics that are important to an ecommerce site and garner the insights to make smart changes to our website, driving significant improvements in performance!"
-- Danny Gavin, VP and Director of Marketing at Brian Gavin Diamonds

Our Enhanced Ecommerce features in Google Analytics are officially out of beta today, complete with brand new tools like Product Attribution. Combined with our new Shopping Campaigns report, Google Analytics provides our retail clients with an integrated view of their customers. As part of today’s announcements, we’re also excited to highlight partnerships with Shopify, PrestaShop, Blue Acorn for Magento, and mShopper. Using Enhanced Ecommerce in conjunction with our partners’ products simplifies the implementation process and gives you a full set of tools to create and optimize your ecommerce site. Please see the end of this post for more information about our partners’ solutions.

Understand customer behavior
Enhanced Ecommerce provides insight into the customer’s path to purchase, like when customers added items to cart, started the checkout process, and completed a purchase. Importantly, Enhanced Ecommerce gives you the ability to identify segments of customers who are falling out of the shopping funnel. You can then focus on these high intent-to-purchase customers with remarketing or by optimizing your checkout flow. Brian Gavin Diamonds, a Texas-based jewelry design house that is renowned for its signature hearts and arrows diamonds and custom jewelry design, used Enhanced Ecommerce to discover that in a single month they had missed out on more than half a million dollars in sales due to cart abandonment at the customer login page.  The company worked quickly to optimize their checkout flow with guest checkout functionality and immediately realized a 60% increase in customers completing the checkout process to payment.  You can read more about Brian Gavin Diamonds’ success with Enhanced Ecommerce in our case study.


Optimize online merchandising to increase sales 
Once you’ve gotten users to your site, Enhanced Ecommerce allows you to optimize the onsite experience to drive sales. By using Product Lists, you can identify how customers are discovering and interacting with products before purchasing them. Armed with this information, you can analyze your onsite promotions in order to build a more effective merchandising strategy, or use the product attribution functionality to understand which product lists drive conversions.

In an increasingly mobile world, this information is critically important since screen real estate is limited and must be used wisely. For retailers with mobile apps, the Google Analytics SDK fully supports Enhanced Ecommerce, so you can do rich analysis of product performance and customer behavior across all sales channels.  Across both desktop and mobile, Enhanced Ecommerce delivers the information you need to increase sales on your site.

Drive revenue with Shopping Campaign reports
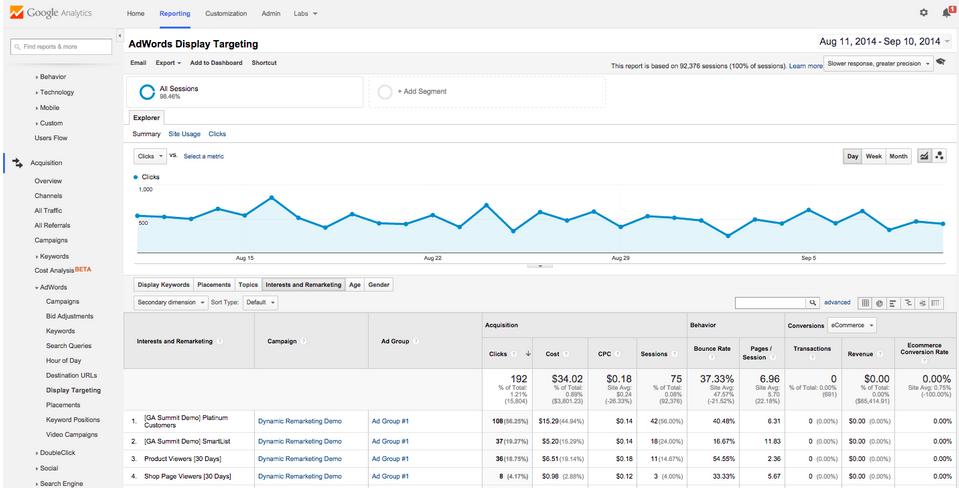
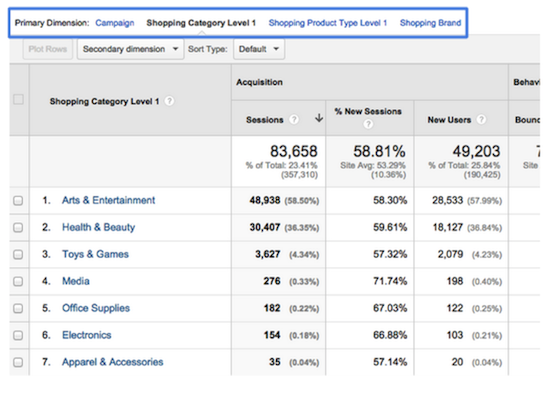
Today, we’re also introducing a new Shopping Campaigns report as part of the AdWords reporting section in Google Analytics.  This feature will be rolled out over the next few weeks and will allow you to analyze the performance of your shopping campaigns.  With this functionality, you’ll have the ability to understand the product categories/types that are driving site engagement and revenue and use this information to optimize your bids.  So, how can you get started?  If you have already linked your Adwords and your Google Analytics accounts, this report will automatically appear in the Adwords reporting section of your Analytics account.  Not linked yet?  Simply follow these instructions to link the two accounts.


Get Enhanced Ecommerce with our partner integrations
Shopify, PrestaShop, Blue Acorn for Magento, and mShopper have partnered with us to integrate Enhanced Ecommerce as part of their ecommerce solutions. If you’re using one of these platforms, you can take advantage of Enhanced Ecommerce by enabling one of these pre-built integrations.  Shopify’s solution is available today while solutions for Prestashop, Blue Acorn, and mShopper will be available in the coming week. To learn more about our featured partners, please visit our partner page

Google Analytics Enhanced Ecommerce is built to help you understand your customers and optimize your sales conversions. Combined with Shopping Campaign reports, Google Analytics is a complete solution for ecommerce businesses.  For more information about how to implement this feature in your Google Analytics account, please see the documentation available in our help center.

Posted by Marcia Jung, Product Manager, on behalf of the Google Analytics team

More about our partners

Shopify is a commerce platform that allows anyone to easily sell online, at their retail location, and everywhere in between. Shopify offers a professional online storefront, a payment solution to accept credit cards, a point of sale system to power retail sales and a card reader to process credit card transactions through a mobile phone. Shopify currently powers over 120,000 retailers in 150 different countries, including: Tesla Motors, Gatorade, Google, Wikipedia, LA Lakers, CrossFit, and many more. 

PrestaShop is a world industry leader in Open Source solutions for ecommerce, whose mission is to challenge ecommerce limits by developing a powerful solution that is accessible to anyone, anywhere. Through the Open Source software, PrestaShop allows everyone to create online stores quickly, easily and for free. The company currently counts more than 200,000 online stores worldwide, 700,000 community members and over 4 million software downloads.

Blue Acorn is a premium eCommerce agency dedicated to helping retailers and brands achieve revenue growth through a comprehensive, data-driven approach. In order to best support this approach, they became the first Magento Solution Partner in the world to also hold certified partnerships with Google and Optimizely. By integrating data and testing throughout their services, they are able to help their clients make the best decisions possible and further support their best-in-class design, development, and optimization capabilities.

mShopper is a leading mobile commerce platform that allows retailers to create custom, mobile-optimized e-commerce sites designed specifically to increase sales on mobile devices. The integration with Enhanced Ecommerce will provide a dramatic impact on mobile commerce conversions for retailers by delivering superior insight on product sales and overall campaign performance. mShopper recently launched mStore® v4.1 with marketing tools and a performance dashboard to drive conversions and improve sales for customers using mobile devices as well.


Making tag management more accessible and powerful

Today we are happy to introduce improvements to Google Tag Manager that will make both marketing and IT teams happy
  • New APIs that tailor the power of Google Tag Manager to your unique needs
  • A new intuitive interface to help you launch and edit tags even faster
  • More 3rd-party templates to make tagging easier
Many large enterprises use Google Tag Manager to streamline and simplify website and mobile app tagging. It helps marketers control the end-to-end process of adding website tags, while IT departments save time they can spend on more strategic projects. InsureandGo has been using Google Tag Manager for all their tagging needs:

Before, we missed opportunities because tag changes required a website release. Since we’ve enabled Google Tag Manager on the site, it’s enabled the marketing team to measure more on-site actions. For example, using Google Tag Manager to track on-page events such as specific clicks and form submissions helps us understand more granular customer actions, how to market and what to sell. We can make decisions much quicker and see within a few weeks whether the strategy has worked, whereas before it would have taken six to nine months. Simon Everett, Head of Marketing

Let's look at the new features.


Introducing Google Tag Manager API

Sometimes you just want things your own way. We understand! The new full-featured Google Tag Manager API lets you customize the infrastructure to suit your needs, whether that means building your own tools or better integrations with your existing workflow. From creating and managing users to previewing and publishing containers and tags, the API provides all the power of the web interface.

For example, the new API makes it easy to manage user access in bulk. It's easy to set permissions for many users at once, or set up your own role-based permissions and let the API give the right level of access to the right people in your organization.

Agencies can use the API to easily manage large tagging setups for their clients: create a master container template, specify variations (such as the domain, or the ad campaign ID) in a Google Sheets doc, and use the API to automatically deploy to multiple containers and keep those containers in sync. 

Our partner Novartis has been able to scale more easily by using Google Tag Manager APIs:

We have a strong data-driven culture at Novartis and thus in the digital space we’re naturally interested in using data and insights to improve the usability and experience of our websites. With many brands and websites across the globe, collecting web analytics data can become time consuming. Two challenges we have faced are data consistency and tagging implementation across many sites. We developed a process where we use the Google Tag Manager API to eliminate a manual, error-prone, process and thus were able to shift our attention from several low-value tasks to determining how to create a great digital experience for our customers.
Angela Grammatas - Digital Analytics Manager for Novartis


More coverage for 3rd-party tags

Starting in the next few weeks, you'll see more 3rd-party templates in the tag creation flow. We've made it easier for marketers to add tags and minimize errors while doing so. When adding a new tag of your own, you'll select from a list of 3rd-party providers and be underway in just a few clicks. We now offer support for tags from AdRoll, Marin, Comscore, Bizo, Clicktale, Neustar, Distillery, Turn, Mediaplex, VisualDNA, quantcast, Criteo and many more to come soon. Don't see the tag you need? No problem: you can add it immediately as a custom HTML tag. You can also ask to have a new tag template included in future releases, as Tag Manager will continue to add new tag templates. You'll find the full list of tag templates in our help center.

Creating a new tag (click image for full-size).


A more intuitive interface

We think tag management should be easy even for non-technical users. Even if you're new to Google Tag Manager, you'll be using the improved interface within minutes. Tasks are intuitive and structured much the same way as in AdWords and Google Analytics. Our new updates include:
  • A default workflow that's simpler and clearer
  • Instant search and autocomplete that can help you find anything in your Google Tag Manager containers
  • New keyboard shortcuts to simplify life for power users
The goal: enable marketing managers to easily add and update tags.

The new container overview page (click image for full-size).

We are confident you'll find the new Google Tag Manager easier to use and a more powerful solution for your web and app tagging needs. If you are already using Google Tag Manager, you can try out the new user interface today by logging in your accounts and following the instructions. New to Google Tag Manager? Get started today!

Posted by Lukas Bergstrom, Product Manager Google Tag Manager

The Top 3 Google Analytics Configuration Issues Impacting your Data (and How to Fix Them)

Good data is important.  How important?  Studies show that inaccurate data has a direct impact on the bottom line of 88% of companies.  In fact, the average company loses 12% of its revenue due to bad data.  As you know, Google Analytics is a powerful product with a wealth of features to help you optimize your results online. However, to unleash the power of Google Analytics’ marketing tools, you must ensure the data collected is complete and of the highest quality. The insights that fuel action in Analytics depend on good data, especially for some of our advanced algorithmic marketing functionalities like data driven attribution.

Since its release two months ago, our popular new diagnostics tool is working hard to ensure you’re getting the best results. Today, we’d like to share insights into some of the most common account errors along with likely causes and suggested solutions. In particular, we’ll look at some solutions for when our diagnostics tool is telling you the following:  “Bad Default URL,” “Clicks and Sessions Discrepancy,” and “No Goal Conversions.”  Read on to understand the impact of these issues as well as their common causes.


Bad Default URL
“Data without quality is useless.”
João Correia, Analytics Strategist at Blast Analytics & Marketing

When you create a Google Analytics account for website tracking, one of the first questions we ask is for a default URL. This is generally the homepage of your website. Diagnostics ensures that you have tagged your default URL correctly for this property, and warns you if this is not the case. Having a properly tagged website is an essential step towards being able to understand consumer behavior.

This warning is generally caused by either missing or malformed tracking code installed on your default URL, or more simply a typo in the URL that was input. If the default URL is incorrect, simply login to your Google Analytics account, click the “Admin” button in the header, and click “Property Settings” to adjust your default URL. If the tracking code is flawed, you’ll want to talk to your webmaster and ask to have the tracking code correctly installed

Beyond the default URL, we also check for tracking code health across your site. We look for pages that have missing or malformed tags. And we continually run these checks, ensuring new pages you launch in the future also are properly tagged. 

Clicks / Session Discrepancies
"Diagnostics helped me identify and fix an AdWords data discrepancy in my account.  Without the tool, I may have never even realized that my data was inconsistent.  This is a great tool!"
Monika Rut-Koroglu, Digital Analytics and Optimization at FXCM

Google Analytics offers rich capabilities that help users share data with linked AdWords accounts and gain unique and powerful marketing insights. It’s common to expect the number of clicks you see in AdWords to match the number of sessions you see in Analytics; but this is not always the case. This discrepancy can slow down meaningful analysis, and is a situation that can and should be rectified.

The most common causes of this issue have to do with your configuration settings. For example, when you send ad clicks through a third party that redirects to your site; the third party will often times drop vital tagging parameters which are mandatory for Analytics and AdWords to associate clicks and sessions. Other examples are having AdWords auto-tagging disabled, and redirecting users to mobile sites while unintentionally dropping tagging parameters.

Fixes for these issues can vary; we have a detailed guide to walk users through this or you can follow prompts in Google Analytics when we identify specific actions for you to take. If you have a third party who uses redirects and drops parameters, talk to them to resolve the issue. If auto-tagging is disabled on your AdWords accounts, consider enabling it

No Goal Conversions
“[Google Analytics Diagnostics] is a great idea... Just discovered it the other day on my iPad. Helpful to let me redefine my goals better and find out what's not working.”
Sherri Matthew, Harpist and Small Business Owner

Google Analytics goals offer valuable ways to identify, track, and help you drive more valuable outcomes. Sometimes goals can break, and stop this critical stream of insights from reaching you. We run diagnostic checks to ensure your goals continually identify a steady flow of high value customers, and we warn you if this flow breaks.

The most common cause for goal breakage is when a goal is based on a URL that changes. If your webmaster updates the URLs on your site, and the URLs in the goal settings aren’t updated accordingly, this will cause your goal to stop tracking. The second most common cause for goals breaking is if the event tracking on your site changes and the events listed in the goal aren’t updated accordingly.

If you’ve had a goal break for these reasons, visit the “Admin” section via a link in the header of your Google Analytics account, and click “Goals” to correct your goal configurations.

More About Diagnostics
Google Analytics Diagnostics scans for problems every day (with some exceptions). It inspects your site tagging, account configuration, and reporting data for potential data-quality issues.  Only users with Edit permission can see and respond to diagnostics messages. Diagnostics honors the first response to a message; for example, when a user ignores a message, it is ignored for all users.

The tool currently scans for dozens of issues, and dozens more are planned. Just keep an eye on your account over time - it will notify you if and when new issues or opportunities are detected.


- Frank Kieviet and Matt Matyas, Google Analytics Team

Enhanced Google Analytics Audience Capabilities Come to Apps

Good news for mobile app developers: Audience Demographics and Interests Reporting and Remarketing are now available for apps in Google Analytics.  Just one of the improvements for audience segmentation and remarketing we're announcing today, these changes should make it even easier for all our advertisers to reach their high-value customer segments. 

In-App Audience Demographics Reporting and Remarketing

Good analytics are especially important to app developers. At Google I/O, Hovhannes Avoyan, the CEO and Founder of PicsArt , had this to say: 

“We need analytics to help us understand who our users are, how they interact with our application, how our application performs. With all that knowledge, we want to apply different monetization strategies to different kinds of users.” 

Now developers can see just how different user segments engage and monetize with In-App Audience Demographics Reporting

And it's more than just data. Analysts and developers can blend audience demographic and behavior data into detailed audience lists to be targeted with in app remarketing campaigns. In short, all the great remarketing capabilities for Google Analytics users on the web are now available for apps as well.

New In-App Audience Demographics Reporting

Segmentation and remarketing lists get an upgrade
Creating remarketing lists for apps and web is now even easier with recent upgrades to both segmentation and audience building. A streamlined creation flow for creating audiences allows users to go from segment to audience within clicks (plus a few bonus admin features like list renaming and automatic list sizing).

New Audience Builder Experience, now supporting App lists
If you prefer to stand on the shoulders of remarketing giants, Analytics power users have developed and shared audience definitions that import via template links or from the solutions gallery. This simplifies things dramatically for new users. A process that could be complicated and time-consuming can now be done with 6 clicks in under 1 minute. Give it a try: import our Engagement Pack of Core Remarketing Lists.

On the segmentation side, users have told us they wanted segments to be more discoverable, easier to manage, and more intuitive to build. We've been listening, and have made interface improvements, adding a simple “Add Segment” button within reports, a new segment-selection interface, hover-over segment definitions, and a 1-click action dialogue to Share, Edit, Copy, Remove, or Remarket to a segment. 

New Segmentation Experience: fewer errors for better analysis

Measure remarketing performance with the new Display Targeting report
Once you’ve found a segment, created an audience, and activated your remarketing campaign, close the loop by measuring the performance of those audiences across all remarketing campaigns . Enter the new Adwords Display Targeting report in the Acquisition section to see all your active remarketing lists, along with impressions, spend, behavior, and conversion rates under the “Interests and Remarketing” tab.

New Remarketing List Performance in Display Targeting Report
You can learn how to update your SDK to enable these features in our Help Center or get started now by creating some remarketing lists. We hope that these improvements make your audience segmentation and remarketing-- in apps and on the web-- more intuitive and more effective. We’d love to hear from you! Please leave questions or feedback in the comments, and stay tuned for more audience-related improvements. 


Posted by Dan Stone, Product Manager, and Kanu Singhal, Technical Lead from the Google Analytics Audience Team

New Benchmarking Reports Help Twiddy Boost Email Open Rates by 500%

If you’ve ever wondered how your website is performing compared to the competition, our new Benchmarking reports in Google Analytics will help you find out.

Analytics users can now compare their results to peers in their industry, choosing from 1600 industry categories, 1250 markets and 7 size buckets. Benchmarking leverages the footprint of Google Analytics and can help you set meaningful targets, spot trends occurring across industries and answer a whole array of questions: Which channels should you be investing more in? How does your mobile engagement compare to your peers? How unique is your audience?

The new Benchmarking reports display acquisition and engagement metrics — like sessions and bounce rate — by Channel, Location, or Device Category dimensions. To ensure total data transparency, the number of properties contributing to the benchmark is displayed once you choose the industry, market and size. A helpful heat map feature makes it easy to see areas of strength and opportunity, and where to devote more resources.

Benchmarking in Action: Twiddy Finds a New Email Marketing Opportunity

Twiddy.com, a vacation rentals company in the Outer Banks-- a popular summer getaway destination-- has been using Benchmarking reports to help focus its marketing resources. A look at their peer benchmarks by channel showed that Twiddy was doing many things well during its peak summer booking season. Still, “it was clear we were missing a huge opportunity in email marketing,” reports CMO Ross Twiddy. His team used Google Analytics data to revamp their email marketing and improve the flow and process.

Email opportunity: Visitors from email spend nearly twice as long on site as the average, but user sessions generated from email are 82% below average and new users from the channel fall 91% below similar sites.

Twiddy even used Google Analytics to choose the best-selling messages for their email campaigns. Their analysis helped them zero in on the factors that were most consistent in repeat bookings: the price range, location, rental type, and even vacation week that would be most likely to convert with for each customer. "We launched an email last week based on our findings, and it shattered our email marketing records: a 48% average open rate and a 40% clickthrough rate,” says Ross.

Twiddy is happy with the new visibility they’ve gained: “The Benchmarking reports were powerful enough for us to reallocate time, budget and resources towards running down the deficiency. We can’t wait to start testing the reports out more broadly during the next peak booking season.”

Get Started with Benchmarking

Benchmarking reports can be found in the “Audience” section of the reporting interface and are rolling out over the next few weeks to all Google Analytics users who have opted in to share their data anonymously. If you want to join in, simply check the “Share anonymously with Google and others” box in the Account Settings tab of your account admin page. This is only the beginning for benchmarking within Google Analytics. We’ll be expanding these capabilities in the coming months, both incorporating conversion metrics and adding support for mobile apps. For more information on Benchmarking reports, check out our Help Center.

Posted by: Nikhil Roy, Product Manager, Google Analytics

New Cross-Platform Tools for Game Developers

By Ben Frenkel, Google Play Games team

There was a lot of excitement at Google I/O around Google Play Games, and today we’re delighted to share that the following tools are now available:

  • Updated Play Games cross-platform C++ SDK
  • Updated Play Games SDK for iOS
  • New game services alerts in the Developer Console

Here's a quick look at the cool new stuff for developers.

Updated Play Games C++ SDK

We've updated the Google Play Games C++ SDK with more cross-platform support for the new services and experiences we announced at I/O. Learn more»

The new C++ SDK now supports all of the following:

Cocos2D-x, a popular game engine, is an early adopter of the Play Games C++ SDK and is bringing the power of Play Games to their developers. Additionally, the Cocos2D-x team created Wagon War, a prototype game showcasing the capabilities of the Cocos2D-x engine with Play Games C++ SDK integration.

Wagon War is also a powerful reference for developers — it gives you immediately usable code samples to accelerate your C++ implementations. You can browse or download the game sources on the Wagon War page on GitHub.

Updated Play Games iOS SDK

The Play Games iOS SDK is now updated with support for Quests and Saved Games, enabling iOS developers to integrate the latest services and experiences with the Objective-C based tool-chains they are already familiar with. Learn more»

The new Play Games SDK for iOS now supports all of the following:

  • Quests and Events. Learn more»
  • Saved Games. Learn more»
  • Game Profile and related Player XP APIs — the SDK now also provides the UI for Game Profile and access to Player XP data for players.

New types of games services alerts

Last, you can now see new types of games services alerts in the Developer Console to learn about issues that might be affecting your users' gameplay experiences. For example, if your app implements Game Gifts, you'll now see an alert when players are unable to send a gift; if your app implements Multiplayer, you'll now see an alert when players are unable to join a match. Learn more»

Avvo Gains New Insights with Data Import

Companies use many systems to run their business. These may include multiple web advertising networks, CRM and content publishing systems, point of sale systems, inventory databases, etc. Integrating the data from these systems with Google Analytics provides a better understanding for how your customers behave on the web. 

At the 2014 Analytics Summit we announced the new Data Import. Data Import helps unify data from your different business systems, allowing you to organize your data the same way your business is organized. This will allow for more accurate analysis and bringing together previously disparate datasets into one complete picture. Using Data Import, you can upload your brand’s existing data into Google Analytics and join it with GA data for reporting, segmentation and remarketing.

By using the Data Import functionality in Google Analytics Premium, consumer legal services brand Avvo created clear, accurate data, which continues to impact decisions across their organization. While Avvo already had a successful and fast-growing business, the lack of visibility into advertising success made it hard to align key revenue opportunities with actual site usage. Read the full case study here.


“We’ve been very pleased with the results that were realized using Data Import in Google Analytics to analyze client behavior on our website. This exercise has given us better insight into valuable data that will ultimately impact how we segment the market for legal services.” 
- Sendi Widjaja, Co-Founder & CTO, Avvo, Inc.

Data Import also now supports a new Query Time mode that allows you to join your data with historical GA data. With this mode you can:
  • Enhance existing, already processed GA data with imported dimensions and metrics.
  • Upload calculated values after a transaction occurs, like total customer spend, last transaction date, or a loyalty score.
  • Correct any errors in data you have uploaded to GA in the past.
Query Time mode is currently in whitelist release for Premium users. For more information, contact your Premium account manager. You can learn more about Premium here.

Illustration of a new Google Analytics report with data from multiple sources 

We are also introducing a new version of Cost Data import that provides more versatile support for importing historical data. Additionally, cost data  can now be uploaded directly  through the Google Analytics web interface (previously, data import  required using the GA API). Note: Users of the original cost data import  must migrate to the new version. Details can be found in the cost data migration guide.

How to get started using Data Import
For more information, read Data Import on the Google Analytics Help Center. Also check our new developer Data Import guides that will get you up and running in no time. Some features are currently not rolled out to all users. If you’d like to join the beta for full-access, sign-up here.

Posted by Nick Mihailovski, Jieyan Fan, Richard Maher, Rick Elliott and the Google Analytics Team