Tag Archives: Analytics API

Google Analytics is enhancing support for AMP on cache

With users getting more and more impatient with slow mobile pages, developers are increasingly investing in a faster web experience with solutions like Accelerated Mobile Pages (AMP). Billions of AMP pages have been published by all kinds of mobile sites – from news to recipes to e-commerce. With so much AMP content being published every week, Google Analytics continues to evolve to support those of our customers who have adopted AMP.

Today we are excited to be the first supporting vendor to announce a new service, Google’s AMP Client ID API, that will enable the same benefits for AMP pages displayed via Google surfaces. In May of this year we launched a solution to help you better understand your customers’ journeys across AMP and non-AMP experiences that were hosted on your own domain. Google’s AMP Client ID API will enable the same benefits for AMP pages displayed by Google such as in Google Search.

How will this work? 

This solution works by allowing your web pages, which may be partially served on Google platforms and partially on your domain, to communicate with each other. This communication happens via a newly introduced Google API and with Google Analytics such that it can understand if a user on your non-AMP pages had ever visited an AMP page displayed by Google. When true, Google Analytics can help you understand user behavior across these two page types as a single cohesive experience. 

To get started you’ll have to opt-in to this solution via a code change. The small code change is required on both your AMP and non-AMP websites to enable this as well as an acknowledgement of the new Google Analytics terms for usage of this API.


When will this happen? 

The ability to opt-in to this solution is available today and you can find code instructions and new terms here. Please review the documentation and opt-in when you are ready.

Are there any other implications of this change? 

Once you opt-in to this solution you will notice changes to some of your metrics. Your user and session metrics will drop down to more accurate counts as formerly distinct users are recognised as the same person, as well as related metrics that will also become more accurate (such as Time on Site and Bounce Rate). And New Users may rise temporarily. This is a function of the product more accurately counting your users. It's a one-time effect that will continue until all your users who have viewed AMP pages in the past return to your site (this can take a short or long period of time depending on how quickly your users return to your site/app). To get more detail about what may change, please read our help center article.

Opt into this new feature today to get deeper insight into how users are interacting with your AMP pages.

Happy Analyzing!
Wordsmith for Marketing: Using the Reporting API to automate agency client reports

This is a guest post by Cole Faloon, a developer for Wordsmith for Marketing at Automated Insights.

Digital marketing professionals live and breathe Google Analytics, AdWords and social media, constantly measuring just how well their strategies are performing. But communicating successes in client reports takes an inordinate amount of time. Enter Wordsmith for Marketing, the client reporting solution from Automated Insights that automatically transforms Google Analytics, AdWords and social data into plain-English reports.

The vastness of data in Google Analytics made it an obvious foundation for Wordsmith for Marketing. Our app is built around the Google Analytics Core Reporting API. The app pulls down metrics like visits, page views, and conversions for different periods, comparing the data across spans of time.

The API is flexible enough for us to receive dates at the ranges we need. We can slice up the data by pre-defined dimensions by week, month, and quarter.

Another feature we love? Google's implementation of the OAuth 2.0 Authorization Framework. It allows users of our solution to sign in with their Google account, getting us access to their Analytics data right away and creating a fluid user experience. They just log in and they’re ready to go.


Empowered by Google Analytics, we give marketers a clear explanation of how their clients’ digital marketing efforts are performing and advice on how to improve; they have the option of editing the reports to add finishing touches or comments before sending them on to their clients. Wordsmith for Marketing automatically produces insightful client-ready analysis, saving marketing agencies hundreds of hours and thousands of dollars while allowing them to better serve their clients. 


- The Google Analytics Developer Relations team, on behalf of Wordsmith for Marketing

Using Google Analytics to understand real-time messaging behavior

This is a guest post by Nico Miceli, a Google Developer Expert for Google Analytics, Technical Analytics Consultant on Team Demystified, quantified selfer, and all around curious guy. He blogs at nicomiceli.com and tweets from @nicomiceli.

Hello, my name is Nico, and I love data. I quantify everything, and the Google Analytics Measurement Protocol is my favorite way to do it.

With the Measurement Protocol, I can send, store, and visualize any data I want without having to build a backend collection system. I’ve even used it in my personal life to track my sleep patterns, the temperature in my house, and the number of times my brother’s cat actually uses his scratching post.

So when my team started using Slack, a real-time messaging app for teams, I wanted to get the stats. Which clients are contacting us most frequently? When are the contacting us? More importantly, who on our team is the wordiest and uses the most emojis? Out of the box, the app offered some data, but it wasn’t enough for me to answer all the questions I had.

After taking a look at the technical documentation for the messaging app, I realized that Google Analytics is the answer! With the Measurement Protocol and the Slack Real Time API, I could get SO MUCH DATA!! With help from fellow developer Joe Zeoli, Slackalytics was born.

Slackalytics (in beta) is a simple, open source bot for analyzing Slack messages. Built in node.js, it grabs messages from Slack (using the Slack Real Time Messaging API), does some textual analysis, and counts the occurrences of specific instances of words and symbols. Then, using the Measurement Protocol, it sends the data to your Google Analytics account. 


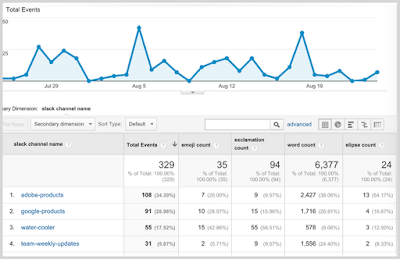
Screenshot of the report showing the custom metrics (emoji, exclamation, word, and ellipse counts) for different Slack channels.

Because the data gets stored in Google Analytics, you can visualized and analyze within the UI or use the Google Analytics Core Reporting API. I like to combine this data with other information so I have export it all into a Google sheet using the Google Analytics Spreadsheets Add-on.

In this beta version of Slackalytics, I’m using two Custom Dimensions: User ID, Channel Name... and six Custom Metrics: Word Count, Letter Count, Emoji Count :), Exclamation Count !!!, Question Count ???, Ellipse Count...

But this is just a fraction of what’s possible. Slackalytics is open source, so you can build your own version. If you’re a developer: Fork my project on GitHub.

If you’re not a developer: Fear not. You can still create your own messaging analysis bot by following my detailed walkthrough on setting this up.

Developer or not, you can build and test your own bot by using Google Analytics and any communication app that has a realtime API. Find out when your clients ask the most questions, monitor other integrations and bots, find out who talks in ☺     or build your own new Custom Dimension & Metrics combos.

- The Google Analytics Developer Relations team, on behalf of Nico Miceli

Google Analytics Demos & Tools

As a member of the Google Analytics Developer Relations team, I often hear from our community that they want to do more with GA but don't always know how. They know the basics but want to see full examples and demos that show how things should be built.

Well, we've been listening, and today I'm proud to announce the launch Google Analytics Demos & Tools, a new website geared toward helping Google Analytics developers tackle the challenges they face most often.


The site aims to make experienced developers more productive (we use it internally all the time) and to show new users what's possible and inspire them to leverage the platform to improve their business through advanced measurement and analysis.

Some highlights of the site include a full-featured Enhanced Ecommerce demo with code samples for both Google Analytics and Google Tag Manager, a new Account Explorer tool to help you quickly find the IDs you need for various Google Analytics services and 3rd party integrations, several examples of easy-to-build custom dashboards, and some old favorites like the Query Explorer.

Google Analytics Demos & Tools not only shows off Google Analytics technologies, it also uses them under the hood. All pages that require authorization use the Embed API to log users in, and usage statistics, including outbound link clicks, authorization status, client-side exceptions, and numerous other user interaction events are measured using analytics.js.

Every page that makes use of a Google Analytics technology lists that information in the footer, making it easy for developers to see how all the pieces fit together. In addition, the entire site is open sourced and available on Github, so you can dive in and see exactly how everything works.

Feedback is welcome and appreciated!

By: Philip Walton, Developer Programs Engineer

Making tag management more accessible and powerful

Today we are happy to introduce improvements to Google Tag Manager that will make both marketing and IT teams happy
  • New APIs that tailor the power of Google Tag Manager to your unique needs
  • A new intuitive interface to help you launch and edit tags even faster
  • More 3rd-party templates to make tagging easier
Many large enterprises use Google Tag Manager to streamline and simplify website and mobile app tagging. It helps marketers control the end-to-end process of adding website tags, while IT departments save time they can spend on more strategic projects. InsureandGo has been using Google Tag Manager for all their tagging needs:

Before, we missed opportunities because tag changes required a website release. Since we’ve enabled Google Tag Manager on the site, it’s enabled the marketing team to measure more on-site actions. For example, using Google Tag Manager to track on-page events such as specific clicks and form submissions helps us understand more granular customer actions, how to market and what to sell. We can make decisions much quicker and see within a few weeks whether the strategy has worked, whereas before it would have taken six to nine months. Simon Everett, Head of Marketing

Let's look at the new features.


Introducing Google Tag Manager API

Sometimes you just want things your own way. We understand! The new full-featured Google Tag Manager API lets you customize the infrastructure to suit your needs, whether that means building your own tools or better integrations with your existing workflow. From creating and managing users to previewing and publishing containers and tags, the API provides all the power of the web interface.

For example, the new API makes it easy to manage user access in bulk. It's easy to set permissions for many users at once, or set up your own role-based permissions and let the API give the right level of access to the right people in your organization.

Agencies can use the API to easily manage large tagging setups for their clients: create a master container template, specify variations (such as the domain, or the ad campaign ID) in a Google Sheets doc, and use the API to automatically deploy to multiple containers and keep those containers in sync. 

Our partner Novartis has been able to scale more easily by using Google Tag Manager APIs:

We have a strong data-driven culture at Novartis and thus in the digital space we’re naturally interested in using data and insights to improve the usability and experience of our websites. With many brands and websites across the globe, collecting web analytics data can become time consuming. Two challenges we have faced are data consistency and tagging implementation across many sites. We developed a process where we use the Google Tag Manager API to eliminate a manual, error-prone, process and thus were able to shift our attention from several low-value tasks to determining how to create a great digital experience for our customers.
Angela Grammatas - Digital Analytics Manager for Novartis


More coverage for 3rd-party tags

Starting in the next few weeks, you'll see more 3rd-party templates in the tag creation flow. We've made it easier for marketers to add tags and minimize errors while doing so. When adding a new tag of your own, you'll select from a list of 3rd-party providers and be underway in just a few clicks. We now offer support for tags from AdRoll, Marin, Comscore, Bizo, Clicktale, Neustar, Distillery, Turn, Mediaplex, VisualDNA, quantcast, Criteo and many more to come soon. Don't see the tag you need? No problem: you can add it immediately as a custom HTML tag. You can also ask to have a new tag template included in future releases, as Tag Manager will continue to add new tag templates. You'll find the full list of tag templates in our help center.

Creating a new tag (click image for full-size).


A more intuitive interface

We think tag management should be easy even for non-technical users. Even if you're new to Google Tag Manager, you'll be using the improved interface within minutes. Tasks are intuitive and structured much the same way as in AdWords and Google Analytics. Our new updates include:
  • A default workflow that's simpler and clearer
  • Instant search and autocomplete that can help you find anything in your Google Tag Manager containers
  • New keyboard shortcuts to simplify life for power users
The goal: enable marketing managers to easily add and update tags.

The new container overview page (click image for full-size).

We are confident you'll find the new Google Tag Manager easier to use and a more powerful solution for your web and app tagging needs. If you are already using Google Tag Manager, you can try out the new user interface today by logging in your accounts and following the instructions. New to Google Tag Manager? Get started today!

Posted by Lukas Bergstrom, Product Manager Google Tag Manager

New Google Analytics Premium Feature: Unsampled Reports in the Management API

Today, we are adding Unsampled Reports to the Google Analytics Management API for Google Analytics Premium customers. 

Accurate analysis when you’re not online
Enterprise analytics users need to execute complicated, ad hoc reports and download them into their own systems. The Unsampled Reports feature provides accurate analysis of large unsampled data sets. 

Easily integrate data
This enhancement to our Management API offers a new way to access unsampled data, so you’re free to spend more time on other strategic areas of your business. It also increases the integrity of the data in your internal systems and provides the flexibility to access your data in a way that best fits your business needs. For example, you can integrate the API into your Business Intelligence (BI) system to retrieve unsampled data, and to provide accurate metrics that support your critical business decisions.  

How it works
When you create an Unsampled Report using the API, it is processed in an offline manner. The completed reports are available through the API and under the Customization tab in the Unsampled Reports section. You can define whether you would like the report to be saved in Google Drive or in Google Cloud Storage. Read the Unsampled Reports API documentation for more details.

Posted by Yaniv Yaakubovich, Product Manager, Google Analytics Premium

New user and sequence based segments in the Core Reporting API

Segmentation is one of the most powerful analysis techniques in Google Analytics. It’s core to understanding your users, and allows you to make better marketing decisions. Using segmentation, you can uncover new insights such as:
  • How loyalty impacts content consumption
  • How search terms vary by region
  • How conversion rates differ across demographics
Last year, we announced a new version of segments that included a number of new features.

Today, we’ve added this powerful functionality to the Google Analytics Core Reporting API. Here's an overview of the new capabilities we added:

User Segmentation
Previously, advanced segments were solely based on sessions. With the new functionality in the API, you can now define user-based segments to answer questions like “How many users had more than $1,000 in revenue across all transactions in the date range?”

Example: &segment=users::condition::ga:transactionRevenue>1000

Try it in the Query Explorer.

Sequence-based Segments
Sequence-based segments provide an easy way to segment users based on a series of interactions. With the API, you can now define segments to answer questions like “How many users started at page 1, then later, in a different session, made a transaction?”

Example: segment=users::sequence::ga:pagePath==/shop/search;->>perHit::ga:transactionRevenue>10

Try it in the Query Explorer.

New Operators
To simplify building segments, we added a bunch of new operators to simplify filtering on dimensions whose values are numbers, and limiting metric values within ranges. Additionally, we updated segment definitions in the Management API segments collection.

Partner Solutions
Padicode, one of our Google Analytics Technology Partners, used the new sequence-based segments API feature in their funnel analysis product they call PadiTrack.

PadiTrack allows Google Analytics customers to create ad-hoc funnels to identify user flow bottlenecks. By fixing these bottlenecks, customers can improve performance, and increase overall conversion rate.

The tool is easy to use and allows customers to define an ad-hoc sequence of steps. The tool uses the Google Analytics API to report how many users completed, or abandoned, each step.

paditrack-horizontal-funnel.jpg

Funnel Analysis Report in PadiTrack

According to Claudiu Murariu, founder of Padicode, “For us, the new API has opened the gates for advanced reporting outside the Google Analytics interface. The ability to be able to do a quick query and find out how many people added a product to the shopping cart and at a later time purchased the products, allows managers, analysts and marketers to easily understand completion and abandonment rates. Now, analysis is about people and not abstract terms such as visits.”

The PadiTrack conversion funnel analysis tool is free to use. Learn more about PadiTrack on their website.

Resources

We’re looking forward to seeing what people build using this powerful new functionality.

Posted by Nick Mihailovski, Product Manager, Google Analytics team

Using Universal Analytics to Measure Movement

The following is a guest post by Benjamin Mangold, Director of Digital & Analytics at Loves Data, a Google Analytics Certified Partner.

Universal Analytics includes new JavaScript tracking code for websites and new mobile SDKs. But Universal Analytics is a lot more than that - it also gives us the Measurement Protocol, which allows us to send data to Google Analytics without the need to use the tracking code or SDKs.

Earlier this year, the team at Loves Data used Universal Analytics and the Measurement Protocol to measure their caffeine consumption and tie it to the team’s productivity. Our next challenge: measuring our team’s movement into Google Analytics. With the help of an Xbox Kinect, movement recognition software, and of course the Measurement Protocol, we started getting creative!


Business Applications and Analysis Opportunities

So measuring movement is fun and although we can measure total and unique dance moves you might be wondering about the business applications. This is where the power of measuring offline interactions can really start to be seen. The Measurement Protocol enables business applications such as:
  • Measuring in-store purchases and tying purchases to your online data
  • Understanding behaviour across any connected device, including gaming consoles
  • Comparing offline billboard impressions to online display ad impressions
  • Getting insights into your audience’s online to offline journey
Once you have tied your online and offline data together you can begin to analyze the full impact of your different touch points. For example, if you are collecting contact details online, you can use Google Analytics to then understand who actually converts offline, whether this conversion is attending an information session or making a purchase at a cash register. The analysis possibilities made available by the Measurement Protocol are truly amazing.

New Secondary Dimensions Provides Deeper Insights Into Your Users

Today we’ve added many new secondary dimensions to standard reports, including the much-asked for Custom Dimensions.


Custom Dimensions is a new Universal Analytics feature that allows you to bring custom business data into Google Analytics. For example, a custom dimension can be used to collect friendly page names, whether the user is logged in, or a user tier (like Gold, Platinum, or Diamond).

By using Custom Dimensions in secondary dimensions, you can now refine standard reports to obtain deeper insights.


In the report above, Direct Traffic delivers the most traffic, but these are Gold users (lower value). At the same time, Google Search delivers the third and fourth most site traffic and these are Diamond users (high value). Therefore, data shows this site should continue to invest in Google Search to attract more high value users.

The new data in secondary dimensions gives analysts a powerful new tool. We’d love to hear about any new insights in the comments.

Posted by Nick Mihailovski, Product Manager,